
A note on lower timeframe confirming price action…
Waiting for lower timeframe confirmation is our main tool to confirm strength within higher timeframe zones, andhas really been the key to our trading success. It takes a little time to understand the subtle nuances, however, as each trade is never the same, but once you master the rhythm so to speak, you will be saved from countless unnecessary losing trades. The following is a list of what we look for:
- A break/retest of supply or demand dependent on which way you’re trading.
- A trendline break/retest.
- Buying/selling tails – essentially we look for a cluster of very obvious spikes off of lower timeframe support and resistance levels within the higher timeframe zone.
- Candlestick patterns. We tend to only stick with pin bars and engulfing bars as these have proven to be the most effective.
EUR/USD:
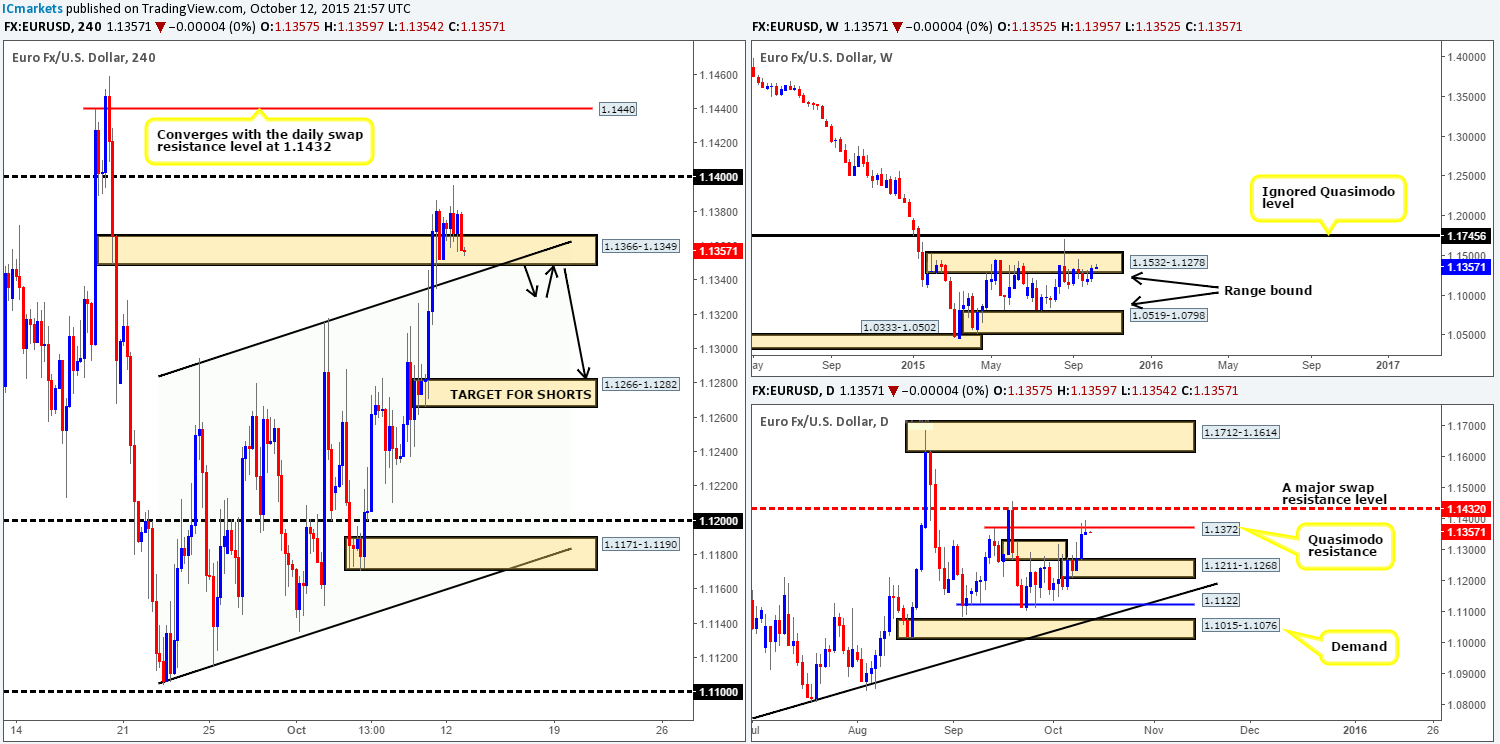
Throughout the course of yesterday’s sessions, the EUR currency pair spent much of its time consolidating just above the recently broken supply (now demand) at 1.1366-1.1349. Despite this, our bias on this pair remains south for the time being. Here’s why… for the past six weeks now, price has consolidated around the base of supply drawn from 1.1532-1.1278. In addition to this, yesterday’s daily action also printed a pin wick at the underside of a Quasimodo resistance barrier at 1.1372. This level – coupled with the major swap resistance line just above it at 1.1432 forms a relatively tight daily sell zone to keep an eye on this week.
With the above in mind, battle lines going into today’s sessions will be as follows (confirmation required at each level):
- At the extreme, we’d be looking to short the Quasimodo level at 1.1440. This barrier, as noted on the chart, converges beautifully with the aforementioned daily swap resistance line.
- Psychological resistance 1.1400 would also be another level we’d consider shorting today due to its position on the higher timeframe curve.
- Finally, if the EUR sells-off today without reaching any of the above figures, we’d then be watching for price to take out bids around the aforementioned 4hr swap (demand) area and top-side of the upward channel (1.1294). Should the above come to fruition, there may be an opportunity to trade this pair in the event that price retests the broken area before descending lower (see black arrows).
Levels to watch/live orders:
- Buys: Flat (Stop loss: N/A).
- Sells:1.1440 [Tentative – confirmation required] (Stop loss: dependent on where one confirms this level) 1.1400 [Tentative – confirmation required] (Stop loss: dependent on where one confirms this level) watch for bids at 1.1366-1.1349/top-side of upward channel to be consumed and look to enter on any retest seen at this area (confirmation required).
GBP/USD:
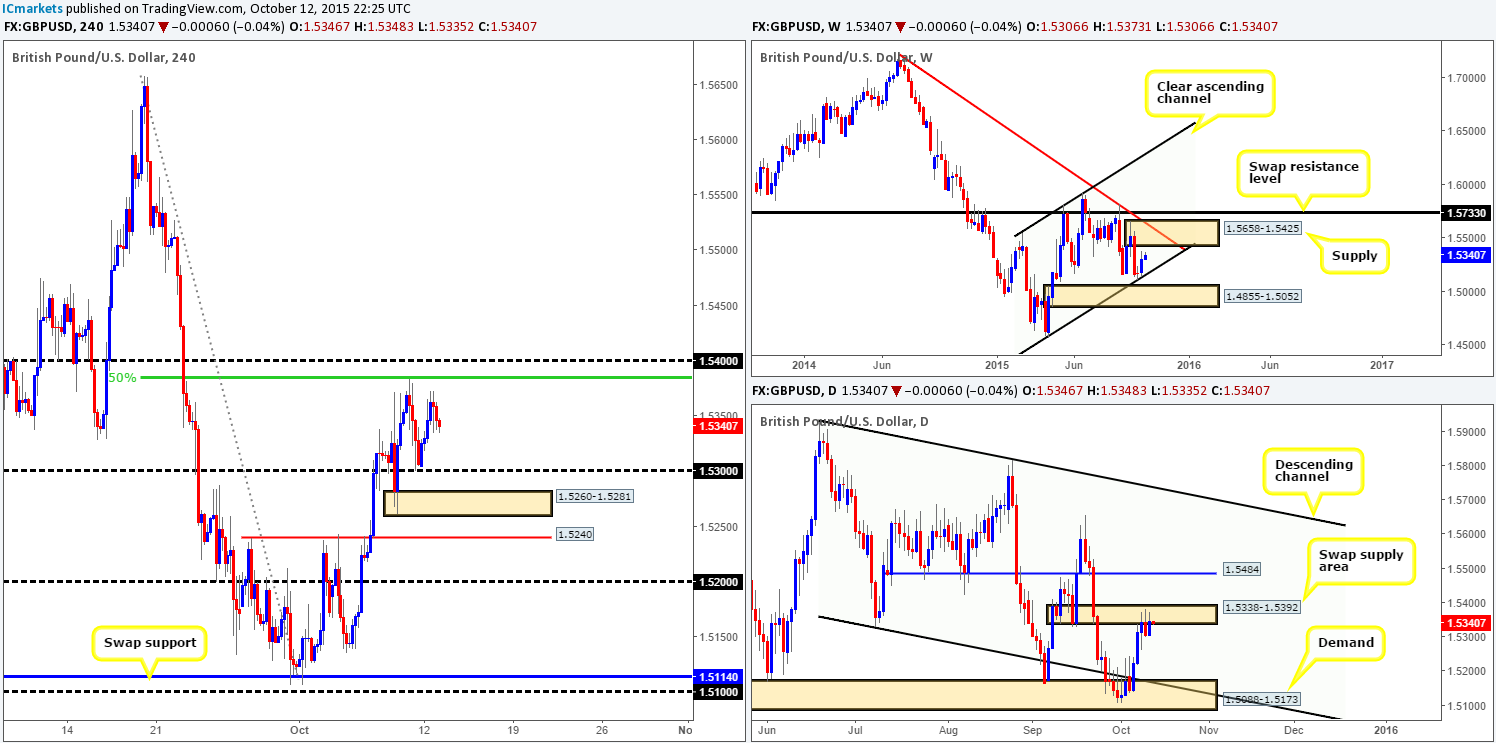
Kicking off our analysis this morning with a look at the weekly timeframe shows that price still has room to continue rallying this week up to supply coming in at 1.5658-1.5425. On the contrary, market activity on the daily timeframe reveals this pair is lodged beneath a swap supply zone at 1.5338-1.5392, printing three beautiful selling wicks in the process.
Turning our attention to the 4hr timeframe, we can see that the GBP rallied yesterday reaching highs of 1.5373 on the day before retracing down to the 1.5335 mark by the days end. With price now sandwiched between the combined 50.0% Fibonacci resistance at 1.5384/psychological resistance 1.5400 and psychological support at 1.5300, where do we go from here?
Well, given the clear difference of opinion on the higher timeframe structures at the moment, our team has decided to focus their energy on looking for small (confirmed) intraday bounces from pre-determined 4hr levels of interest today:
Buys:
- Psychological support 1.5300.
- Fresh demand coming in at 1.5260-1.5281.
Sells:
- The combined 50.0% Fibonacci resistance at 1.5384/psychological resistance 1.5400 region is likely a nice place to look for a confirmed bounce south.
Levels to watch/ live orders:
- Buys: 1.5300 [Tentative – confirmation required] (Stop loss: dependent on where one confirms this level) 1.5260-1.5281 [Tentative – confirmation required] (Stop loss: dependent on where one confirms this area).
- Sells: 1.5384/1.5400 [Tentative – confirmation required] (Stop loss: dependent on where one confirms this area).
AUD/USD: (Loss on our short from 0.73259)
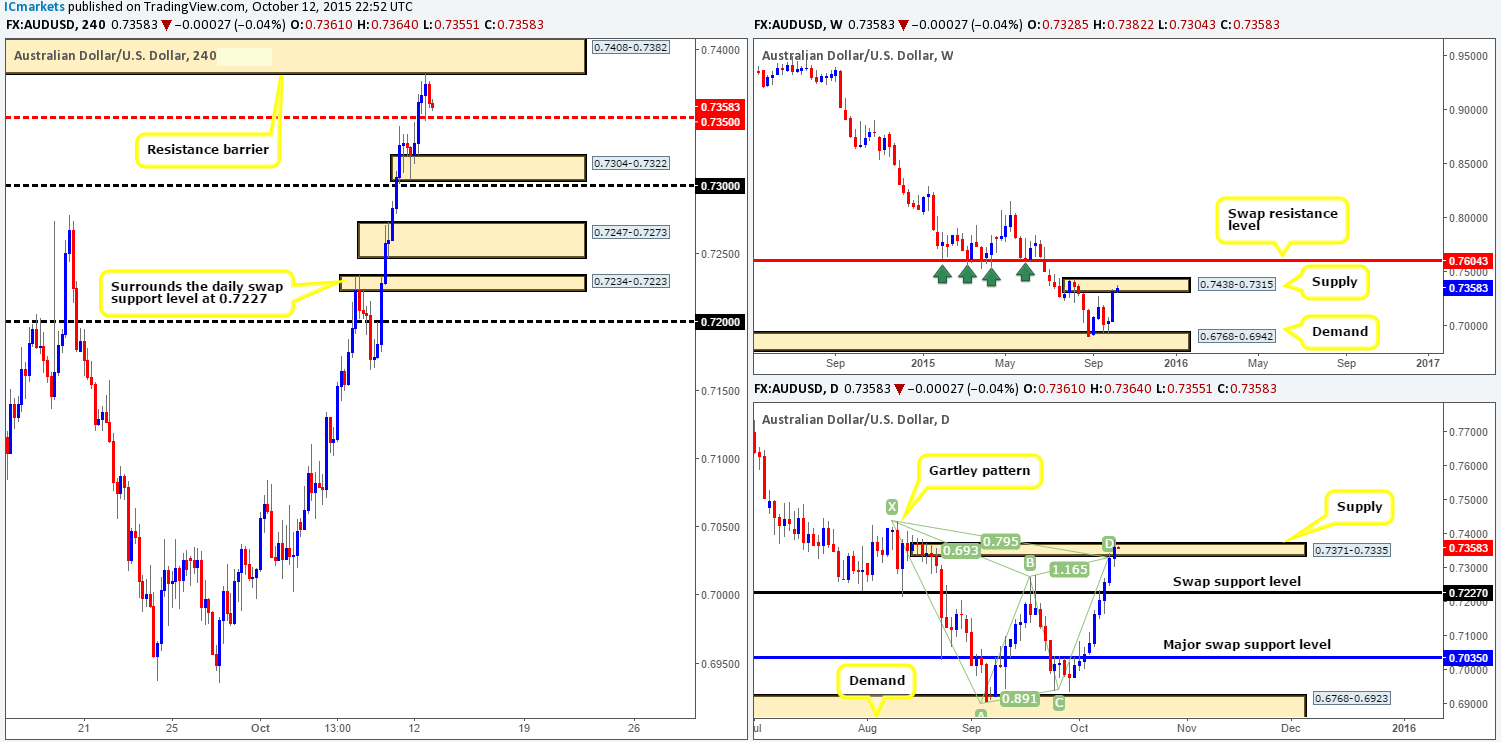
Following yesterday’s open 0.7328 the Aussie continued to appreciate against the U.S. dollar, taking out mid-level resistance 0.7350 and colliding with a resistance barrier falling in at 0.7408-0.7382. Despite our recent loss, our bearish bias on this pair, albeit technical, still holds.
Our reasoning lies within the higher timeframe structures. Weekly action remains kissing the underside of supply given at 0.7438-0.7315. Meanwhile, down on the daily chart, price has breached both supply at 0.7371-0.7335, and the completion point of our harmonic Gartley pattern seen at the base of this supply area. Granted, this does not echo strong bearish strength at the moment. Nonetheless, let’s not forget that the Gartley pattern will only be invalidated if point X is breached – the high of the above said weekly supply zone, 0.7438!
For all the above, however, there is not much room being seen on the 4hr scale to move lower. Near-term supports fall in at the mid-level number 0.7350, followed closely by demand sitting at 0.7304-0.7322 and psychological support at 0.7300. That being the case, from a risk/reward perspective, we feel that opting to stand on the sidelines may be the best path to take today.
Levels to watch/ live orders:
- Buys:Flat (Stop loss: N/A).
- Sells: Flat (Stop loss: N/A).
USD/JPY:
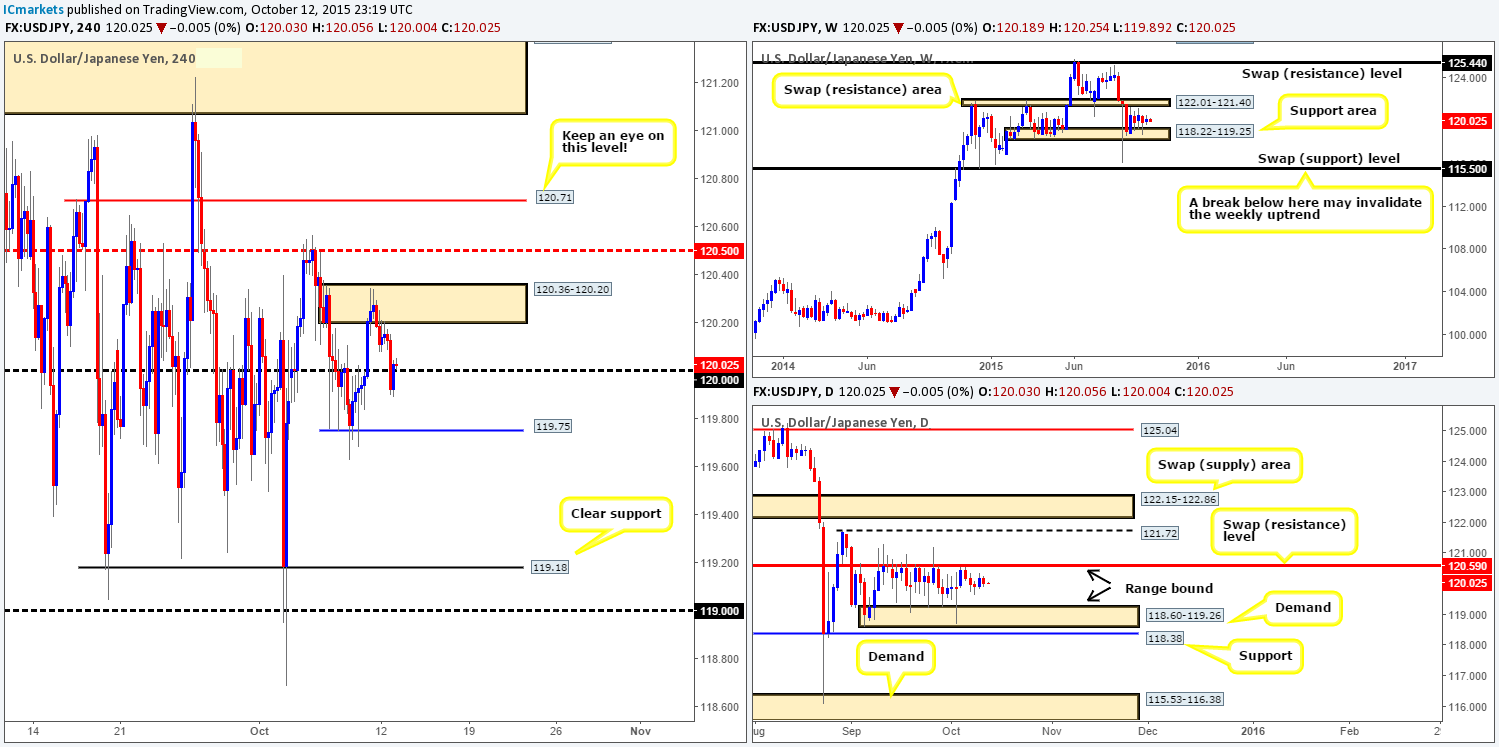
Yesterday’s action on the USD/JPY saw price eventually sell-off from supply at 120.36-120.20. This, as we can all see, aggressively attacked bids sitting at psychological support 120.00. Now, as we mentioned in Monday’s report, price has been far too choppy on the 4hr timeframe for our liking recently. On top of this, there is little direction being seen from either the weekly and daily charts at the moment, as both are currently range bound (122.01-121.40/118.22-119.25 – 120.59/118.60-119.26).
In view of the above, our team has come to a general consensus that no trade will be permitted on this pair this week UNLESS it converges with the higher timeframe extremes. With that, here is what we currently have our eye on at the moment:
Buys:
- 119.00/119.18. A clear support that coincides beautifully with both the above said weekly and daily demands (see above in bold).
Sells:
- Mid-level resistance 120.50. This beauty not only lines up nicely with the aforementioned daily upper range limit, but also has already proved its worth back on the 06/10/15 at 120.56.
- 120.71. This level is practically a hidden left shoulder. Since these levels usually see a bounce and considering the fact that it sits just above the daily 120.59 level.
Levels to watch/ live orders:
- Buys:119.00/119.18 [Tentative – confirmation required] (Stop loss: dependent on where one confirms this level).
- Sells:120.50 [Tentative – confirmation required] (Stop loss: dependent on where one confirms this level) 120.71 [Tentative – confirmation required] (Stop loss: dependent on where one confirms this level).
USD/CAD:
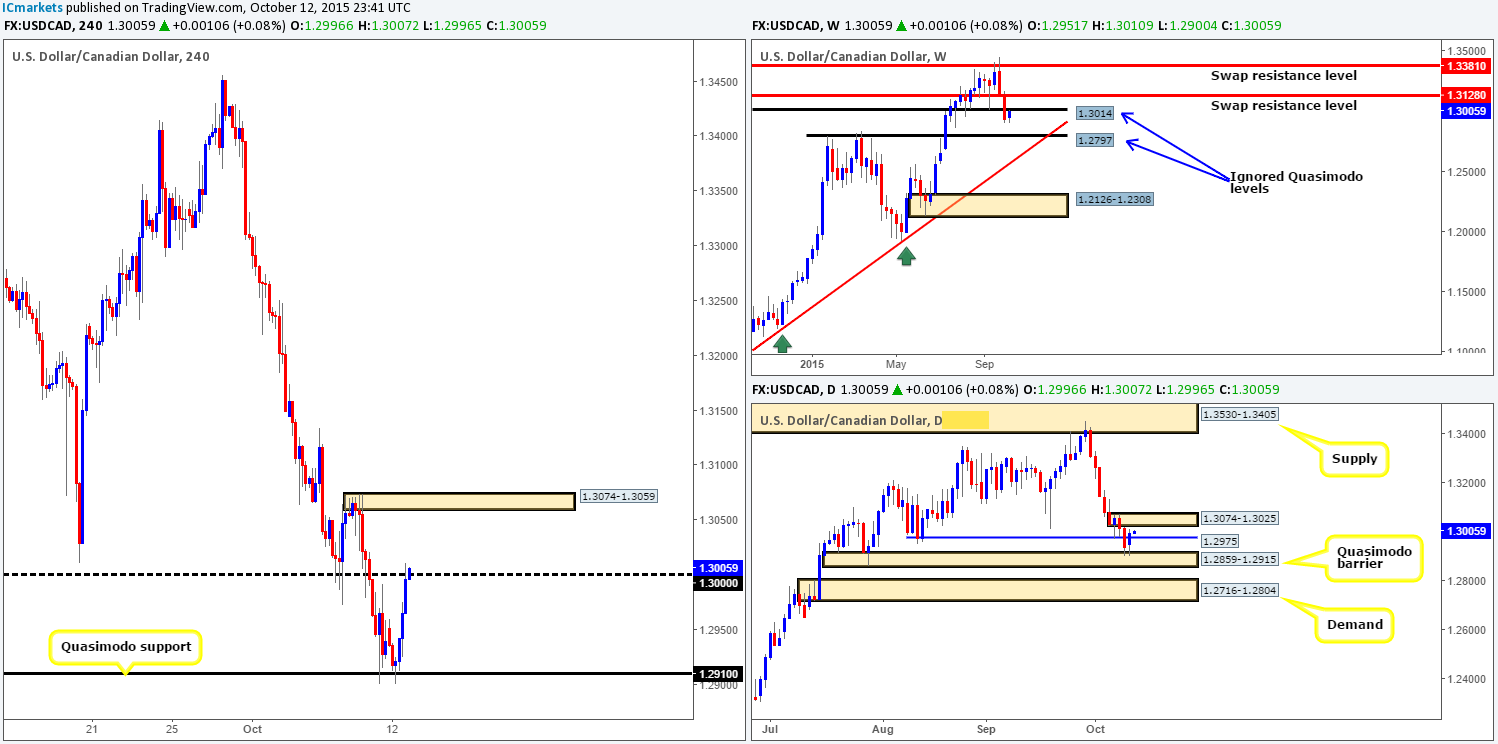
Working our way down from the weekly timeframe this morning shows that price is close to retesting the underside of a recently broken ignored Quasimodo level at 1.3014. Daily action, on the other hand, broke above swap resistance at 1.2975, and is, in our opinion, now free to advance north up to supply given at 1.3074-1.3025.
Shifting a gear lower to the 4hr timeframe reveals price beautifully rallied from the Quasimodo support at 1.2910 yesterday, sending this market up into the jaws of the large psychological resistance 1.1300 by the days end.
So, let’s just outline what we have here (see above for levels):
- Weekly – trading only a few pips from below an ignored Quasimodo swap (resistance) level.
- Daily – shows room to continue rallying at least until near-term supply.
- 4hr – currently flirting with a large psychological resistance barrier.
Taking the above into consideration, here is what we have logged so far for the upcoming sessions:
- Confirmed shorts from 1.3000 are possible seeing as it converges with the weekly level at 1.3014.
- In the event that 1.3000 gives way, however, we see a clear run up to supply coming in at 1.3074-1.3059. Traders could try and attempt to buy any confirmed retest seen at this level, or, simply wait to see if price reaches the above said supply to begin looking for confirmed shorts. We favor the latter since let’s not forget price would still be loitering very close to a weekly sell point at that time!
Levels to watch/ live orders:
- Buys:Watch for offers at 1.3000 to be consumed and look to enter on any retest seen at this level (confirmation required).
- Sells: 1.3000 [Tentative – confirmation required] (Stop loss: dependent on where one confirms this area) 1.3074-1.3059 [Tentative – confirmation required] (Stop loss: dependent on where one confirms this area).
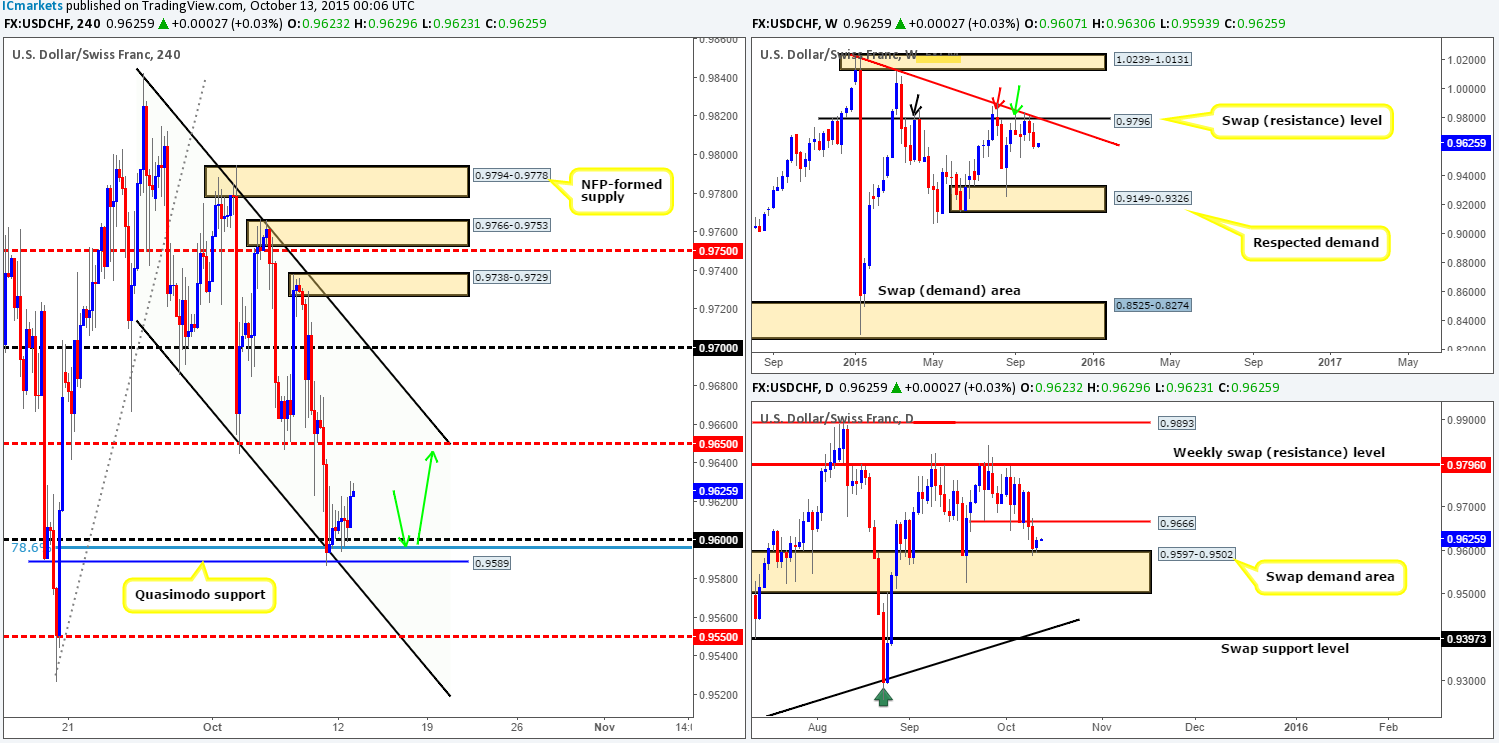
USD/CHF:
Following the open 0.9606, the market printed a collection of indecision candles above psychological support 0.9600. Despite this, the pair came alive going into the American afternoon session, rallying up to highs of 0.9630 on the day.
Seeing as price is now seen rebounding off a daily swap (demand) area at 0.9597-0.9502, we see very little, at least in the near-term, stopping price from reaching the mid-level resistance structure at 0.9650 today(16 pips below a daily swap resistance level at 0.9666). Risk/reward considerations would argue against entering long right now. The best, and in our opinion, most logical way to approach a buy in this market would be to wait for price to retest the 0.9600 region. In the event that this does occur without connecting with 0.9650 beforehand, we would, dependent on how the lower timeframe action responds, likely go long for a small intraday bounce up 0.9650 as per the green arrows.
Levels to watch/ live orders:
- Buys: 0.9600 region [Tentative – confirmation required] (Stop loss: dependent on where one confirms this level).
- Sells: Flat (Stop loss: N/A).
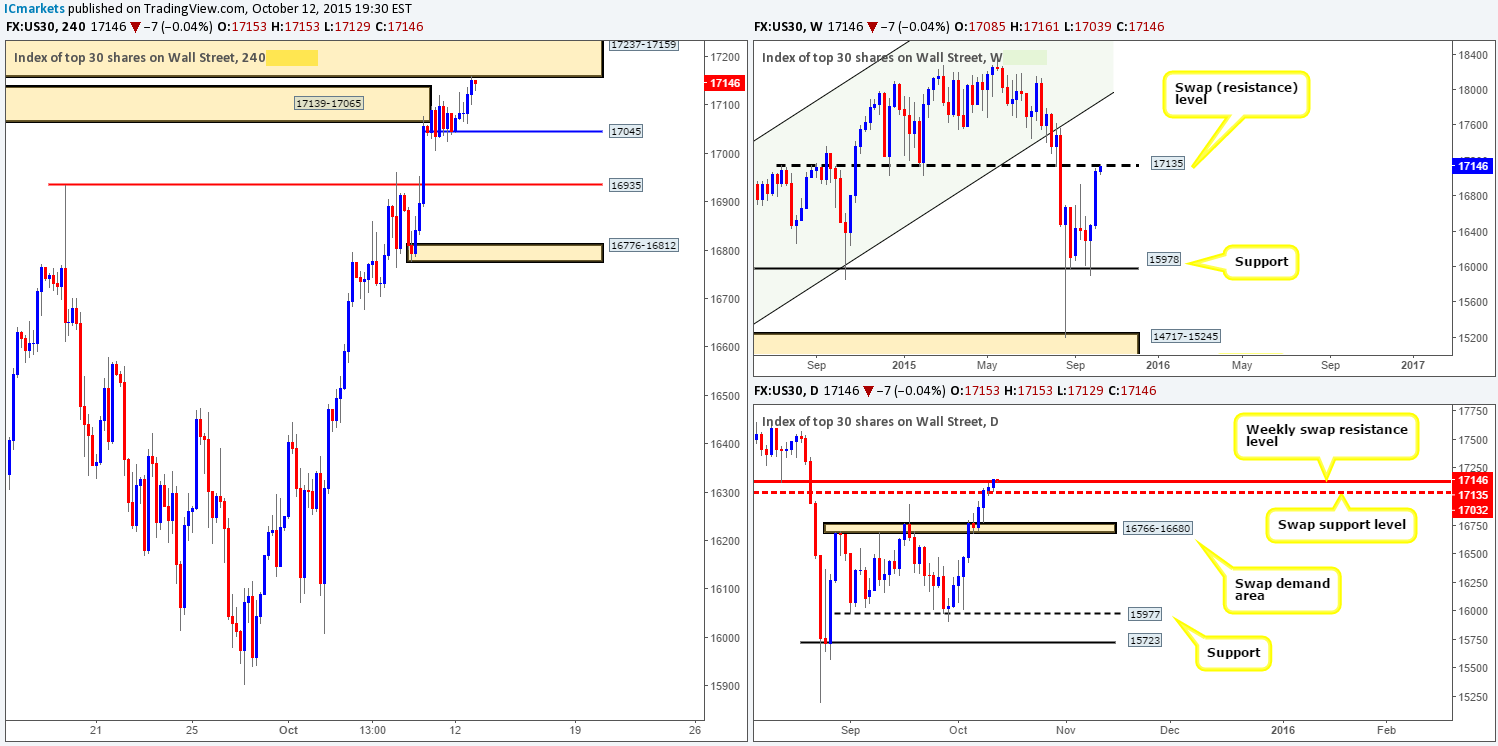
DOW 30:
The DOW, as you can see, continued to climb higher during yesterday’s sessions, resulting in the following taking place:
- 4hr supply at 17139-17065 taken out and the 4hr supply sitting just above at 17237-17159 was tagged into the action.
- Price is now kissing the weekly swap (resistance) level at 17135.
- Daily action shows that despite facing near-term weekly resistance, the recently broken daily resistance at 17032 is currently holding firm as support.
Although daily trade shows supportive pressure coming into this market at the moment, we just cannot ignore the fact that price is trading within a nice-looking 4hr supply that converges with a weekly resistance barrier (see above).
To that end, our objective for today is simple. Watch for lower timeframe selling confirmation within the current 4hr supply zone, targeting 17045 first and foremost. The reason for requiring confirmation at this area simply comes down to the daily timeframe recently closing above 17032 and holding as support.
Levels to watch/ live orders:
- Buys: Flat (Stop loss: N/A).
- Sells:17237-17159 [Tentative – confirmation required] (Stop loss: dependent on where one confirms this area).
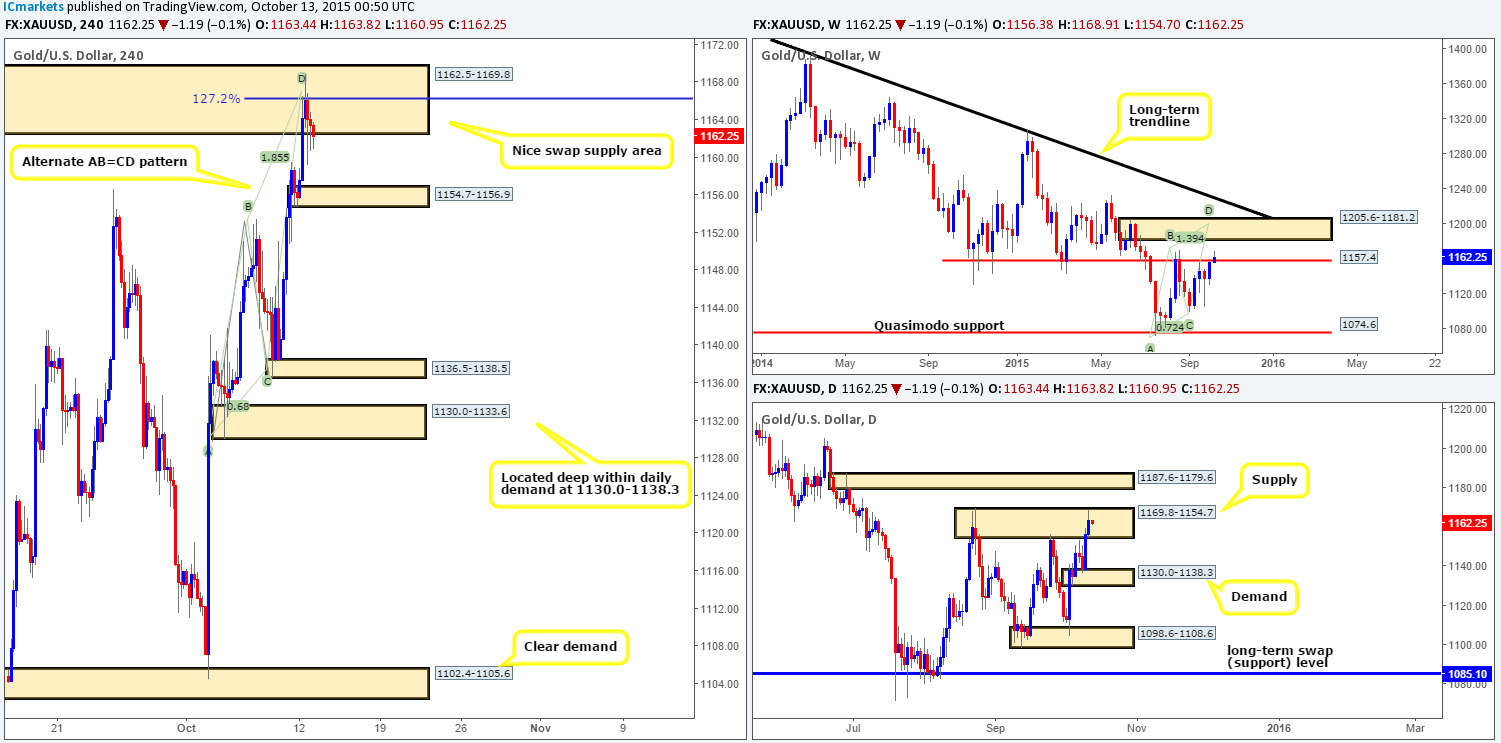
XAU/USD: (Gold)
As we can see from the 4hr chart, Gold continued to appreciate during trade yesterday. This pulled price up to the mouth of a relatively long-term swap resistance area drawn from 1162.5-1169.8. We are currently kicking ourselves here since the approach to this zone was an alternate AB=CD correction pattern! Notice how price responded beautifully to the Fibonacci 127.2% extension value at 1166.3! Alongside this, price was, and still is trading relatively deep within daily supply at 1169.8-1154.7, and also at the same time flirting with the weekly swap resistance level coming in at 1157.4.
All may not be lost here though traders. Granted, we may have missed the first boat leaving from the 127.2% level, but we could be given a second opportunity should price retest this hurdle once again today. Check out the hourly timeframe, there is a beautiful Quasimodo level sitting at the very same point as our 127.2% Fib line! Should price retest this Quasimodo today, we may, dependent on how the lower timeframes respond, take a short targeting 4hr demand given at 1154.7-1156.9.
Levels to watch/ live orders:
- Buys: Flat (Stop loss: N/A).
- Sells:1166.3 region[Tentative – confirmation required] (Stop loss: dependent on where one confirms this level).


