EUR/USD:
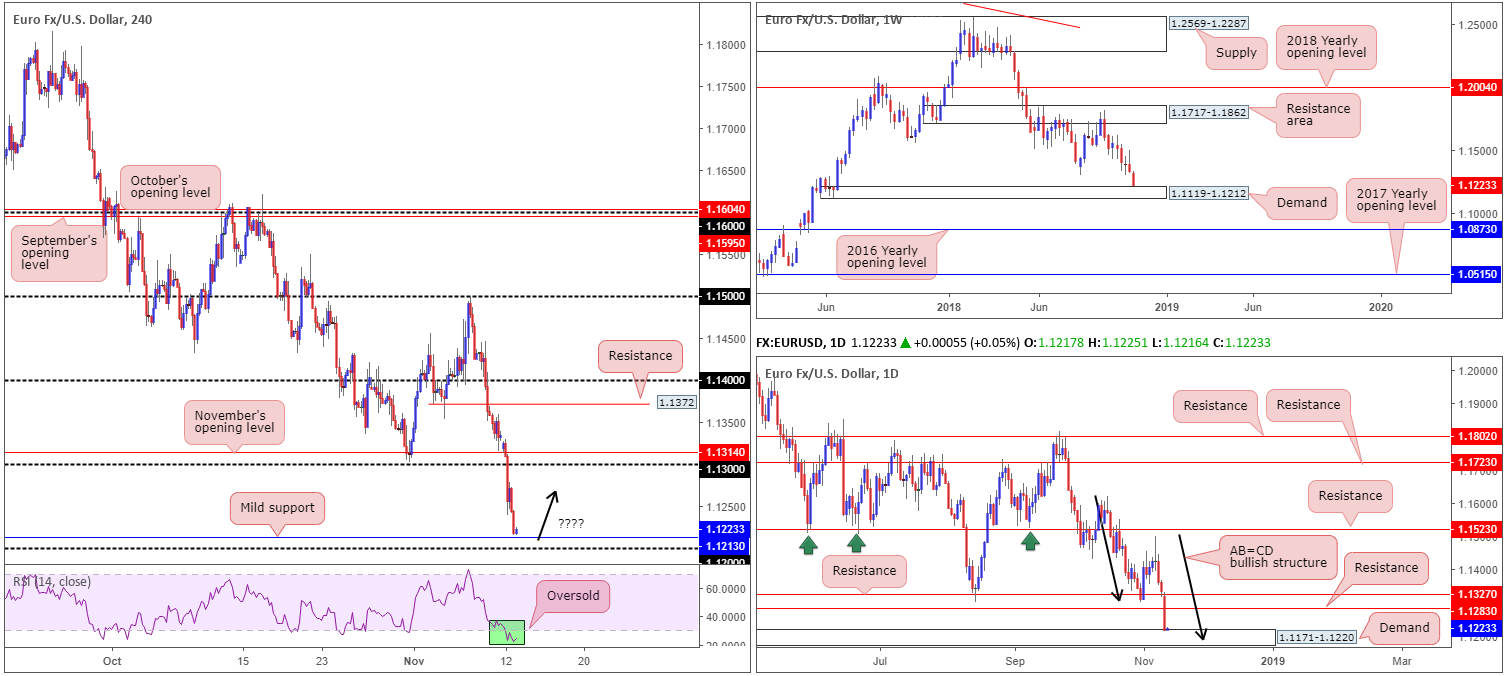
The single currency ceded further ground to the US dollar Monday, down 0.90% on the day.
Mounting tensions concerning Italy’s budget, as well as Brexit headers, weighed on the EUR/USD. After the pair tripped stops beneath the 1.13 handle during early European hours, selling pressure intensified, with only shallow bounces seen thereafter. As you can see, the unit ended the day printing fresh 2018 yearly lows of 1.1215, closing just north of support at 1.1213, followed closely by its 1.12 mark. Also of note on the H4 scale is the RSI indicator seen displaying a strong oversold reading.
The story on the bigger picture demonstrates strong demand. Daily action concluded Monday challenging the top edge of a demand base coming in at 1.1171-1.1220 in the shape of a near-full-bodied bearish candle. What’s also notable here is the overall approach comes in the form of a bullish AB=CD pattern (black arrows) terminating within the area at around 1.1190. Further adding to this, the daily zone is glued to the top edge of a weekly demand area at 1.1119-1.1212, along with the US dollar index (DXY) showing the dollar toying with weekly supply at 97.87-96.32.
Areas of consideration:
With higher-timeframe demand recently entering the fight, a long from 1.12ish could be something to consider. Waiting for additional candlestick confirmation to form before pulling the trigger is recommended (entry/stop parameters can be defined by the candlestick structure), given the precipitous decline witnessed recently, and a possible fakeout beneath 1.12 to bring in buyers from the daily AB=CD formation mentioned above at 1.1190. As for an initial upside target, 1.1250 is likely to hold active sellers, followed closely by daily resistance at 1.1283.
Today’s data points: German ZEW economic sentiment; FOMC member Brainard speaks.
GBP/USD:
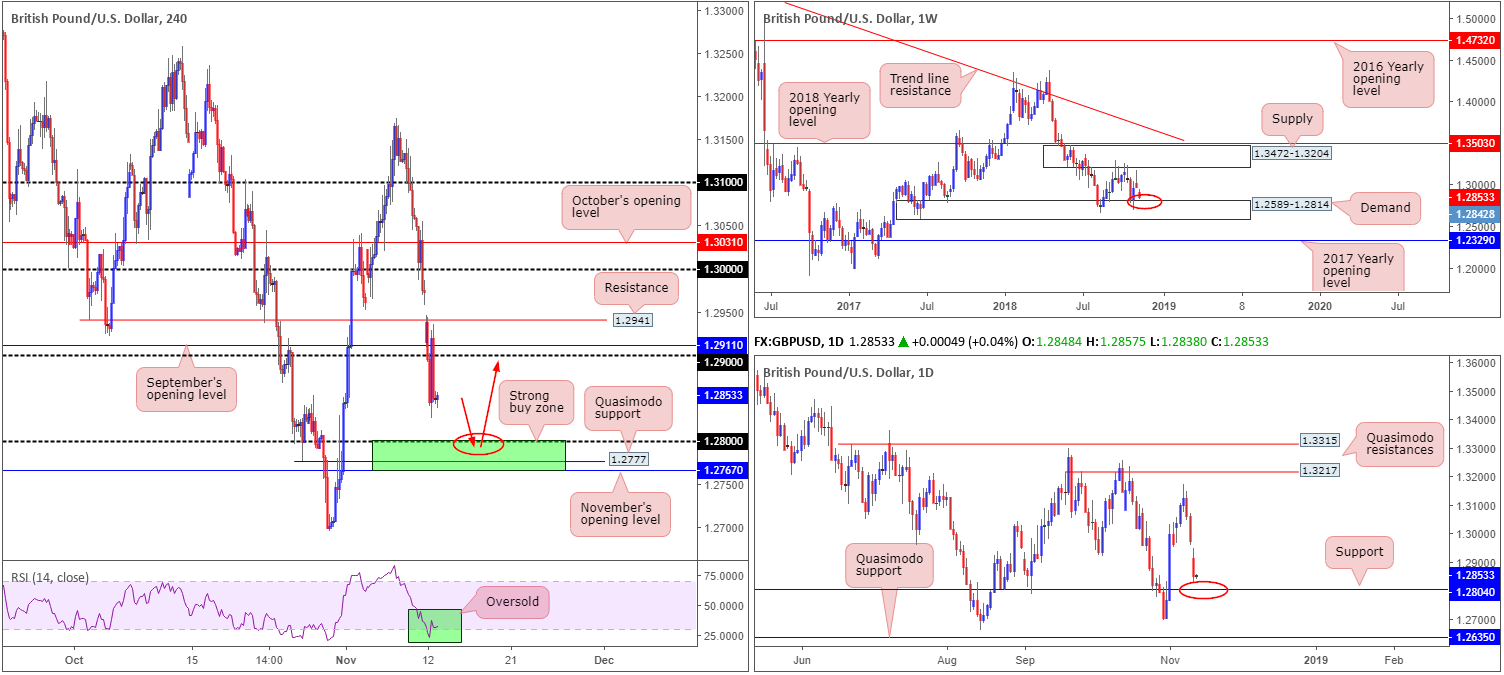
Continued uncertainty surrounding a satisfying Brexit agreement weighed on sterling bulls Monday, down 0.51% on the day. The 1.29 handle suffered a blow in early Europe, which was later retested as resistance going into the US session. On the whole, the H4 candles appear poised to press lower today and shake hands with 1.28. This psychological number entertains two nearby supports (green): the Quasimodo support at 1.2777 and November’s opening level at 1.2767. Further to this, the RSI is seen testing its oversold value.
Another factor in support of the 1.28 region is daily support priced in at 1.2804. This is further bolstered by a weekly demand area seen at 1.2589-1.2814.
Areas of consideration:
On account of the above reading, the ducks appear lining up for a possible test of the H4 (green) buy zone at 1.2767/1.28. A bounce from here by way of a H4 bullish candlestick pattern would likely draw in buyers (entry/stop parameters can be defined by the candlestick structure), with a strong possibility of price reaching 1.29 as an initial take-profit target. Despite this, traders will want to acknowledge we have scheduled news in early London hours today in the form of UK job’s data. Therefore, do bear this in mind should you be looking to trade this market.
Today’s data points: UK job’s figures; FOMC member Brainard speaks.
AUD/USD:
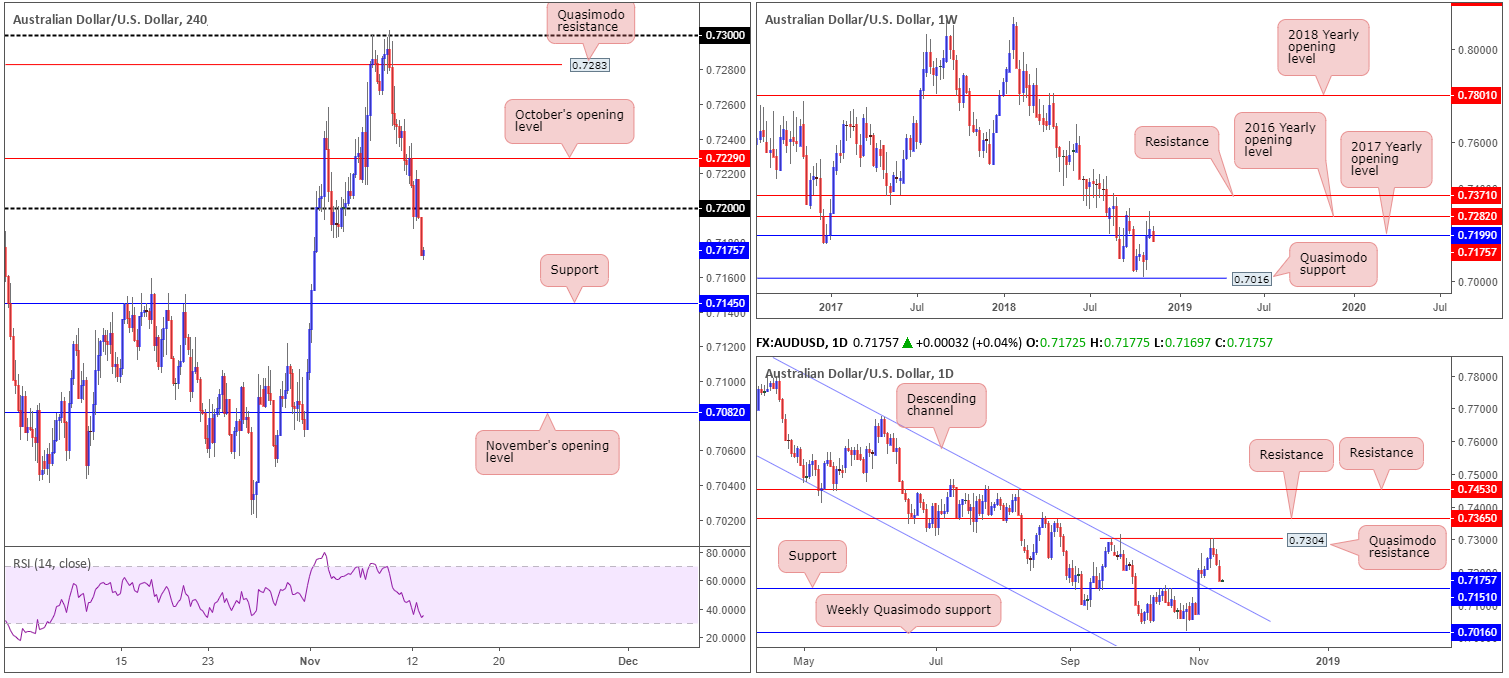
Strong demand for the US dollar, ongoing US-Chinese trade angst and limited higher-timeframe support pressured the AUD/USD to lower ground Monday, down 0.64%.
With the 0.72 handle out of the picture as support, scope for further downside towards H4 support at 0.7145 is potentially on the horizon today. This is further supported by the weekly and daily timeframes. The daily chart displays room to test nearby support at 0.7151, followed closely by a channel resistance-turned support (taken from the high 0.8135). Weekly price, on the other hand, recently pushed beneath its 2017 yearly opening level. Assuming the sellers remain defensive under here, the next downside target does not enter the mix until Quasimodo support at 0.7016.
Areas of consideration:
All three timeframes point to further selling, at least until we reach daily support priced in at 0.7151. To take advantage of this move, traders are urged to consider waiting and seeing if the H4 candles retest the underside of 0.72. A firm retest of this level – preferably in the form of a notable bearish candlestick pattern – would likely be enough evidence to suggest strong sellers are involved (entry/stop parameters can be defined by the candlestick structure).
Today’s data points: Australian NAB business confidence; FOMC member Brainard speaks.
USD/JPY:
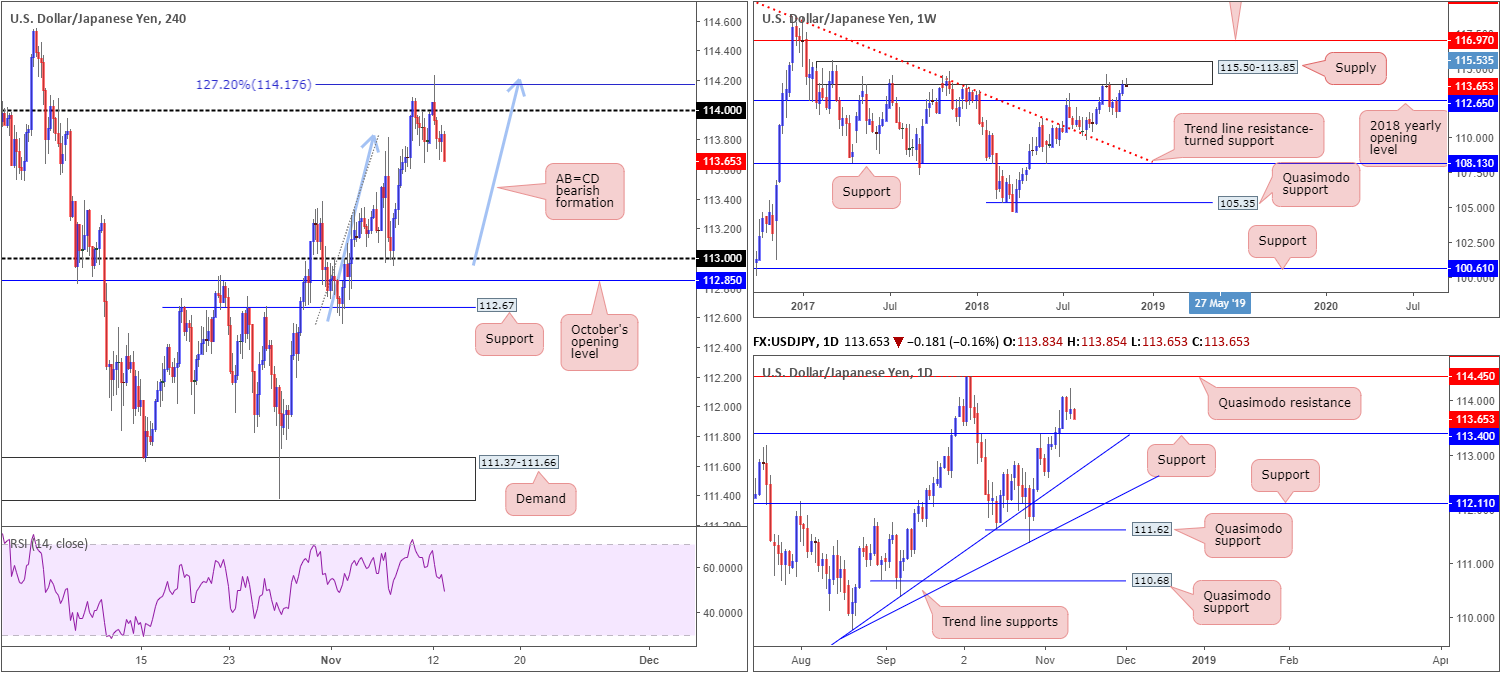
For folks who read Monday’s briefing you may recall the piece highlighted possible shorting opportunities around the 114.17 neighbourhood: a 127.2% (Fib ext.) H4 AB=CD (blue arrows) completion. The main attraction here, aside from the AB=CD formation, was the fact it completed around the underside of a weekly supply base coming in at 115.50-113.85.
As is evident from the H4 chart, 114.17 held almost to the pip. Well done to any of our readers who managed to jump aboard this move. Assuming H4 local support around 113.60 can be overthrown today, the next downside target from this point falls in around daily support at 113.40, followed then by the 113 handle.
Areas of consideration:
Traders who remain short the market, holding the position for a test of daily support mentioned above at 113.40, is an option.
For those who missed the initial short at 114.17 may receive a second opportunity to sell should the H4 candles retest the underside of 114 by way of a bearish candlestick pattern (entry/stop parameters can be defined by the candlestick structure).
Today’s data points: FOMC member Brainard speaks.
USD/CAD:
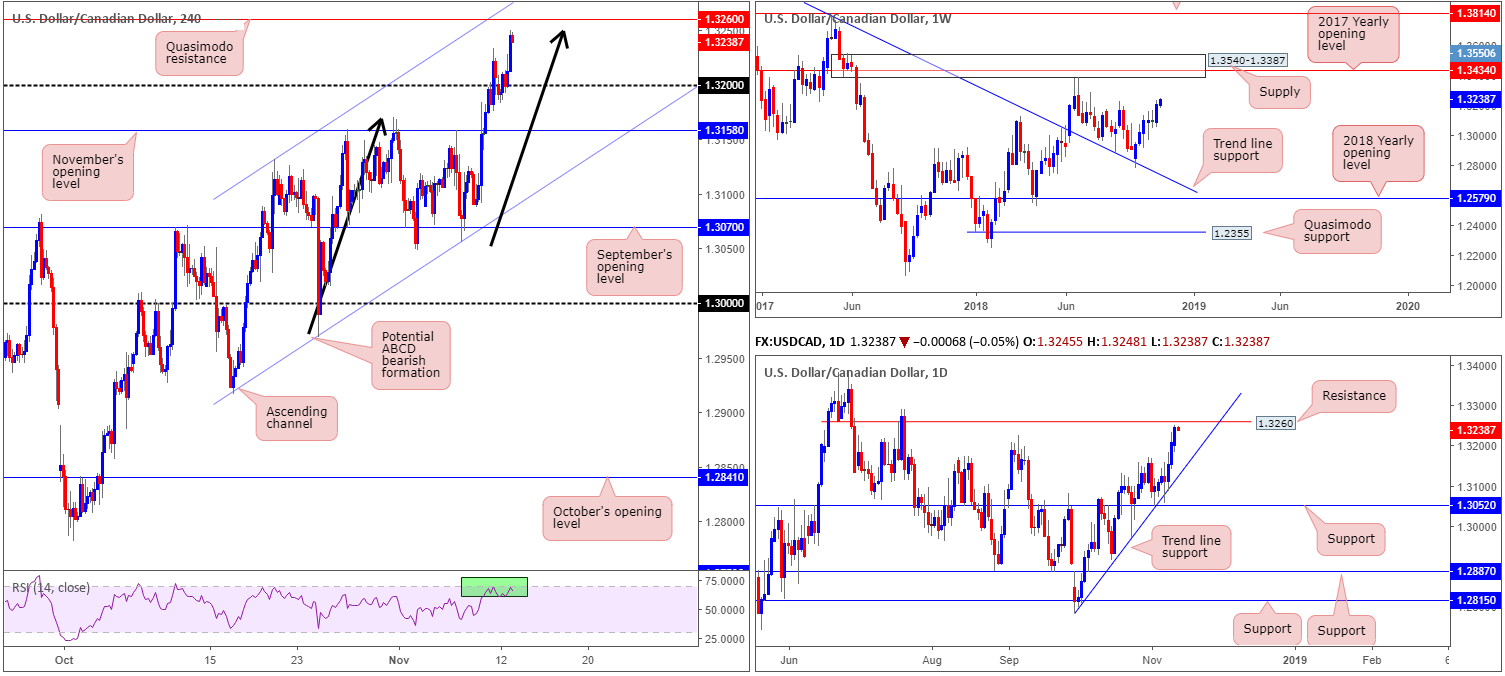
Broad-based USD buying propelled the USD/CAD higher Monday, registering its third consecutive daily gain. The 1.32 handle gave way, consequently drawing the spotlight towards a H4 Quasimodo resistance level at 1.3260. What’s also notable on the H4 timeframe is the ABCD approach that terminates around 1.3251, and nearby channel resistance (extended from the high 1.3132). Recent buying has also positioned the RSI indicator in overbought territory.
While the weekly timeframe shows the pair could potentially advance as far north as supply coming in at 1.3540-1.3387 (houses the 2017 yearly opening level within at 1.3434), daily movement also shows resistance offered around the 1.3260 point.
Areas of consideration:
The H4 Quasimodo resistance level at 1.3260 is key for sellers today. Not only does it hold nearby H4 confluence, it also represents daily resistance as well. To short from 1.3260, stop-loss placement can be positioned above the H4 channel resistance (around 1.3285ish), with an initial target objective set at 1.32.
For conservative traders, waiting for additional bearish candlestick confirmation is an option before pulling the trigger (entry/stop parameters can be defined by the candlestick structure).
Today’s data points: FOMC member Brainard speaks.
USD/CHF:
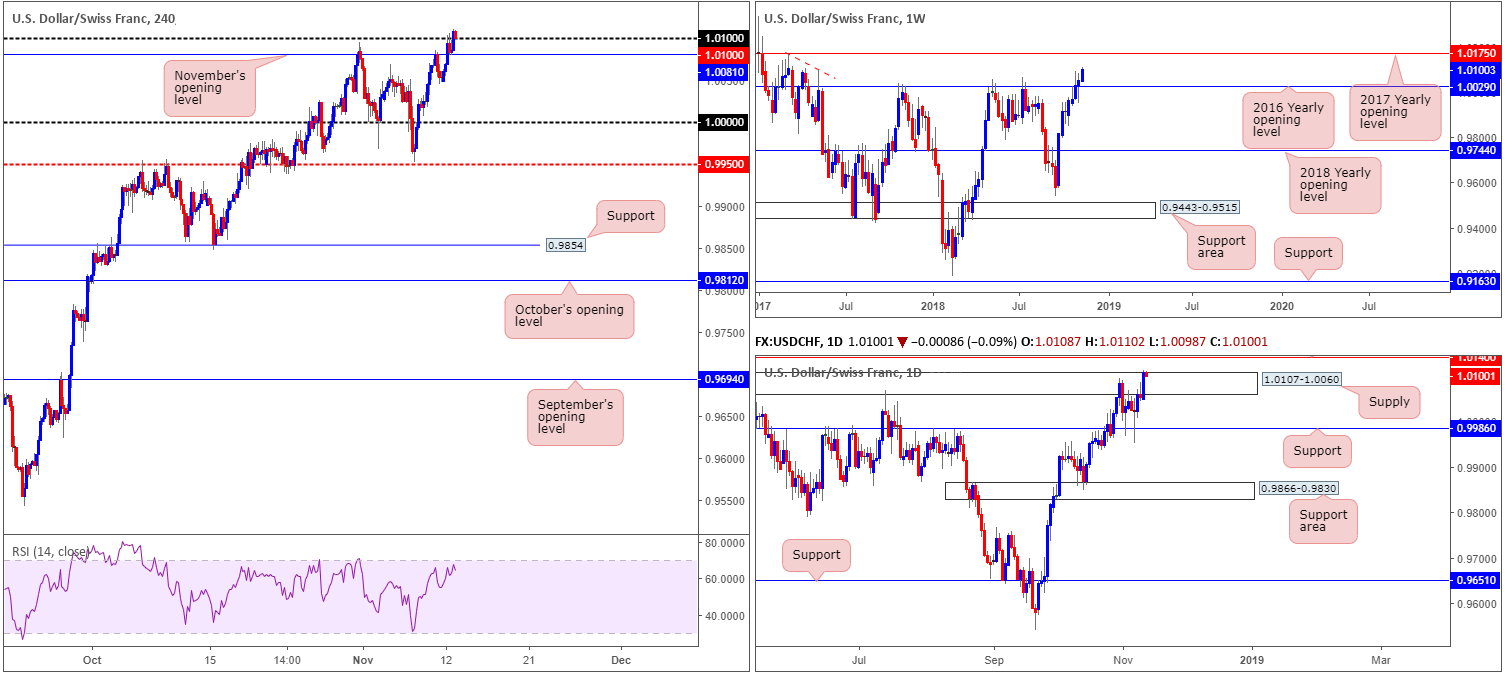
In recent sessions, the USD/CHF advanced higher. Ongoing selling pressure observed in euro and the pound helped the greenback find demand.
Of late, the pair conquered its 2016 yearly opening level at 1.0029 on the weekly timeframe, and possibly set the stage for a move north towards the 2017 yearly opening level at 1.0175. Daily flow, as of Monday’s close, is seen challenging the top edge of supply at 1.0107-1.0060. This could be enough to confirm further upside towards a Quasimodo resistance at 1.0140, followed then by the 2017 yearly open level mentioned above at 1.0175.
A closer look at price action on the H4 timeframe shows the pair retesting the top of 1.0100. Should this number hold ground, there’s little resistance seen overhead until we reach the daily Quasimodo resistance mentioned above at 1.0140.
Areas of consideration:
On the assumption H4 price defends the top edge of 1.0100, further buying could materialize towards the noted daily Quasimodo resistance. As for stop-loss placement, beneath 1.0081: November’s opening level, is an option.
In regard to selling, waiting to see if price strikes the 2017 yearly opening level at 1.0175 is recommended before looking to fade this bullish market.
Today’s data points: FOMC member Brainard speaks.
Dow Jones Industrial Average:
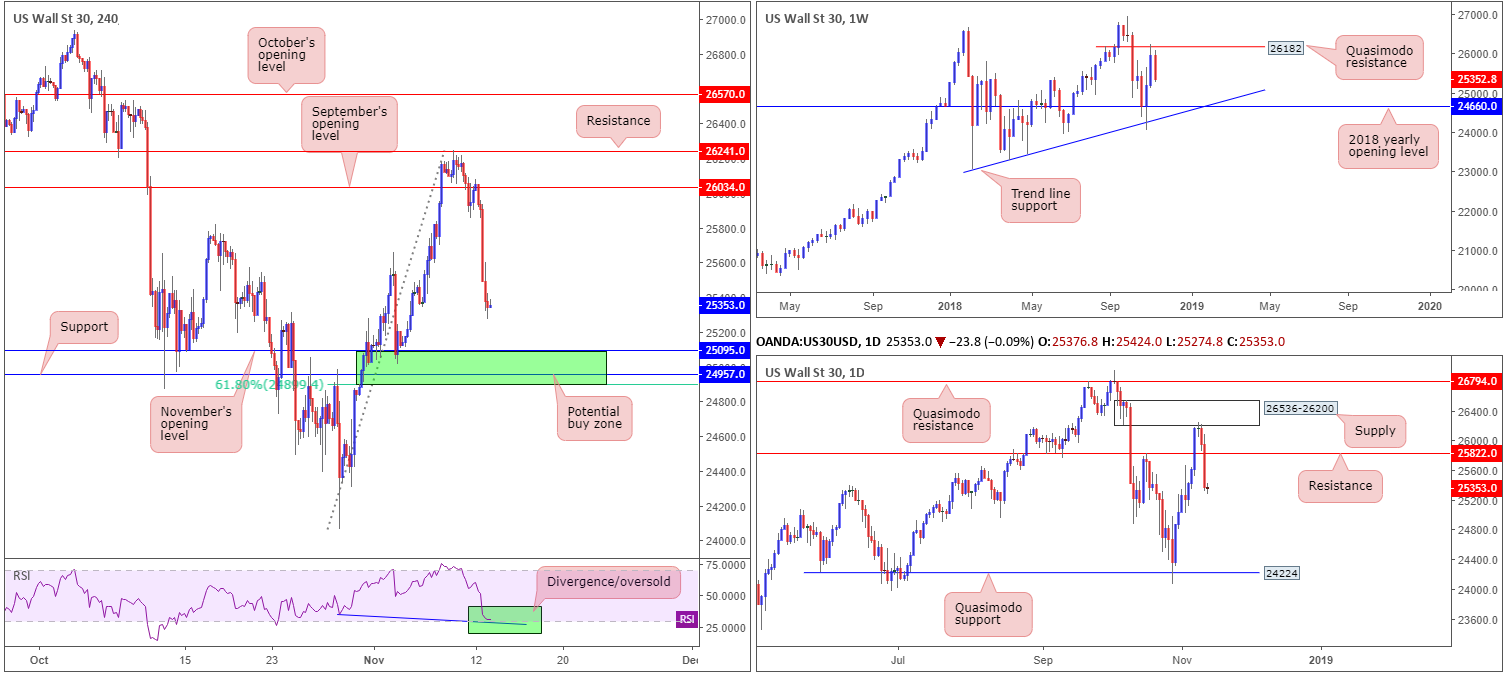
Although US markets were closed, major equity indexes concluded Monday’s session sharply lower, with the DJIA registering a daily loss of over 2.00%.
According to the weekly timeframe, further selling could be upon us. After successfully fading the Quasimodo resistance level at 26182, the chart displays room to press as far south as the 2018 yearly opening level at 24660. This is further supported on the daily timeframe. Following supply at 26536-26200 holding price lower, along with price recently engulfing at 25822 (now acting resistance), scope for a test of 24224 is seen.
Despite both weekly and daily charts emphasizing additional downside, it might be worth noting the H4 support area marked in green at 24899/25095. Comprised of a 61.8% Fib support at 24899, a support level at 24957, November’s opening level at 25095 and the RSI indicator suggesting divergence/oversold parameters, a bounce higher could be seen from here.
Areas of consideration:
In view of the limited higher-timeframe convergence out of 24899/25095, traders may want to consider waiting for additional candlestick confirmation before pulling the trigger. Not only will this help avoid an unnecessary loss, it’ll provide entry/stop parameters.
Today’s data points: FOMC member Brainard speaks.
XAU/USD (Gold):
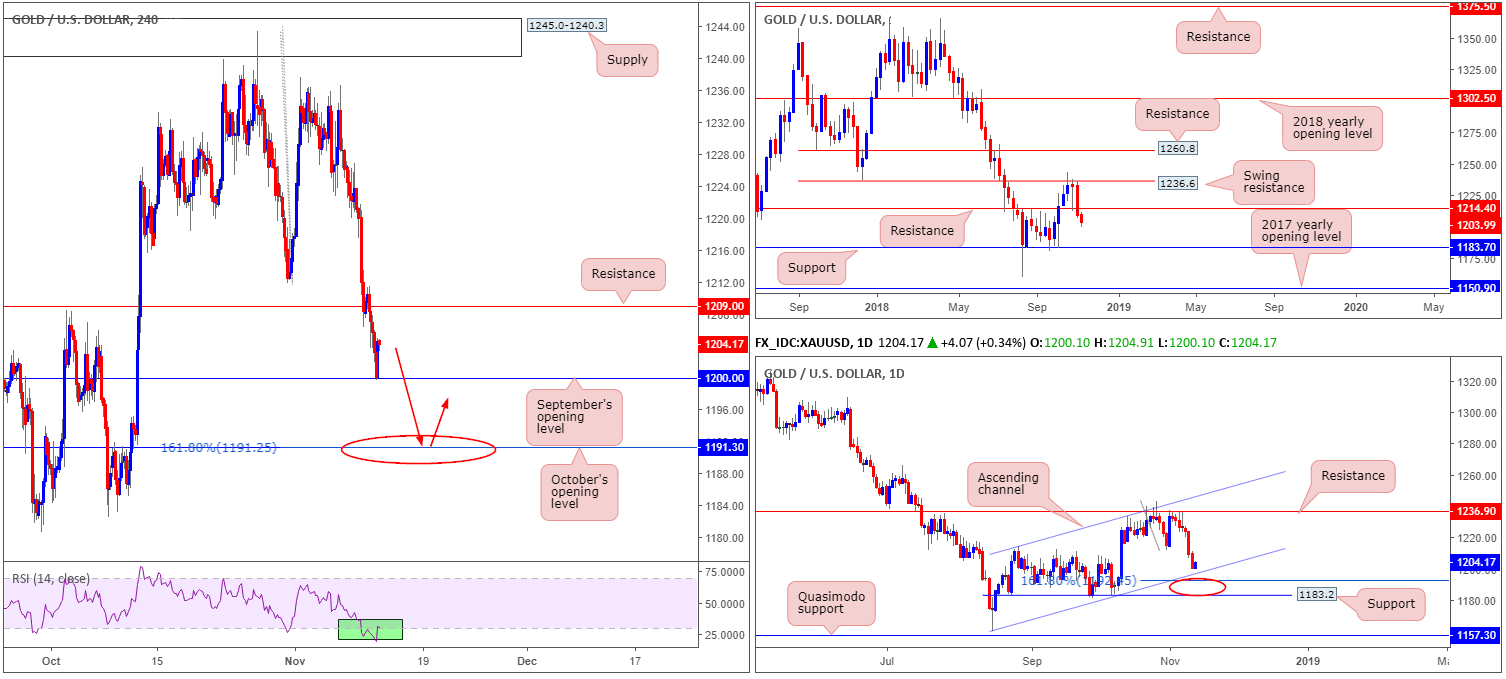
In recent sessions, bullion has been at the mercy of the US dollar. With demand for the greenback soaring Monday, the price of gold declined 0.79%.
As you can see from the H4 chart this morning, the XAU/USD plowed its way through support at 1209.0 (now acting resistance) and found strong buying pressure off September’s opening level at 1200.0. For those who took long positions off of this monthly base, there may be trouble ahead. Weekly price, after cycling through support at 1214.4 (now acting resistance), shows room to press as far south as support coming in at 1183.7. On the daily timeframe, further downside is expected until reaching channel support (extended from the low 1160.3), followed closely by a 161.8% Fib ext. point at 1192.4 and then support carved from 1183.2.
Areas of consideration:
With higher-timeframe movement suggesting further losses may be in the offing, attempting to enter long from September’s opening level at 1200.0 is a chancy move.
October’s opening level at 1191.3, on the other hand, appears the more attractive level for longs. Not only does it converge with a 161.8% Fib ext. point, it is well positioned on the daily timeframe. Due to the threat of weekly price overthrowing this level, however, traders are still urged to consider waiting for additional candlestick confirmation prior to pulling the trigger (entry/stop parameters can be defined by the candlestick structure).
The use of the site is agreement that the site is for informational and educational purposes only and does not constitute advice in any form in the furtherance of any trade or trading decisions.
The accuracy, completeness and timeliness of the information contained on this site cannot be guaranteed. IC Markets does not warranty, guarantee or make any representations, or assume any liability with regard to financial results based on the use of the information in the site.
News, views, opinions, recommendations and other information obtained from sources outside of www.icmarkets.com.au, used in this site are believed to be reliable, but we cannot guarantee their accuracy or completeness. All such information is subject to change at any time without notice. IC Markets assumes no responsibility for the content of any linked site. The fact that such links may exist does not indicate approval or endorsement of any material contained on any linked site.
IC Markets is not liable for any harm caused by the transmission, through accessing the services or information on this site, of a computer virus, or other computer code or programming device that might be used to access, delete, damage, disable, disrupt or otherwise impede in any manner, the operation of the site or of any user’s software, hardware, data or property.