
EUR/USD:
Price action employed a more subdued tone on Monday’s ahead of Fed and ECB policy meetings this week. There were no relevant economic releases out of Europe yesterday, with the main focus drawn to G7 interactions and the upcoming meet between US President Trump and North Korea’s Kim Jong-Un.
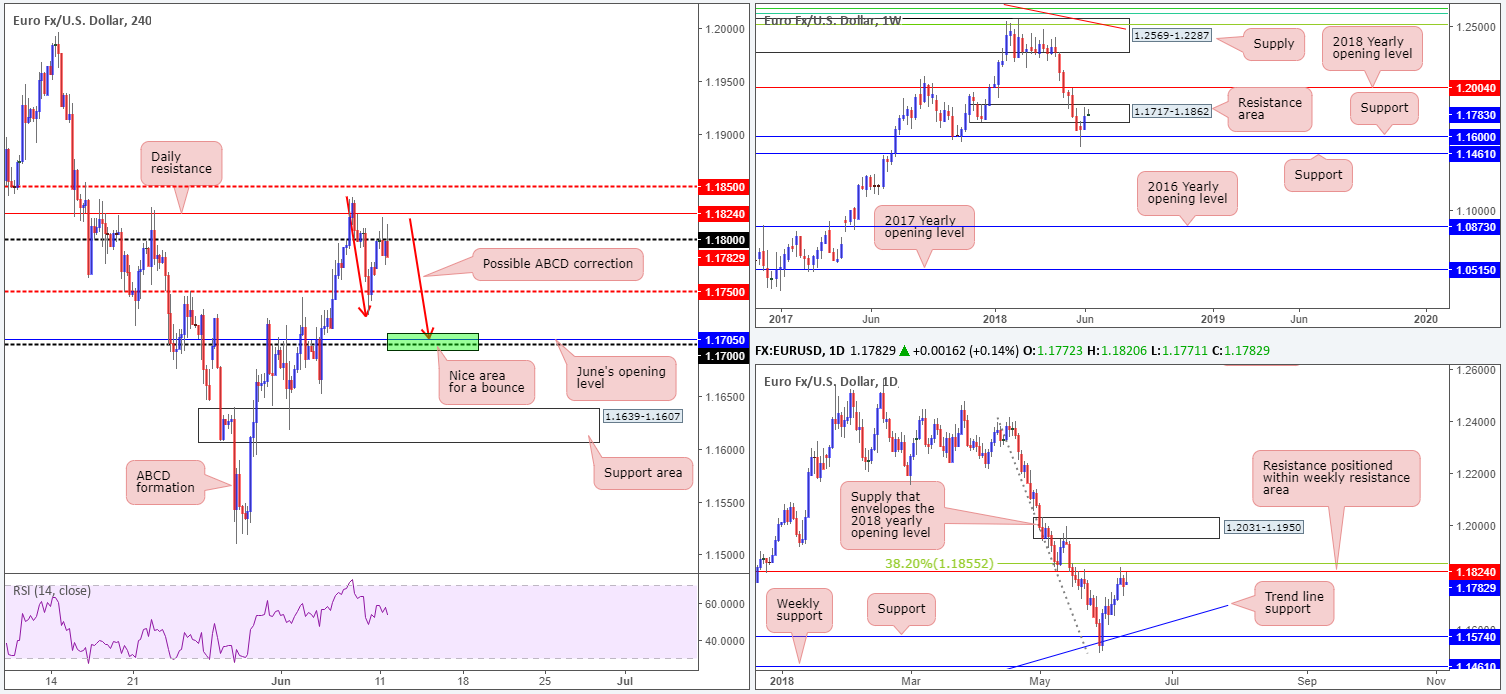
Technically, we can see that the shared currency entered the market strong last week and confronted nearby weekly resistance area seen at 1.1717-1.1862. Continued buying from this point would likely place the 2018 yearly opening level at 1.2004 in the spotlight, whereas a move to the downside has weekly support at 1.1600 to target.
In conjunction with weekly structure, daily resistance at 1.1824 remains in the fray. It’s important to note that this level is seen entrenched within the walls of the current weekly resistance area, and also sited just south of a 38.2% daily Fib resistance value at 1.1855.
Across on the H4 timeframe, the pair continues to drift around the 1.18 neighborhood, positioned just a few pips beneath the aforementioned daily resistance line. Supports in view are the H4 mid-level number at 1.1750, followed closely by the 1.17 handle and June’s opening level at 1.1705.
Areas of consideration:
Given the overhead resistance seen on both weekly and daily structure right now, there’s a good chance we’ll at least witness a test of the 1.17 region on the H4 scale. The team, therefore, has noted to keep eyes on 1.18 for possible shorting opportunities. A decisive retest of this number in the shape of a full or near-full-bodied H4 bear candle has an initial support target located at 1.1750, followed then by the 1.17 neighborhood.
Should the above scenario play out, 1.17 is also likely to be an area of interest for intraday longs given its connection with June’s opening level and the (possible) H4 ABCD approach.
Today’s data points: German ZEW economic sentiment; US inflation figures m/m.
GBP/USD:
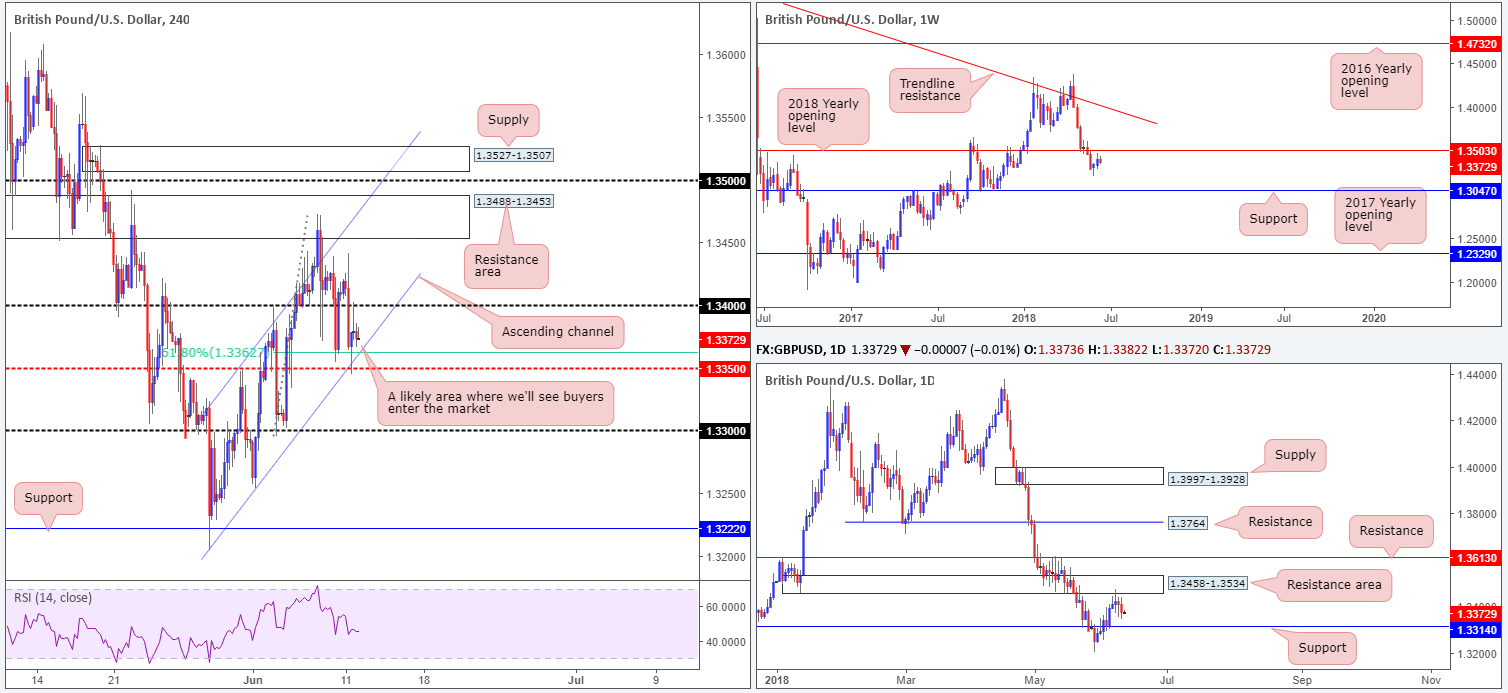
A string of disappointing UK data weighed heavily on the pound in early London hours on Monday, consequently taking out the 1.34 handle seen on the H4 timeframe in strong fashion. This eventually led to a test of the H4 mid-level support at 1.3350 (along with its converging H4 channel support extended from the low 1.3204 and 61.8% H4 Fib support at 1.3362) and retest of 1.34 as resistance.
A look at higher-timeframe structure reveals that weekly price continues to loiter just south of the 2018 yearly opening level at 1.3503. A closer look at price action on the daily timeframe, nevertheless, shows us that the sellers extended losses from the daily resistance area coming in at 1.3458-1.3534 (encapsulates the noted 2018 yearly opening level within), and appears to be now eyeing daily support marked at 1.3314.
Areas of consideration:
In view of the series of higher highs and higher lows on the H4 scale off 1.3204 that’s compressed within a H4 ascending channel at present, further buying to the H4 resistance area at 1.3488-1.3453, and quite possibly the 1.35 handle/nearby H4 supply at 1.3527-1.3507 could be on the cards.
The H4 supply is also of particular interest as a potential sell zone. Positioned strategically above the 1.35 handle, the zone has ‘fakeout 1.35 to me’ written all over it. Also note that the H4 supply is positioned within the walls of the current daily resistance area and the 1.35 handle represents the 2018 yearly opening level mentioned above at 1.3503 (weekly timeframe). An ideal sell signal from here, therefore, would be a H4 bearish pin-bar formation that pierces through 1.35 and connects with the aforementioned H4 supply.
Today’s data points: UK job’s figures; US inflation figures m/m.
AUD/USD:
The Australian dollar registered modest gains on Monday, breaking a two-day bearish phase. As you can see on the H4 scale, the move pulled the unit above 0.76 and retested the number as support. In recent hours, however, the commodity currency came under pressure on the back of USD strength and has, at the time of writing, slipped back beneath 0.76. The next port of call beneath here can be seen at 0.7573: June’s opening level. Continued selling from this point may eventually lead to a test of H4 trend line support taken from the low 0.7412, shadowed closely by the 0.75 handle. Also notable is the potential H4 ABCD correction that completes around the 0.75 neighborhood.
As highlighted in Monday’s weekly report, price action on the weekly timeframe put in a somewhat prominent bearish pin-bar formation off the lower edge of a weekly supply at 0.7812-0.7669 and its intersecting weekly channel support-turned resistance (extended from the low 0.6827) last week. Technically speaking, this will likely attract candlestick enthusiasts into the market this week, looking to target nearby weekly demand priced in at 0.7371-0.7442.
Movement on the daily timeframe, on the other hand, is somewhat restricted between the daily resistance area at 0.7729-0.7626 (seen glued to the underside of the weekly supply) and nearby minor daily support at 0.7585. A break of this level likely places daily demand at 0.7371-0.7429 in the firing range (sited within the lower limit of the said weekly demand).
Areas of consideration:
On account of the above reading, the team believes that the sellers have the upper hand. With that being said, though, entering into short positions at current price is particularly chancy, given nearby H4 support (June’s opening level at 0.7573) and the minor daily support at 0.7585.
A H4 close below 0.7573, followed up with a retest of this number as resistance would, in our technical opinion, be enough to suggest selling this market, targeting noted H4 trend line support and 0.75 handle. Should this move take place, do remember that 0.75 is also likely to be of interest to buyers given the ABCD approach.
Today’s data points: US inflation figures m/m.

USD/JPY:
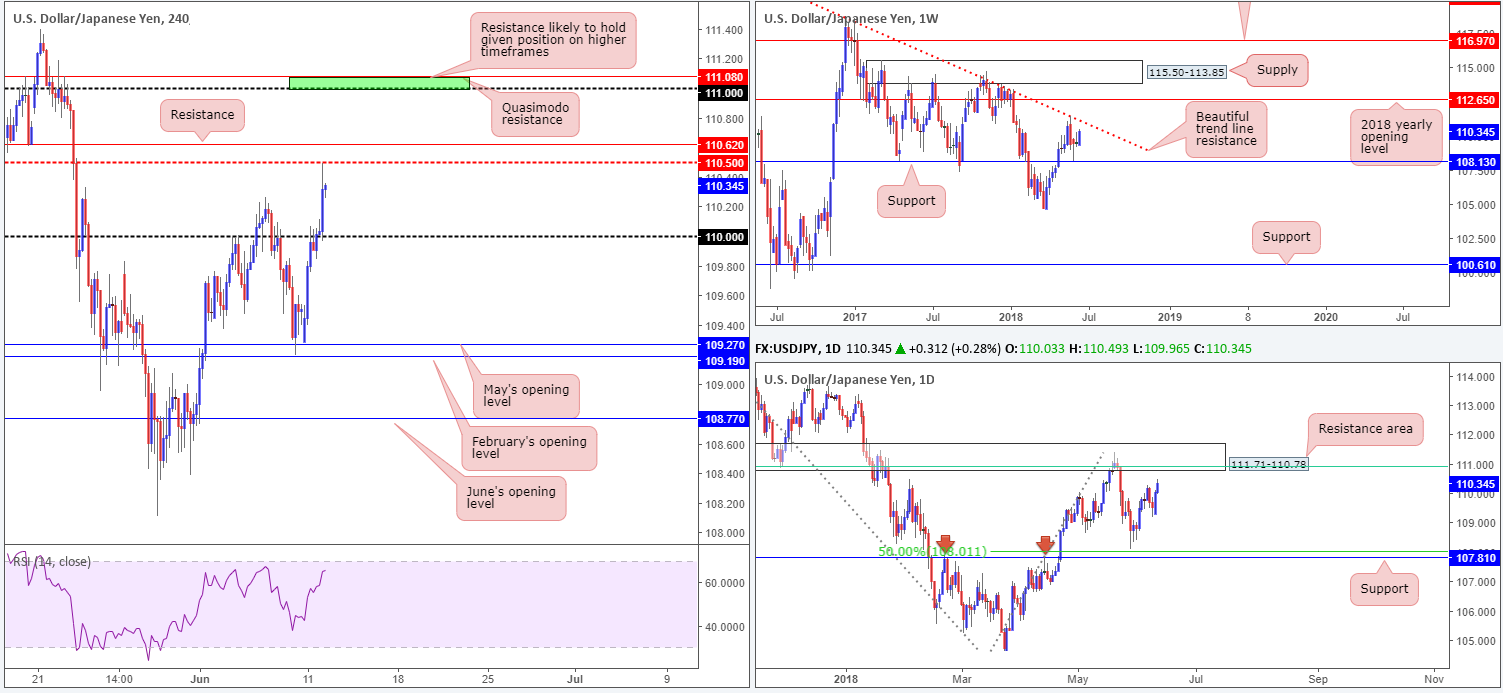
The US dollar put in a strong performance against its Japanese counterpart on Monday, marginally closing the day out above 110. As we head into the Trump/Kim meet, the USD/JPY extended recent gains and touched highs of 110.49.
Buying, however, could come to an end soon, as weekly price nears a weekly trend line resistance taken from the high 123.67. Furthermore, we also see a clean daily resistance area up ahead at 111.71-110.78 that converges not only with the noted weekly trend line, but also a 61.8% daily Fib resistance value at 110.91 (green line).
Areas of consideration:
Longer term, this market is a challenging buy. Therefore, the main focus here is on shorts for the time being. As such, the 111 handle, and nearby H4 Quasimodo resistance at 111.08 are both of interest this morning. Both levels are seen closely interacting with noted weekly trend line resistance, and are also positioned within the walls of the current daily resistance area. Owing to the areas small size (8 pips), we would strongly recommend waiting for H4 price to print a full or near-full-bodied bear candle before pulling the trigger. This will help in regards to stop-loss placement as it can be positioned above the candle’s wick.
Today’s data points: US inflation figures m/m.
USD/CAD:
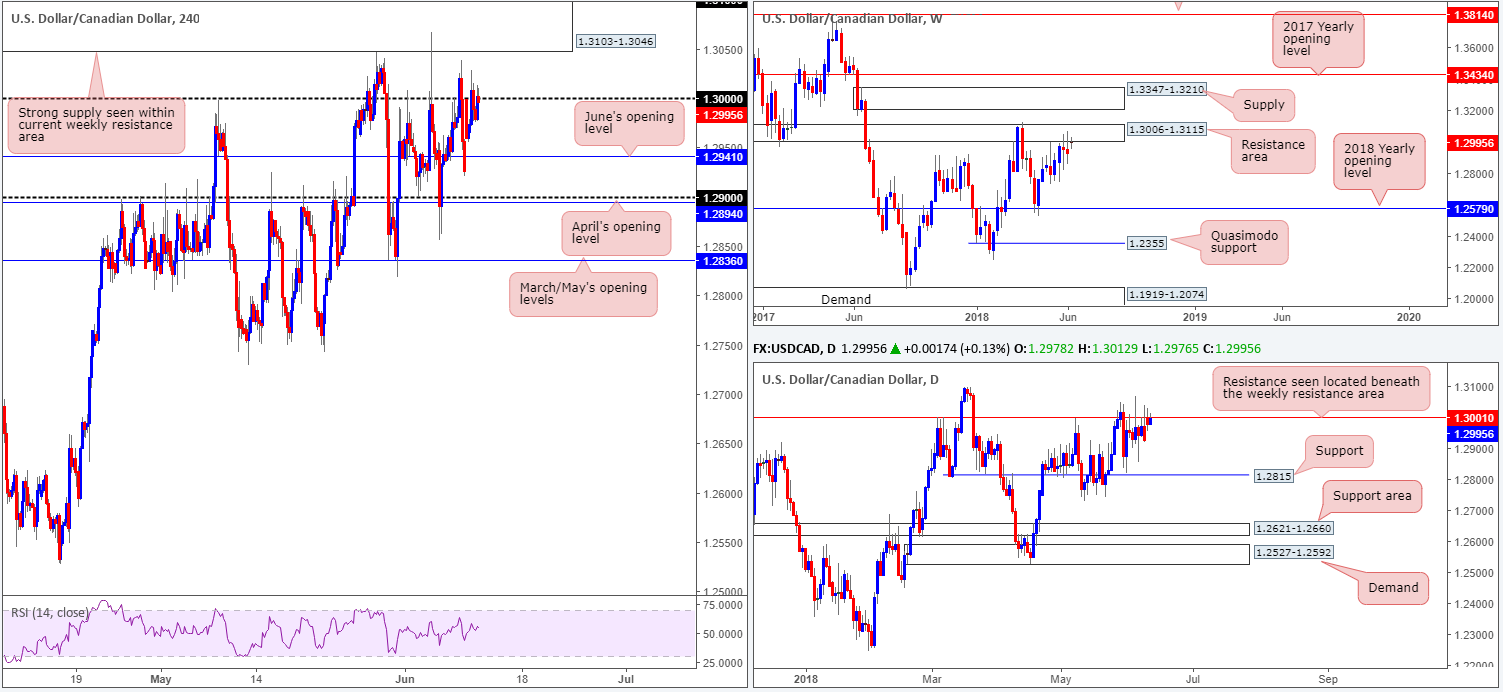
Monday’s session began with a strong gap to the upside, coming within a pip of shaking hands with key figure 1.30. Apart from this, though, H4 price action remained in a subdued state. Areas of interest on the H4 scale right now can be seen at 1.3103-1.3046: a strong supply zone that is seen plotted within the walls of a weekly resistance area at 1.3006-1.3115. Also worthy of note is June’s opening level seen at 1.2941.
The overall picture, however, shows weekly price clinging to the underside of a resistance area mentioned above at 1.3006-1.3115. Should imbalance favour the bulls here this week, and a break of the current weekly resistance zone is seen, this will almost immediately bring weekly supply at 1.3347-1.3210 into the fray. On the other side of the spectrum, a selloff could see price action stretch as far south as the 2018 yearly opening level at 1.2579.
In conjunction with weekly structure, the daily candles are seen interacting with resistance coming in at 1.3001. Providing a strong ceiling of resistance since March of this year, a selloff from this number could eventually be in store. The next downside support target on the radar falls in at 1.2815, followed then by a daily support area at 1.2621-1.2660.
Areas of consideration:
Having noted that both weekly and daily price show potential to selloff, further downside could be on the cards this week. With 1.30 looking somewhat fragile at the moment, all eyes are on nearby H4 supply noted above at 1.3103-1.3046 for possible sells.
Today’s data points: US inflation figures m/m.
USD/CHF:
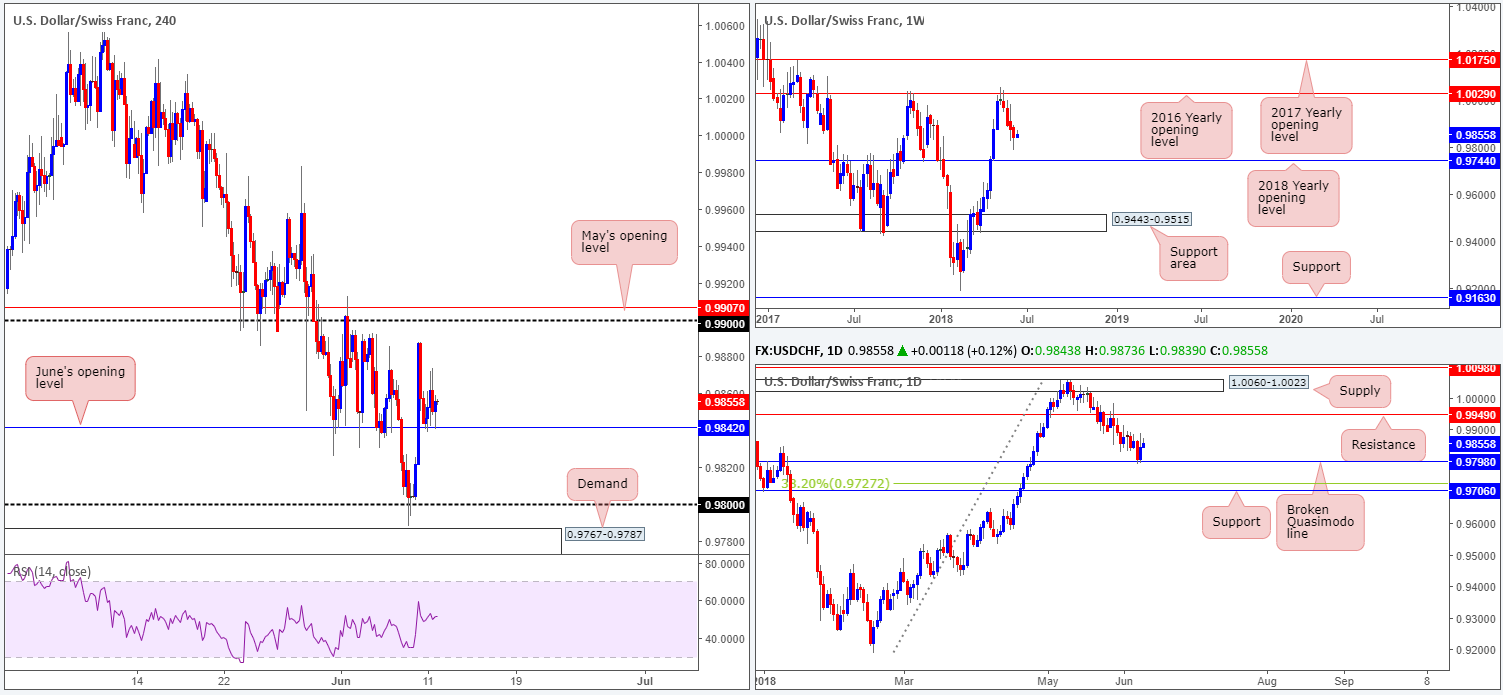
In similar fashion to the EUR/USD, the USD/CHF also took on more of a sober tone amid Monday’s trading. As is shown on the H4 timeframe, the candles have so far respected June’s opening level at 0.9842. Continued buying from this point will likely see the market work towards a test of the 0.99 handle, which happens to be shadowed closely by May’s opening level coming in at 0.9907.To the downside, nevertheless, the 0.98 is the next visible support target, positioned just north of a H4 demand area at 0.9767-0.9787.
While there is clear support forming on the H4 scale, as well as daily price seen responding off daily support plugged in at 0.9798, it’s difficult to overlook the fact that weekly movement displays room to press as far south as the 2018 yearly opening level at 0.9744.
Areas of consideration:
As briefly highlighted above, entering long from 0.9842 places one against weekly directional flow. As such, one can either pass on buying this level – enter at market and hope for the best – or simply wait and see if H4 price can chalk up a full or near-full-bodied bull candle before pulling the trigger. Of course, adopting the latter will not guarantee a winning trade, but what it will do is show buyer intent and provide one a location for stops (beyond the rejection candle’s tail). The initial upside target from this region, as mentioned above, falls in around 0.99.
Today’s data points: US inflation figures m/m.
Dow Jones Industrial Average:
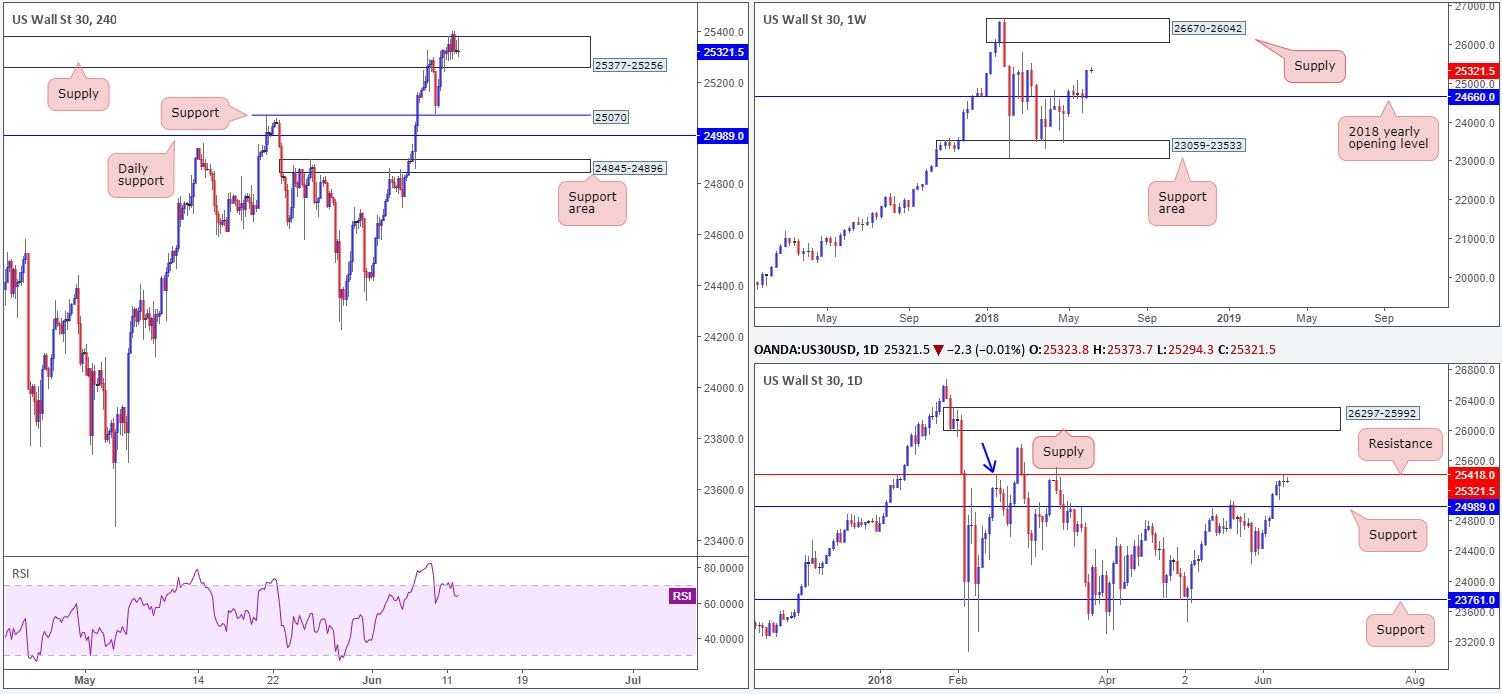
US equities traded within a tight range on Monday around the upper limit of a H4 supply area at 25377-25256, as the index struggled to find direction ahead of the Trump/Kim meet. Stop-loss orders above the current H4 supply have likely been triggered as a result of yesterday’s move, and potentially cleared the pathway north for a test of daily resistance seen nearby at 25418. Do note that this level also represents a Quasimodo resistance taken from the high 25415 (blue arrow). While both H4 and daily structure display possible ceilings, weekly movement shows little resistance ahead until we reach weekly supply drawn from 26670-26042.
As we highlighted in Monday’s briefing, everything about the current H4 supply now echoes weakness.
Areas of consideration:
While we would agree that the buyers are in fine form at the moment, we’re expecting the sellers to make an appearance from the daily resistance level mentioned above at 25418.
For those considering a trade short from the daily level, we strongly recommend waiting and seeing if H4 price can pencil in a full or near-full-bodied bearish candle before pulling the trigger. This is simply because by entering short from here, you may encounter buying pressure from weekly flow!
Today’s data points: US inflation figures m/m.
XAU/USD (Gold)
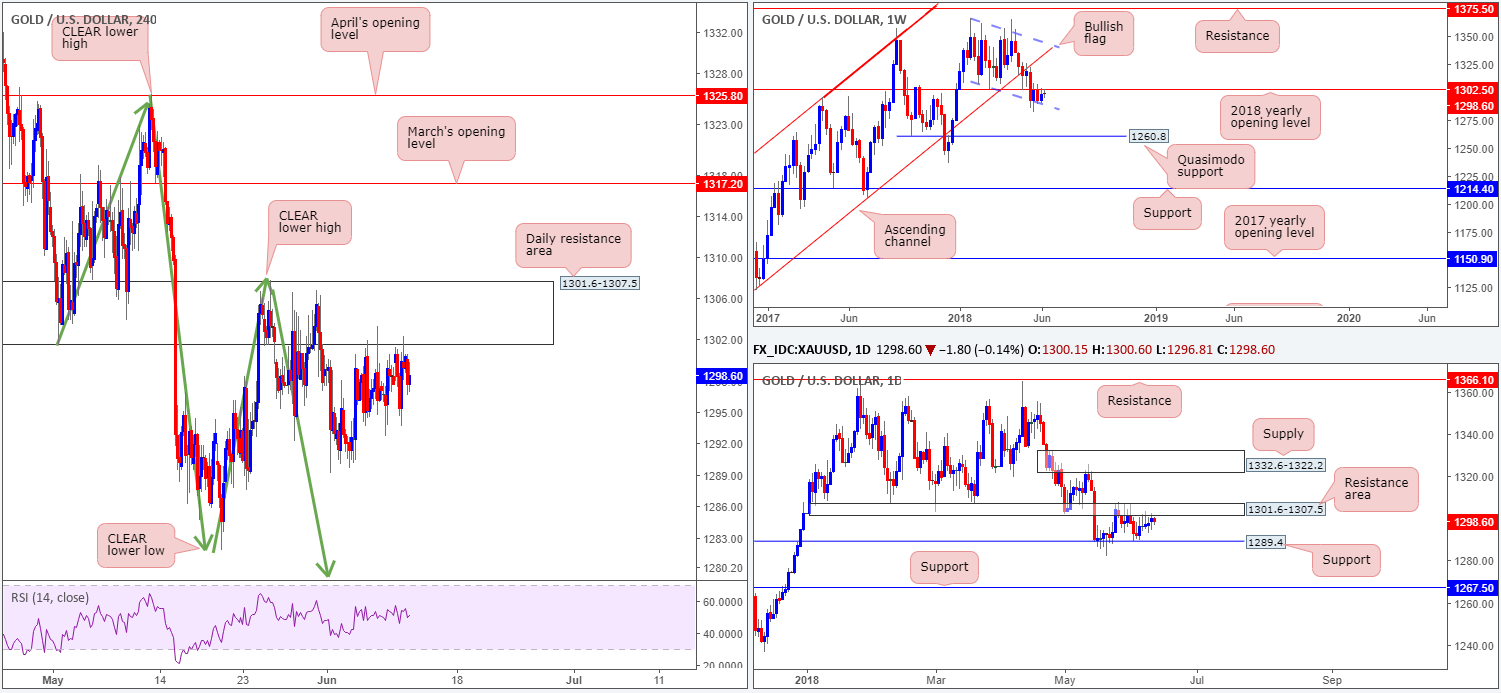
As is clearly demonstrated on the H4 timeframe, the daily resistance area at 1301.6-1307.5 continues to cap upside in this market. From this point, the team remains supportive of a lower low taking place on the H4 scale (a break of the swing low 1285.8). As mentioned in several reports prior, this expectation will only be discounted on a H4 close above the clear lower high seen on the H4 timeframe at 1307.7.
Turning the focus over to the bigger picture, the price of gold has been tightly confined between the 2018 yearly opening level on the weekly timeframe at 1302.5 and the lower edge of a weekly bullish flag formation taken from the low 1346.1. A break lower may set the stage for a test of 1260.8: a weekly Quasimodo support, whereas a move above 1302.5 may see weekly price head for the opposite end of the current weekly flag extended from the high 1366.0.
Moving down to the daily timeframe, we are able to see that price action remains sandwiched between a daily resistance area at 1301.6-1307.5 and a daily support level drawn in from 1289.4. Beyond this area, surrounding structures are seen at daily supply penciled in from 1332.6-1322.2, and daily support at 1267.5 (not seen on the screen).
Areas of consideration:
As the expectation is for a lower low to form on the H4 timeframe, we feel shorts at current price are still worthy of consideration, with stop-loss orders placed above the clear lower high on the H4 timeframe at 1307.7. Reducing risk to breakeven and taking partial profits off the table on a test of lows at 1281.8 is recommended.
The use of the site is agreement that the site is for informational and educational purposes only and does not constitute advice in any form in the furtherance of any trade or trading decisions.
The accuracy, completeness and timeliness of the information contained on this site cannot be guaranteed. IC Markets does not warranty, guarantee or make any representations, or assume any liability with regard to financial results based on the use of the information in the site.
News, views, opinions, recommendations and other information obtained from sources outside of www.icmarkets.com.au, used in this site are believed to be reliable, but we cannot guarantee their accuracy or completeness. All such information is subject to change at any time without notice. IC Markets assumes no responsibility for the content of any linked site. The fact that such links may exist does not indicate approval or endorsement of any material contained on any linked site.
IC Markets is not liable for any harm caused by the transmission, through accessing the services or information on this site, of a computer virus, or other computer code or programming device that might be used to access, delete, damage, disable, disrupt or otherwise impede in any manner, the operation of the site or of any user’s software, hardware, data or property.


