
A note on lower timeframe confirming price action…
Waiting for lower timeframe confirmation is our main tool to confirm strength within higher timeframe zones, and has really been the key to our trading success. It takes a little time to understand the subtle nuances, however, as each trade is never the same, but once you master the rhythm so to speak, you will be saved from countless unnecessary losing trades. The following is a list of what we look for:
- A break/retest of supply or demand dependent on which way you’re trading.
- A trendline break/retest.
- Buying/selling tails/wicks – essentially we look for a cluster of very obvious spikes off of lower timeframe support and resistance levels within the higher timeframe zone.
- Candlestick patterns. We tend to only stick with pin bars and engulfing bars as these have proven to be the most effective.
We search for lower timeframe confirmation between the M15 the H1 timeframes, since most of our higher-timeframe areas begin with the H4. Stops are usually placed 5-10 pips beyond confirming structures.
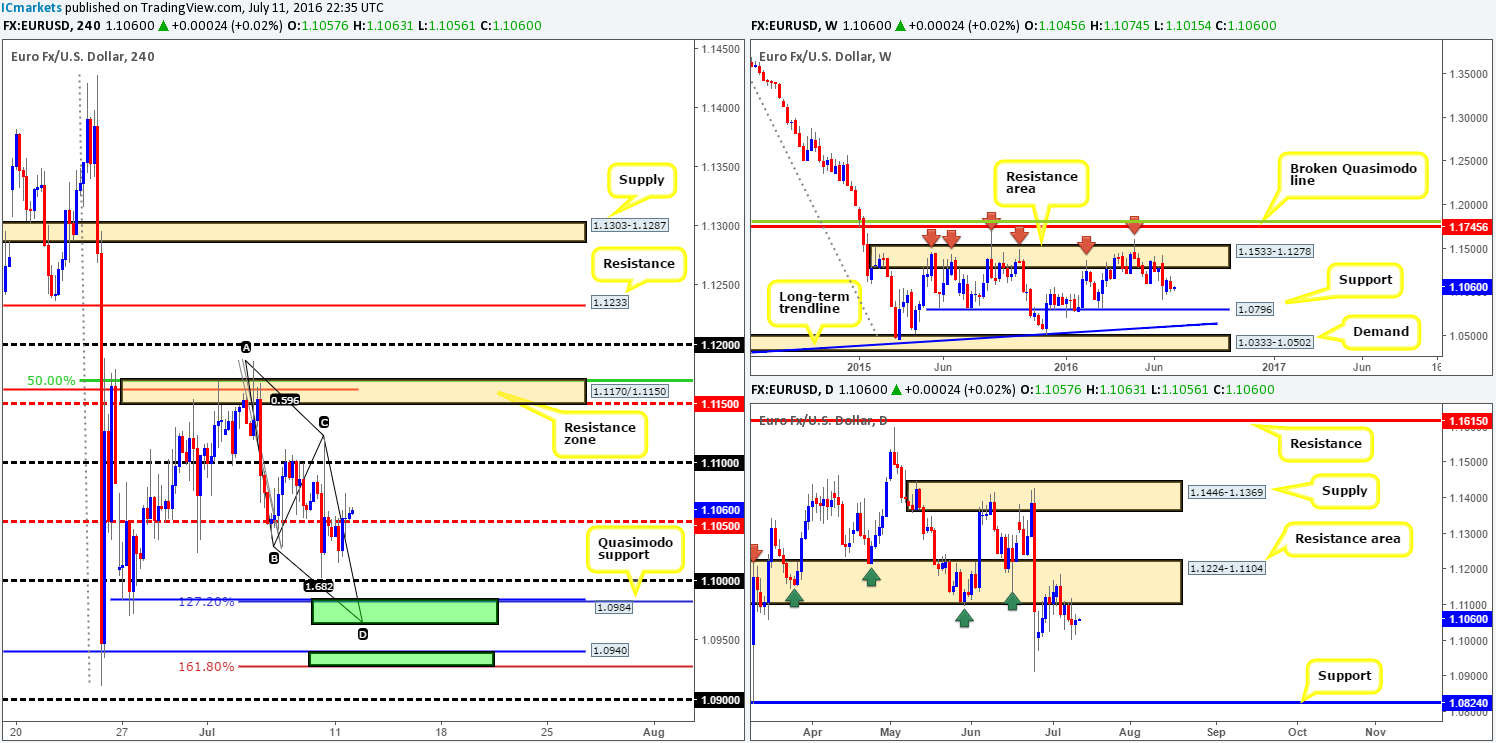
EUR/USD:
During the course of yesterday’s sessions, the single currency found support around the 1.1015 mark going into London trade. This, as you can see, ended with price taking out the H4 mid-way resistance 1.1050, which has only just recently been retested as support. In view of this recent break higher, there is a chance that further buying may be seen today up to the 1.11 handle, essentially drawing attention to the underside of the daily resistance area taken from 1.1224-1.1104.
In that the aforementioned daily resistance area is looming just above current price, and the fact that this zone has provided the pair strong support and resistance on numerous occasions in the past, we’re going to pass on buying this market today.
Our suggestions: Ultimately, what our team is looking for is a break back below the 1.1050 region. The reason for why is that this may open the path south for lower prices down to the 1.11 handle, followed by the minor H4 Quasimodo support line seen at 1.0984 (coincides with a 127.2% extension from the high 1.1186, and sits just above a H4 AB=CD completion point at 1.0964), and even possibly the larger H4 Quasimodo support at 1.0940 (not only did the H4 candles bounce from this line during the ‘Brexit’ fallout [indicating strong support], it also fuses with a 161.8% extension [1.0926] from the high 1.1186).
As we mentioned in Monday’s report, although daily action shows room to continue much lower this week (possibly down to daily support at 1.0824), the above H4 supports in bold are potential places where price will bounce from. Waiting for lower timeframe confirmation at these buy zones is highly recommended (see the top of this report for a list of lower timeframe entry techniques we use), since fakeouts here are still a possibility!
Levels to watch/live orders:
- Buys: 1.0964/1.0984 [Tentative – confirmation required] (Stop loss: dependent on where one confirms this area). 1.0926/1.0940 [Tentative – confirmation required] (Stop loss: dependent on where one confirms this area).
- Sells: Flat (Stop loss: N/A).
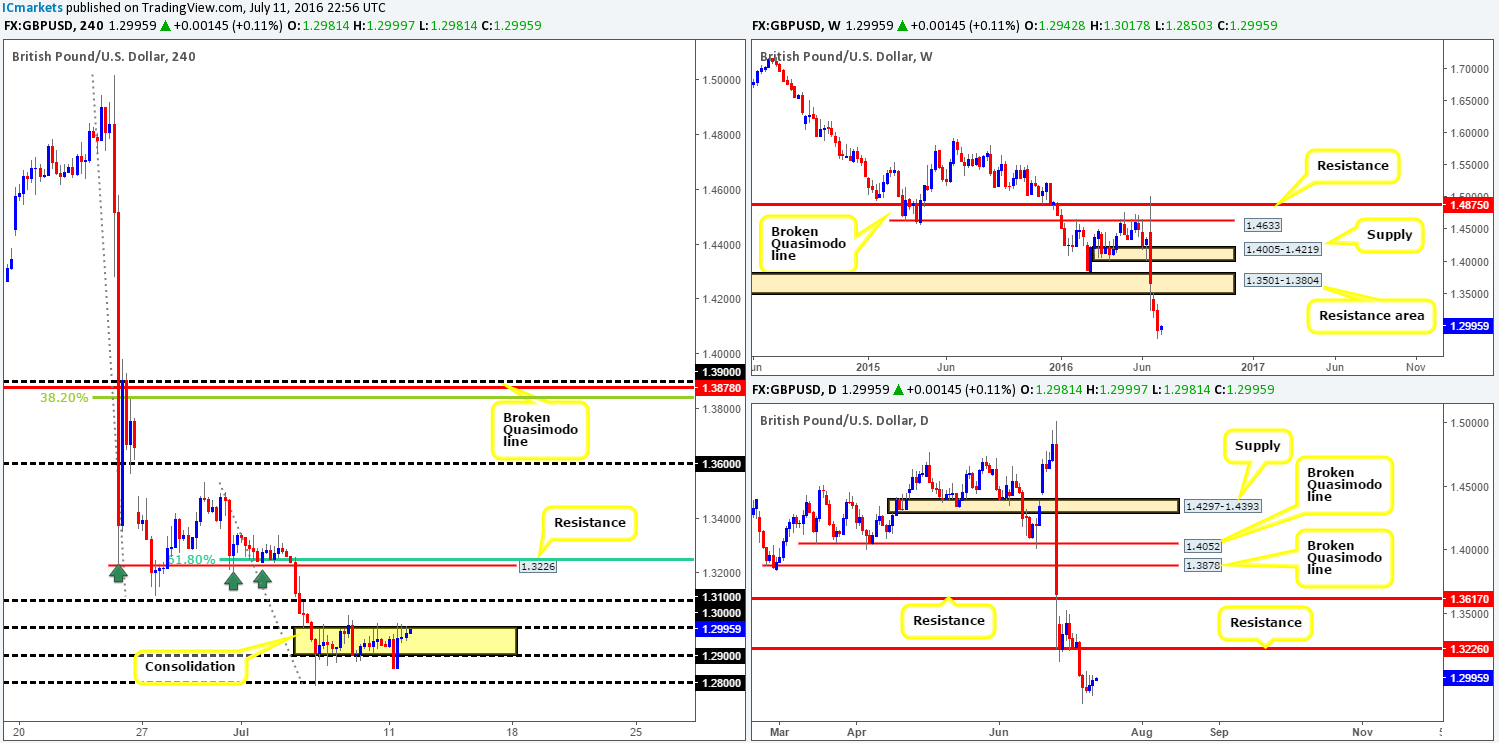
GBP/USD:
UK Prime Minister David Cameron announced yesterday that he’d be officially resigning on Wednesday, paving the way for Theresa May. However, the news of the PM’s resignation was, as you can see from the H4 chart, not enough to break price free from the current H4 consolidation between the key figure 1.30 and the 1.29 handle. Granted, price did whipsaw through 1.29 as London opened for business, but unfortunately was unable to sustain downside momentum beyond this line.
With the above points in mind, let’s take a quick look at the higher timeframe charts… While the weekly timeframe continues to reflect a bearish stance below the weekly resistance area given at 1.3501-1.3804, there is little ‘local’ structure seen to the left of current price. We’ve had to look back to as far as 1986 where the top-side of a demand is seen around the 1.20 mark. However, there’s a lot of ground to cover before this barrier is brought into view. For now, at least from a technical standpoint, this pair has the potential to continue much lower!
There’s not much difference seen between the weekly and daily charts, other than there’s a daily resistance drawn in at 1.3226, which price could effectively retest sometime this week.
Our suggestions: This is certainly a tricky pair to trade right now! On the one hand should price break free from above 1.30, a rally could ensue as far as the H4 resistance at 1.3226 (bolstered by a H4 61.8% Fib line at 1.3245 and also the fact that it is a visible resistance on the daily scale). On the other hand, a break below 1.29 could spark a sell-off down to 1.28 and beyond, as let’s not forget there is little structure seen to the left of current prices until around the 1.20 mark!
Given the points made above our team has decided to take a back seat here today, and wait for price to make its next move, hopefully beyond the current H4 range.
Levels to watch/live orders:
- Buys: Flat (Stop loss: N/A).
- Sells: Flat (Stop loss: N/A).
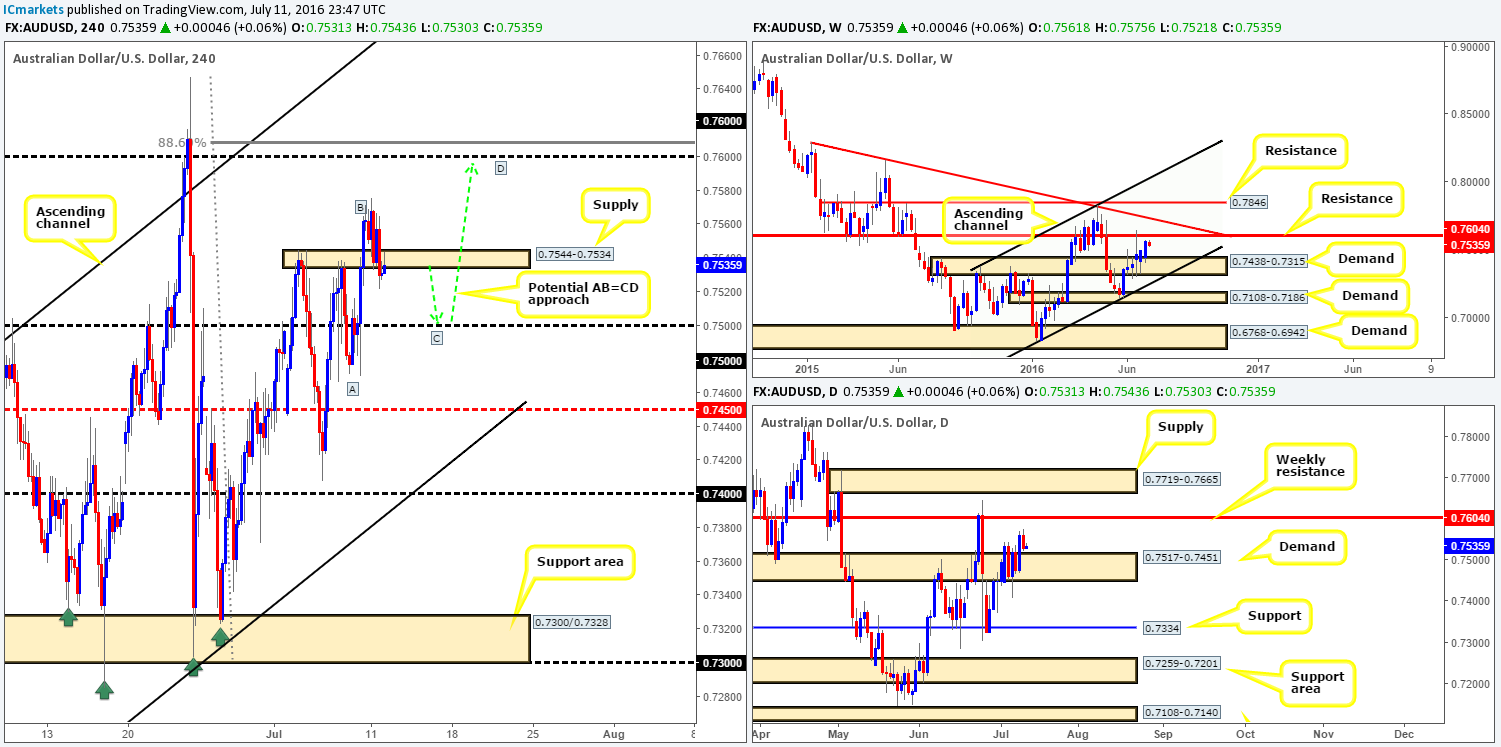
AUD/USD:
Starting from the top this morning, we can see that the commodity currency remains trading within touching distance of a weekly resistance line drawn from 0.7604. We believe a reaction from this vicinity is likely this week, so do keep a tab on this level. In conjunction with weekly price, the daily candles also show that the next objective to reach is the aforementioned weekly resistance line. Before this is achieved, however, there’s a chance that the Aussie may retest the daily demand base seen at 0.7517-0.7451.
Stepping across to the H4 window, the view from here shows that price topped out around the 0.7567 mark yesterday and eventually slipped below H4 demand at 0.7544-0.7534. As we write this H4 zone is currently being retested as supply, potentially signaling a continuation move down to the 0.75 handle.
Our suggestions: In the event that the above analysis is correct, an aggressive buy trade from 0.75 could be a possibility. Here’s why:
- A successful retest of 0.75 (housed within the above said daily demand area) will form the C-leg to a potential H4 AB=CD approach up to 0.76 (coincides with a deep H4 88.6% Fib level at 0.7608) – essentially the weekly resistance line at 0.7604. Now, given that the path north is clear on the higher timeframes from the 0.75 region, one may look to take an aggressive buy from here, ultimately targeting 0.76. For those interested in taking a long from here, we would strongly advise waiting for the lower timeframes to show some form of buying strength before committing capital: a collection of well-defined buying tails, for example.
And for the more conservative trader (which is what we try to be):
- You may prefer to wait and see if price does indeed rally up to 0.76 to take a short position. Given the confluence seen around the 0.76 handle, our team has left the pending sell order at 0.7599 in place, with a stop above the high 0.7647 at 0.7649. Regarding our first take-profit target, this is a little difficult to judge since the approach has yet to be completed. Usually though we look to aim for the next logical area of demand on the H4 timeframe.
Levels to watch/live orders:
- Buys: 0.75 region [Tentative – confirmation required] (Stop loss: dependent on where one confirms this area).
- Sells: 0.7599 [Pending order] (Stop loss: 0.7649).
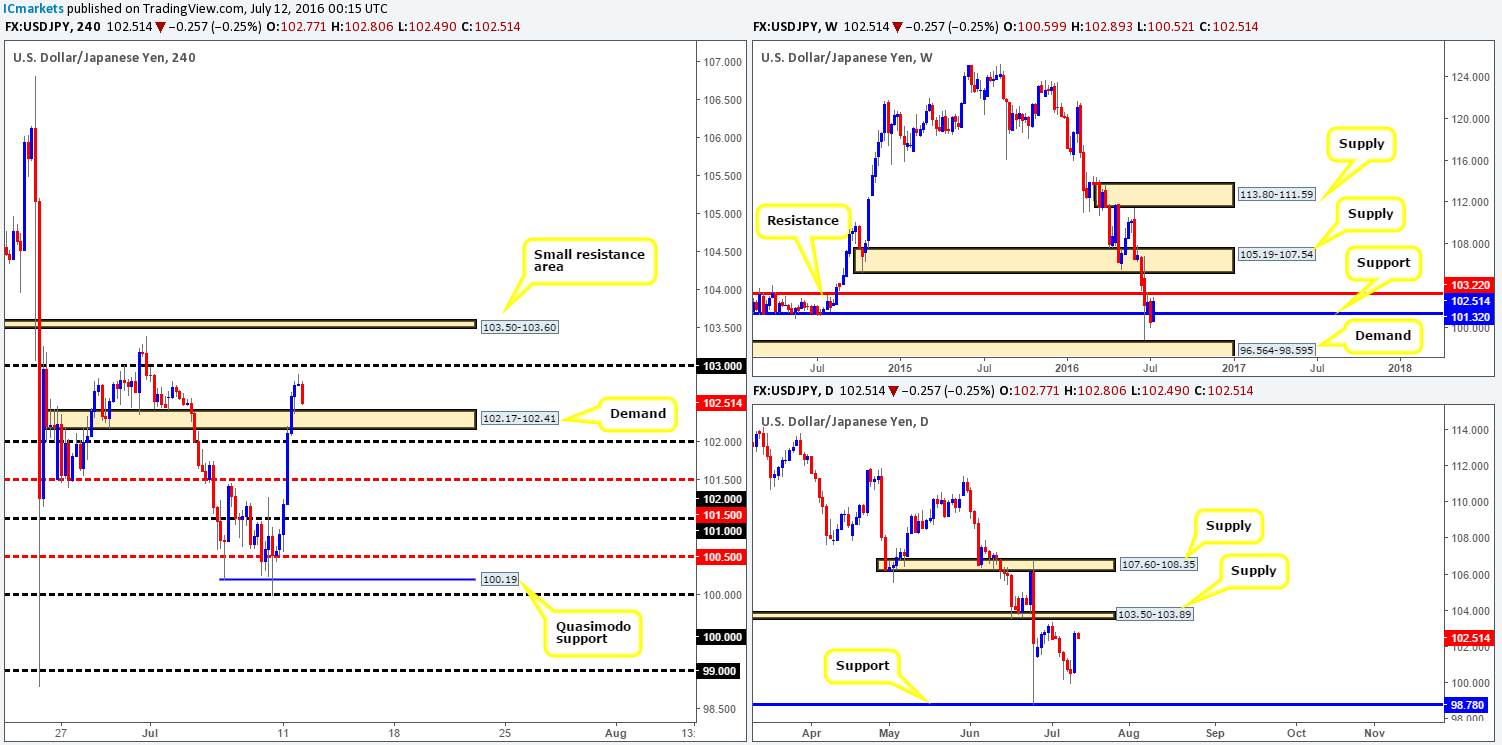
USD/JPY:
The USD/JPY settled around highs of 102.89 yesterday, following a heavy round of buying. The risk-on advance seen in equity markets saw investors dump the safe-have yen, consequently boosting price over 200 pips by the day’s close!
At the time of writing, H4 action looks as though it’s about to retest a recently broken H4 supply-turned demand at 102.17-102.41. With room seen on the weekly chart to move north up to weekly resistance at 103.22, and also on the daily chart up to daily supply at 103.50-103.89, a bounce from the current H4 demand is certainly possible today.
Our suggestions: We would not advise simply entering at market from the current H4 demand base. The reason for why is that price may fake through this zone and look to tag in bids around the 102 handle. Therefore, waiting for the lower timeframes to confirm this area (see the top of this report for lower timeframe entry techniques) can certainly help in avoiding the dreaded fakeout! As for targets, we’ll look at liquidating partial profits around the 103 handle and reducing risk to breakeven. Following this, the small H4 resistance area at 103.50-103.60 is likely to be the final take-profit zone, since it links up nicely with the daily supply mentioned above at 103.50-103.89.
Levels to watch/live orders:
- Buys: 102.17-102.41 [Tentative – confirmation required] (Stop loss: dependent on where one confirms this area).
- Sells: Flat (Stop loss: N/A).
USD/CAD:
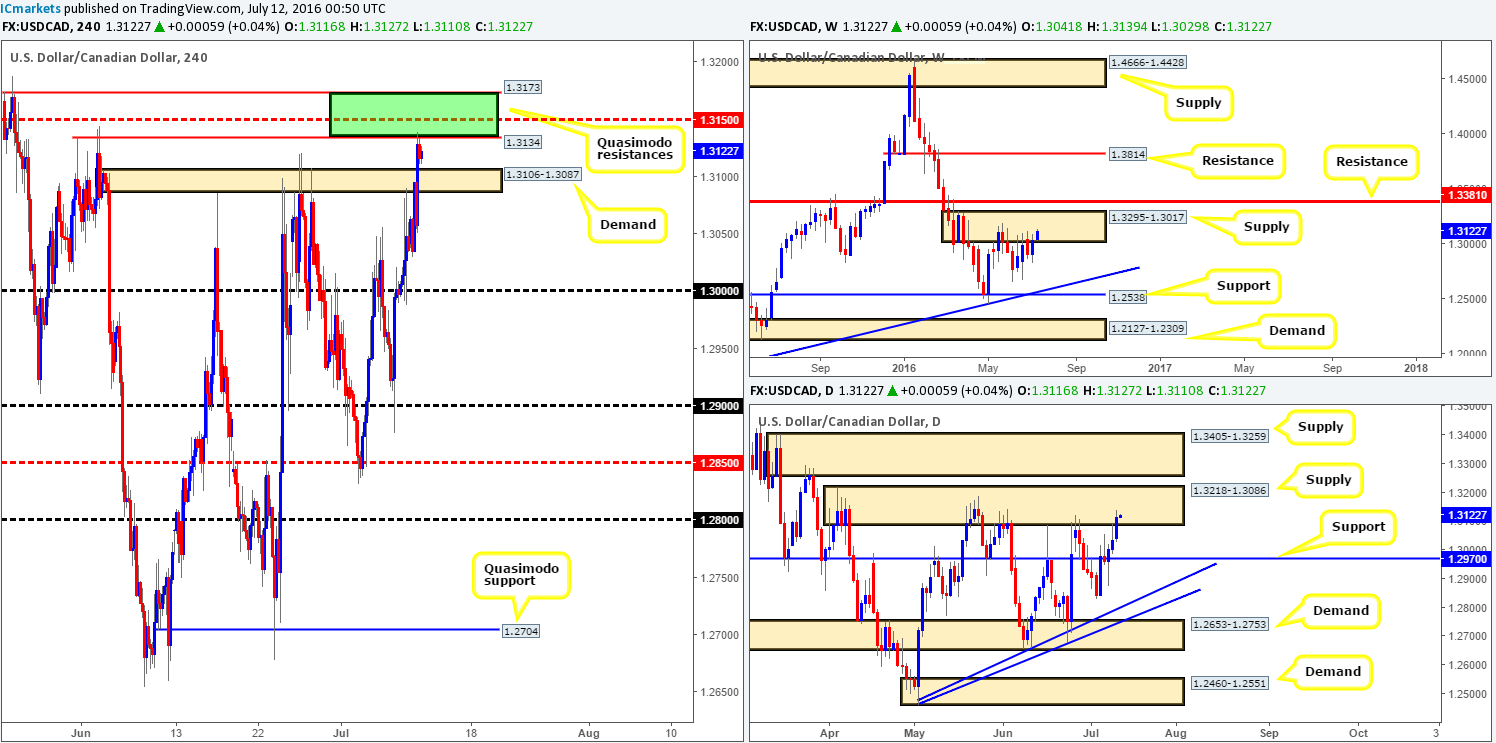
In our previous report (see link below) we mentioned that we expected the H4 supply zone at 1.3106-1.3087 to eventually break and for price to rally higher to connect with clean offers seen between 1.3173/1.3134 (green zone). This zone is comprised of two H4 Quasimodo resistances, which also houses a H4 mid-way resistance line drawn from 1.3150.
As you can see, price did exactly as expected. Unfortunately, we missed this move as we were not at our desks at the time! For those who are currently short this market, further downside is on the cards we believe. Not only is weekly price loitering within weekly supply at 1.3295-1.3017, daily action is now also seen trading within daily supply coming in at 1.3218-1.3086.
For us, the first take-profit target (if we managed to take this short) would be the recently broken H4 supply-turned demand at 1.3106-1.3087, followed by the key figure 1.30 as this number sits only thirty pips above daily support drawn from 1.2970.
Our suggestions: Seeing as how we missed the opportunity to sell from 1.3173/1.3134, our team is going to place this pair on the back burner today and reassess going into tomorrow’s sessions.
http://www.icmarkets.com/blog/monday-11th-july-weekly-technical-outlook-and-review/
Levels to watch/live orders:
- Buys: Flat (Stop loss: N/A).
- Sells: Flat (Stop loss: N/A).
USD/CHF:
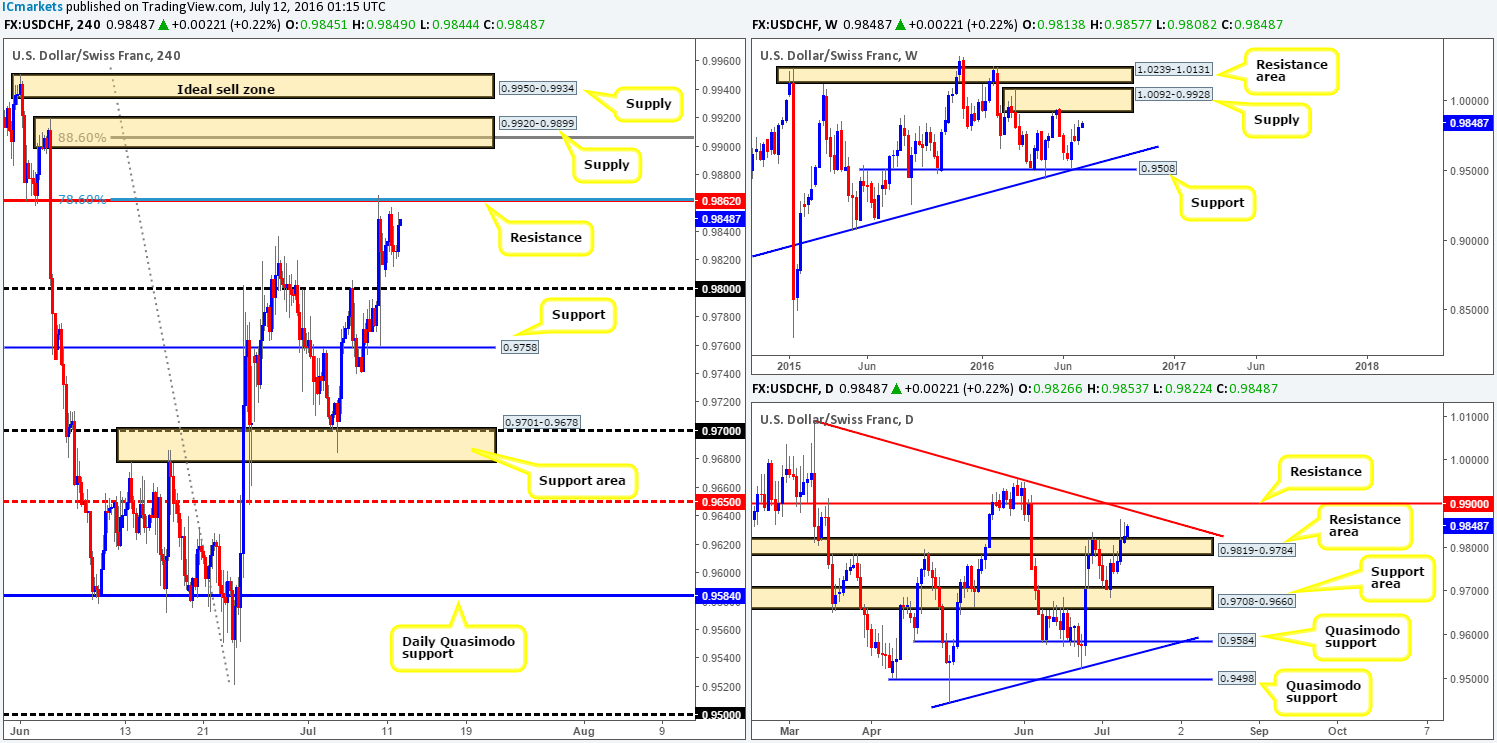
From the weekly chart, last week’s renewed buying pressure formed a beautiful-looking weekly bullish engulfing candle. This – coupled with room to move north towards weekly supply at 1.0092-0.9928 may spark buying interest in this market this week. In-line with weekly expectations, daily price is seen trading above the daily resistance area at 0.9819-0.9784, which may lead to further buying up to the daily resistance level at 0.9900, bolstered by a daily trendline resistance taken from the high 1.0092.
Over on the H4 chart, candle action spent yesterday consolidating just below a H4 resistance line at 0.9862 (coincides with a H4 78.6% Fib resistance). After re-evaluating the structure on this pair, we feel shorting from this H4 resistance is not the best path for us to take since both higher timeframe charts show the intention to push higher (see above).
The two H4 supply areas marked at 0.9950-0.9934/ 0.9920-0.9899 remain a focal point for us. The upper zone is located within the aforementioned weekly supply area, whilst the lower area sits just beneath it. Nevertheless, the lower zone boasts a deep H4 88.6% Fib resistance level at 0.9906 and also a psychological number at 0.99.
Our suggestions: The lower H4 supply area at 0.9920-0.9899 is attractive due to its converging structures, but we feel the best area to look for shorts is the H4 supply seen just above at 0.9950-0.9934 (given its position on the weekly timeframe). One can only imagine how many traders are looking to short the lower H4 supply given its confluence. As such, there are likely to be a truckload of stops above this barrier, and where those stops are placed is where we’ll be looking to short at market with our stop just above the extreme H4 supply at 0.9954.
Levels to watch/live orders:
- Buys: Flat (Stop loss: N/A).
- Sells: 0.9950-0.9934 [Dependent on the time of day, a market order from this zone is possible] (Stop loss: 0.9957).
DOW 30:
Improved risk sentiment saw US stocks rally over 100 points during trading yesterday, reaching highs of 18285 on the day. In that two H4 resistance lines at 18211 and 18153 were taken out during this recent surge in buying, the road north looks relatively free up to a minor H4 Quasimodo resistance line at 18340.
However, the benefit of looking at multi timeframes allows one to be more flexible. Despite the H4 chart suggesting buying; over on the daily chart the DOW recently tagged a daily Quasimodo resistance level registered at 18279. On top of this, the weekly scale shows that the buyers and sellers remain battling for position within a weekly resistance area drawn from 18365-18158, which has held prices lower since February 2015! While further upside is still a possibility in this market today, the technical story so far shows a reversal may be on the horizon.
Our suggestions: To become sellers in this market, the two H4 supports at 18121/1853 would need to be taken out and retested as resistance (alongside a lower timeframe sell signal – see the top of this report for lower timeframe entry techniques). Not only would this signal weakness within the current daily support area at 18186-18117, but it would also likely force this market back down to the broken daily Quasimodo line at 18018 – an ideal first take-profit target.

Levels to watch/live orders:
- Buys: Flat (Stop loss: N/A).
- Sells: Watch for price to consume the two H4 supports at 18121/1853 and look to trade any retest seen thereafter (lower timeframe confirmation required).
Gold:
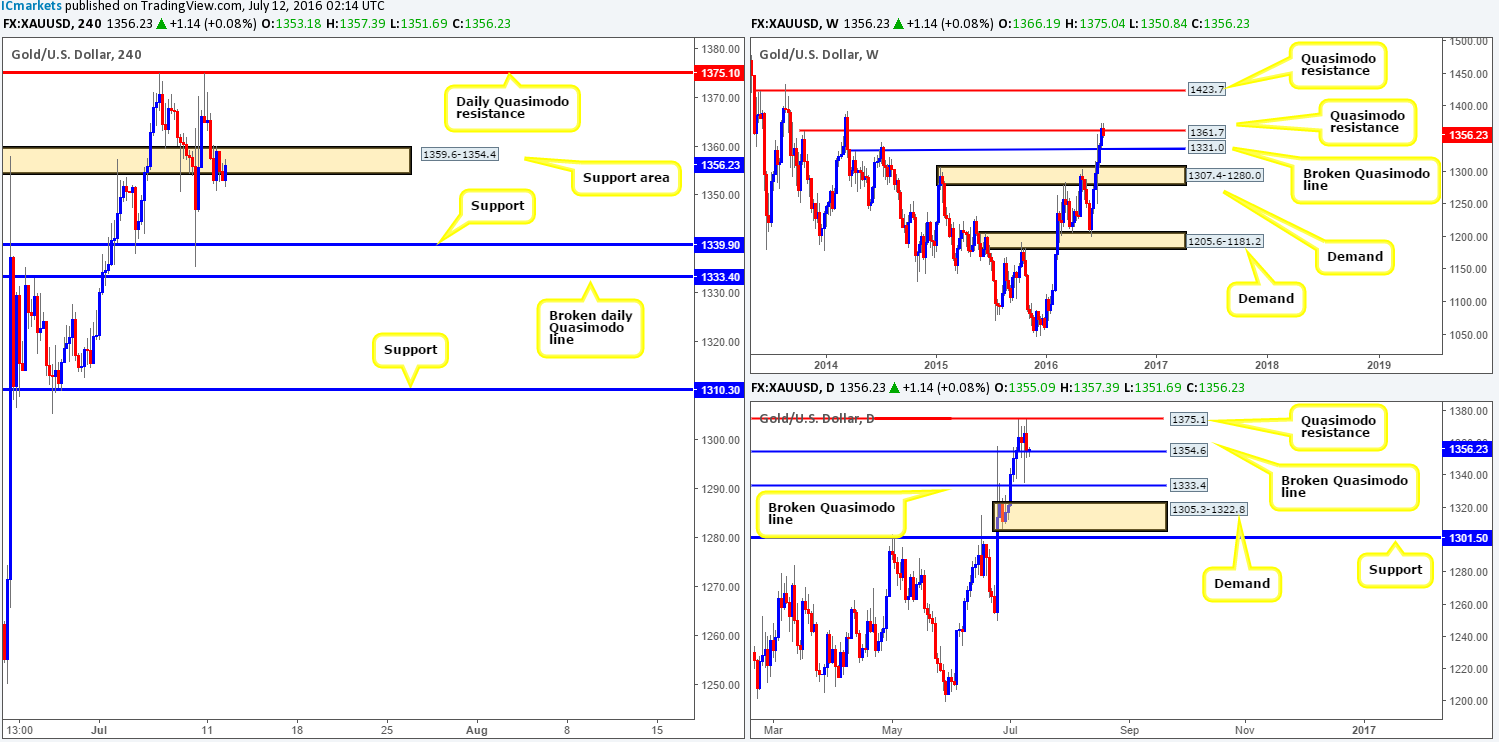
Following the open, we can see that the yellow metal attacked the daily Quasimodo resistance line at 1375.1 for the second time in the space of a week. Once again, the level saw a to-the-pip reaction and pushed gold lower. As of now, price is trading around the lower edge of a H4 support area at 1359.6-1354.4, which happens to be bolstered by a broken daily Quasimodo line at 1354.6. Nevertheless, buying from this region is a risky bet in our book, since weekly candles show the metal to be trading back below a weekly Quasimodo resistance line coming in at 1361.7.
Our suggestions: As far as we can see the safest trade to take would be to look for short entries within the current H4 support area. The reason being is not only is a move lower bolstered by weekly action (see above), but this H4 support area looks as if it is hanging on by a thread at the moment. Therefore, if one manages to pin down a lower timeframe short entry within this box (see the top of this report for a list of lower timeframe entry techniques we use), partial profits could be taken at H4 support at 1339.9, followed closely by the broken daily Quasimodo line at 1333.4.
Levels to watch/live orders:
- Buys: Flat (Stop loss: N/A).
- Sells: 1359.6-1354.4 [Tentative – confirmation required] (Stop loss: dependent on where one confirms this area).


