
A note on lower timeframe confirming price action…
Waiting for lower timeframe confirmation is our main tool to confirm strength within higher timeframe zones, and has really been the key to our trading success. It takes a little time to understand the subtle nuances, however, as each trade is never the same, but once you master the rhythm so to speak, you will be saved from countless unnecessary losing trades. The following is a list of what we look for:
- A break/retest of supply or demand dependent on which way you’re trading.
- A trendline break/retest.
- Buying/selling tails – essentially we look for a cluster of very obvious spikes off of lower timeframe support and resistance levels within the higher timeframe zone.
- Candlestick patterns. We tend to only stick with pin bars and engulfing bars as these have proven to be the most effective.
For us, lower timeframe confirmation starts on the M15 and finishes up on the H1, since most of our higher timeframe areas begin with the H4. Stops usually placed 5-10 pips beyond your confirming structures.
EUR/USD:
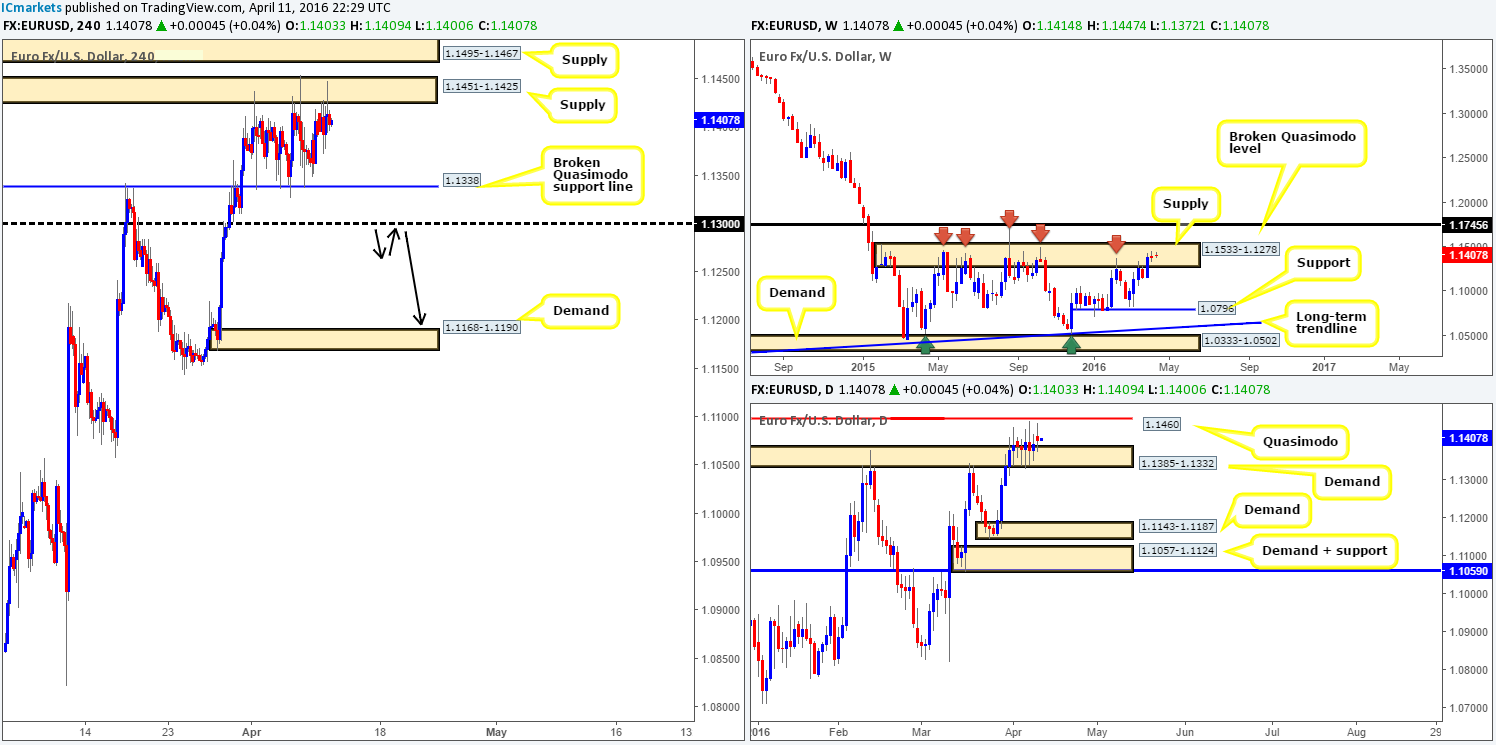
Reporting from the weekly timeframe this morning, trading action remains confined within supply drawn from 1.1533-1.1278. Despite the lack of selling interest seen within this supply zone, this area has managed to hold price lower since May 2015 on five occasions, so the bulls still likely have their work cut out for them if they want to push higher.
Turning our attention to the daily timeframe, the EUR stamped in yet another indecision candle yesterday between demand seen at 1.1385-1.1332 and a Quasimodo resistance level coming in overhead at 1.1460. A break below this demand could prompt a move towards demand penciled in at 1.1143-1.1187, whilst a push above the Quasimodo likely suggests further weakness within the current weekly supply.
Climbing down one more level to the H4 timeframe, we can see supply at 1.1451-1.1425 (sits within the aforementioned weekly supply and just below the daily Quasimodo resistance) and the broken Quasimodo support line at 1.1338 (positioned within the extremes of the above said daily demand) has contained this pair since the beginning of April.
Given the above information here is what we have jotted down for today’s sessions:
- In view of price trading at the upper edge of the H4 consolidation right now, shorting this market down to the lower edge of the range would be the more favorable method in our opinion. Nevertheless, we would recommend only doing so with lower timeframe confirmation since fakeouts are common within ranging environments such as this.
- An alternative method of trading this market would be to wait to see if the H4 candles can close below the current H4 range demand, and the 1.1300 line. This would place one in a favorable position to look for shorts on any retest seen to the underside of 1.1300, targeting H4 demand at 1.1168-1.1190 (see black arrows), which sits on top of daily demand mentioned above at 1.1143-1.1187.
Alongside this, let’s also keep in mind that by shorting the underside of 1.1300, we’d be trading in-line with weekly flow (see above). Furthermore, a close below 1.1300 would very likely force daily action to close beneath the current daily demand, thus, as we’ve already mentioned above, opening the path south towards daily demand at 1.1143-1.1187.
Levels to watch/live orders:
- Buys: Flat (Stop loss: N/A).
- Sells: 1.1451-1.1425 [Tentative – confirmation required] (Stop loss: dependent on where one confirms this area). Watch for price to consume 1.1300 and look to trade any retest seen thereafter (lower timeframe confirmation required).
GBP/USD:
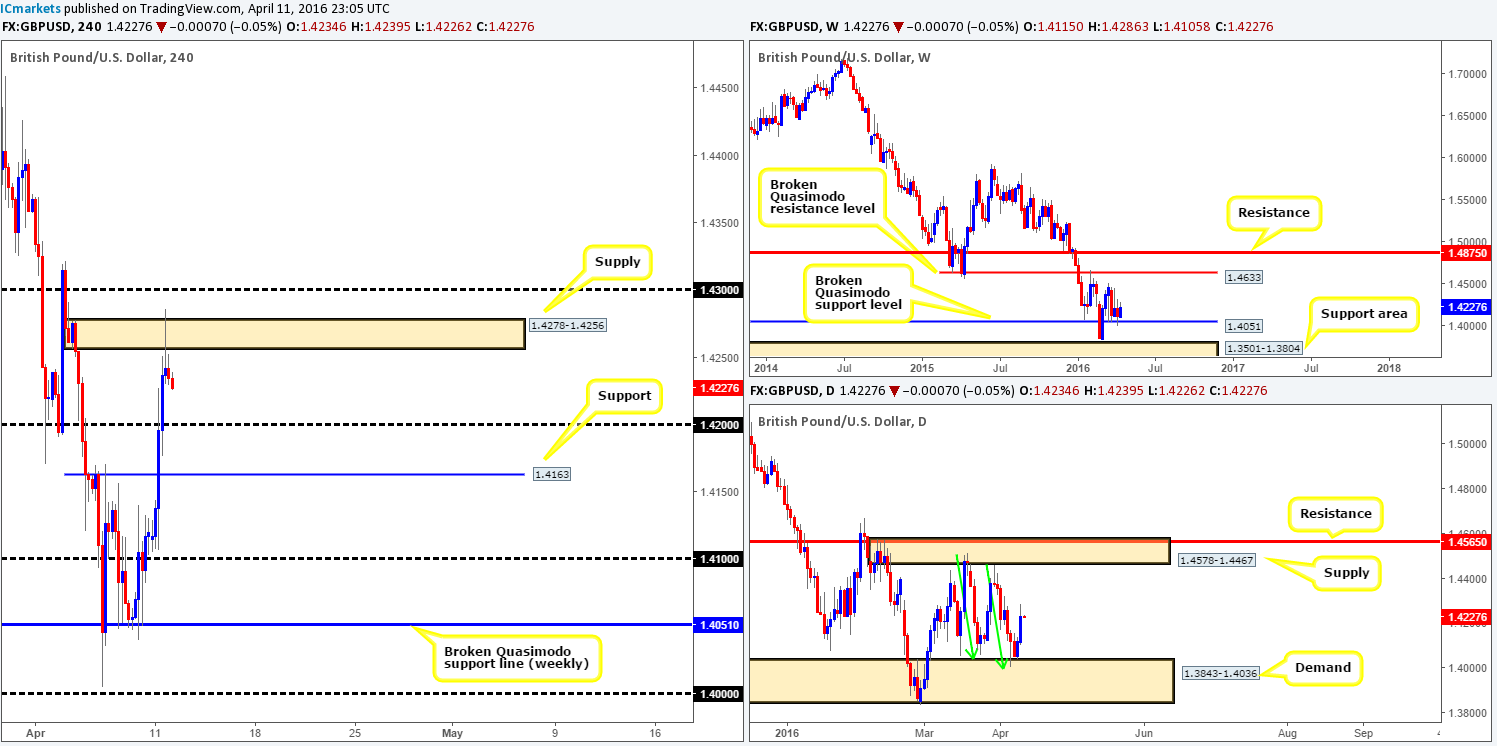
The GBP was a relatively big mover yesterday with price posting a healthy gain of around 120 pips into the close 1.4234. For those who read our previous report on Cable (see link below) you may recall us mentioning to look for buys on any retest seen at the 1.4100 handle. Unfortunately, as you can see, the market missed our buy line by five pips before rocketing north!
In that price is now selling-off following a whipsaw through H4 supply at 1.4278-1.4256, we feel that candle action will continue drifting south until it hits a pocket of bids around the 1.4200 handle. Now, seeing as how the weekly chart shows buying from a broken Quasimodo support line at 1.4051, and the daily has responded nicely from demand at 1.3843-1.4036, we still favor the buy-side of this market for the time being.
For this reason, our plan of attack will consist of looking for lower timeframe entries around the 1.4200 line today, targeting 1.4300. To our way of seeing things the overhead H4 supply has likely been weakened, thus clearing the path up to 1.4300, and with the closest higher-timeframe supply (daily) not seen until 1.4578-1.4467, we feel this is a worthwhile trade. We would, however, advise waiting for the lower timeframes to confirm 1.4200 since round numbers have a tendency to whipsaw price (for confirmation techniques, see the top of this report).
Levels to watch/live orders:
- Buys: 1.4200 [Tentative – confirmation required] (Stop loss: dependent on where one confirms this level).
- Sells: Flat (Stop loss: N/A).
AUD/USD:
(Slightly revised from our previous outlook)
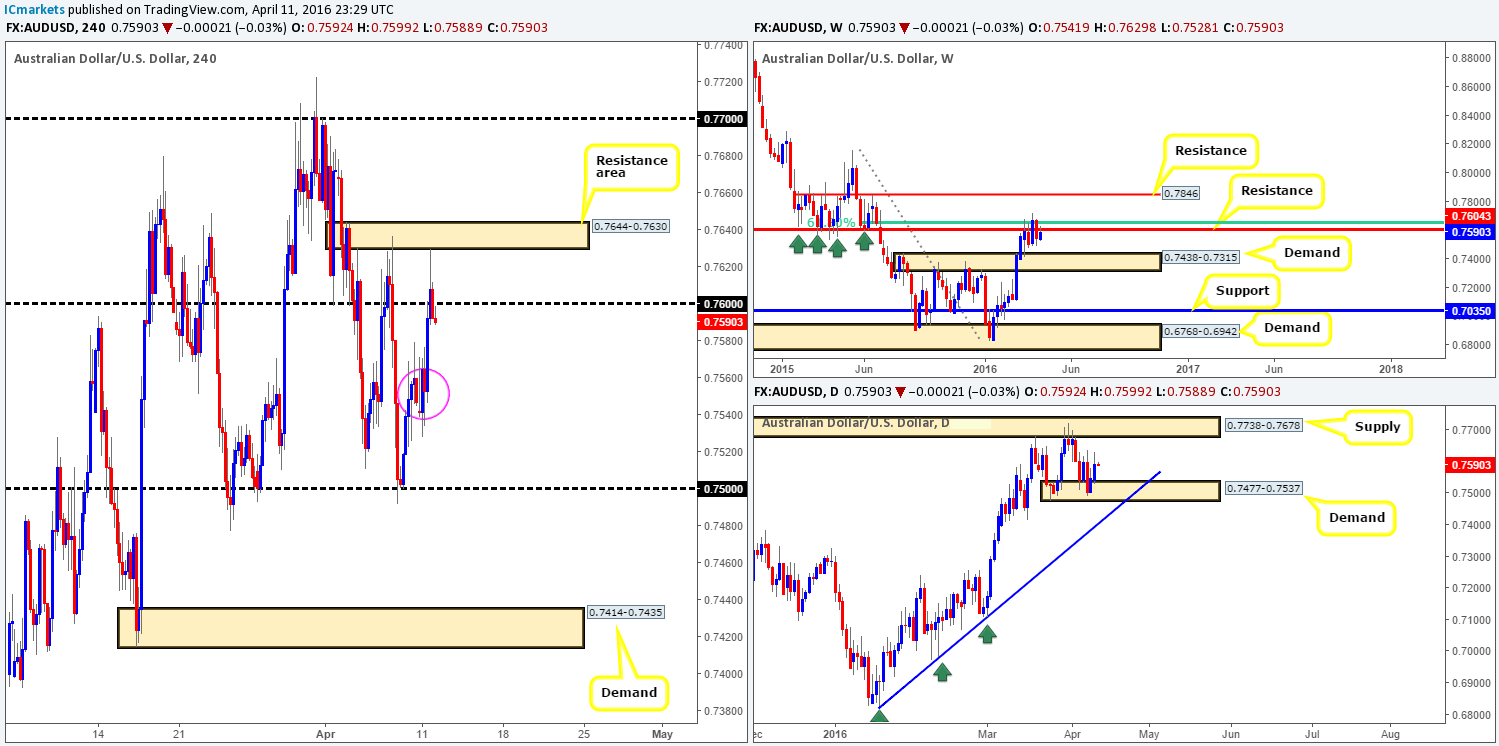
This morning’s analysis will kick-off with a look at the weekly chart, which shows that price is once again nibbling at the underside of resistance coming in at 0.7604. The reason, at least technically, as to why the weekly bears are having a hard time here likely stems from demand seen on the daily chart drawn from 0.7477-0.7537, which for now continues to hold firm.
Dropping down into the pits of the H4 chart on the other hand, one can see that the resistance area penciled in at 0.7644-0.7630 once again held price lower going into the later hours of the American session yesterday. This, as can be seen from the chart, forced the Aussie to close below the 0.7600 handle. Now, our initial thoughts from here were to short the underside of 0.7600. However, due to a relatively tough barrier of bids lurking just below (pink circle) between 0.7528/0.7579, and in the background lurks the aforementioned daily demand which is holding strong, we’ve decided to remain on the sidelines for now and wait for further developments.
Levels to watch/live orders:
- Buys: Flat (Stop loss: N/A).
- Sells: Flat (Stop loss: N/A).
USD/JPY:
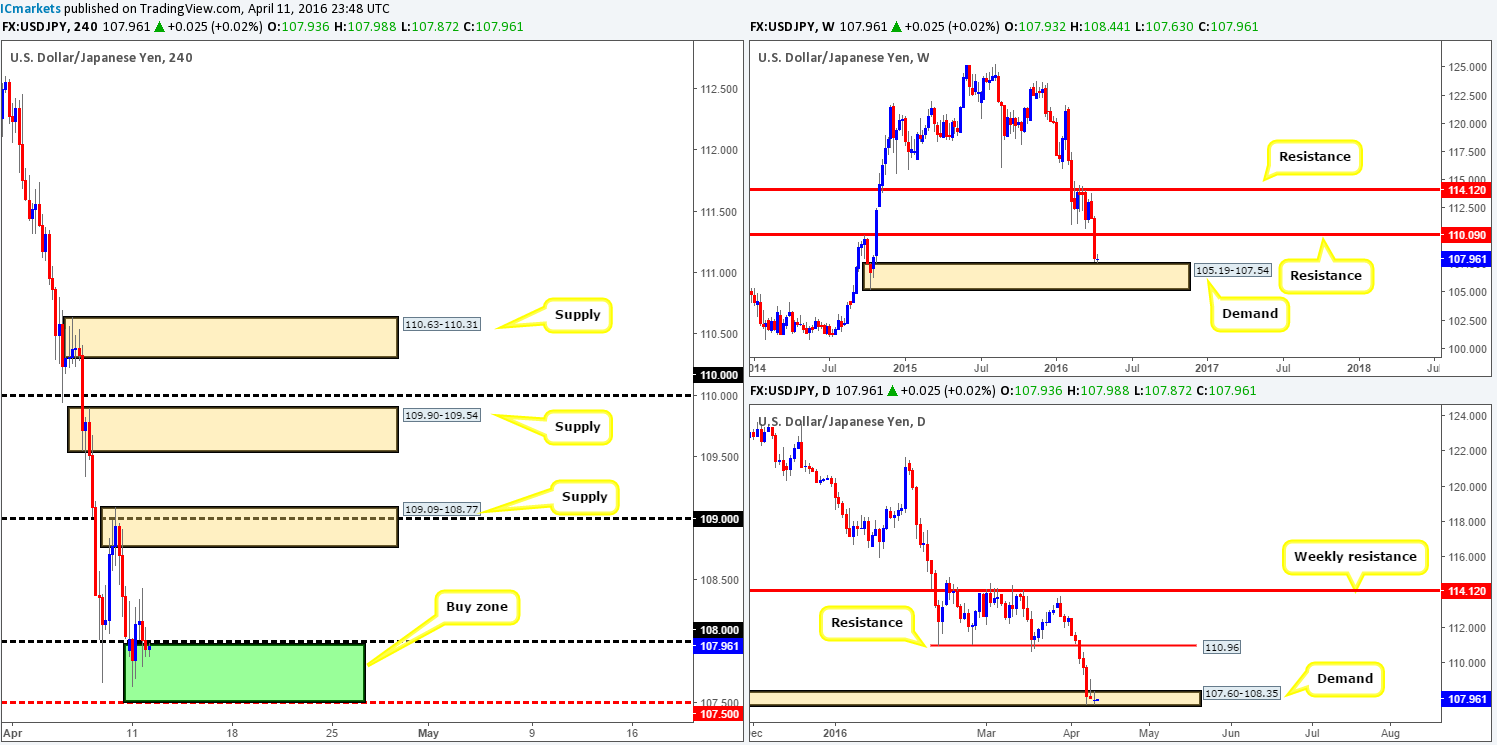
During the course of yesterday’s sessions, the USD/JPY saw a modest rebound from the 107.50/108.00 (green rectangle) area going into the London open. From here the bulls managed to reach highs of 108.44 before retreating back into the 107.50/108.00 region. The reason for our continued interest in this green buy zone, as we explained in Friday’s report (see link below), is simply because in between this barrier sits the lower half of a daily demand area and also the top-side of a weekly demand base (107.60/107.54).
We have yet to find anything on the lower timeframes that suggests to buy from here, so this will be our assignment today. The reason for requiring a lower timeframe buy setup to form (see the top of this article for confirmation techniques) prior to risking capital here is simply due to the pair being in a downtrend right now. Should we manage to pin down a buy trade, nonetheless, we’ll look to take partial profits around H4 supply at 109.09-108.77.
Levels to watch/live orders:
- Buys: 107.50/108.00 [Tentative – confirmation required] (Stop loss: dependent on where one confirms this area).
- Sells: Flat (Stop loss: N/A).
USD/CAD:
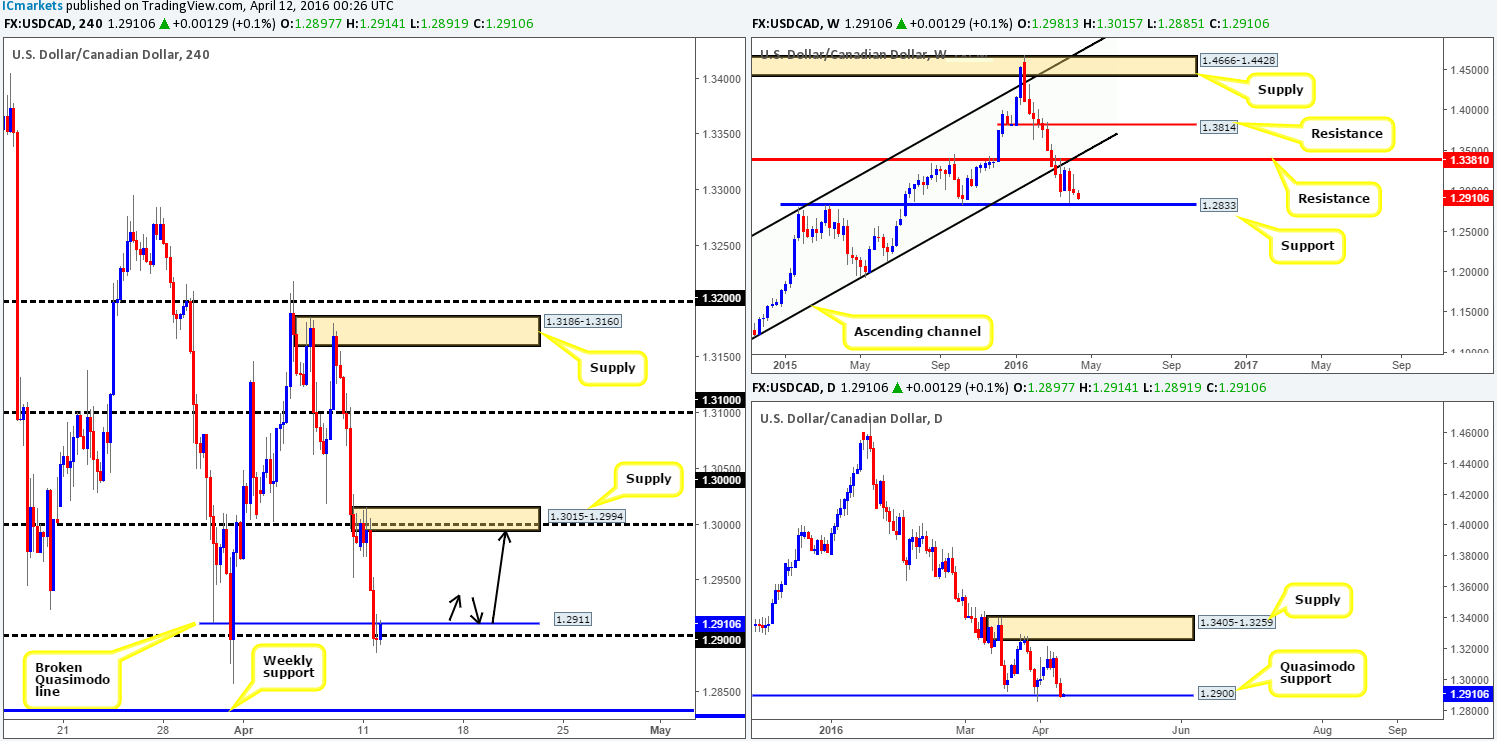
For those who read Friday’s report on the Loonie (see link below) you may recall us mentioning to watch for shorts from the underside of 1.3000. As we can all see, following a couple of selling wicks, price darted south towards the 1.2900 region yesterday (take-profit area), surpassing the H4 Quasimodo support line at 1.2911 along the way. Well done to any of our readers who managed to board this train before it departed!
In view of support coming in from 1.2900 right now (which should not be a surprise considering it is also a daily Quasimodo support line as well), where do we go from here? Well, if price manages to close above the recently broken H4 Quasimodo line at 1.2911 today, we’ll be looking to buy (preferably on the retest of 1.2911) up to at least H4 supply coming in at 1.3015-1.2994 (as per the black arrows). Conversely, should the bears continue to push lower, all eyes will then be on the weekly support lurking at 1.2833 for possible buying opportunities.
Levels to watch/live orders:
- Buys: 1.2900 [Tentative – confirmation required] (Stop loss: dependent on where one confirms this level). 1.2833 [Tentative – confirmation required] (Stop loss: dependent on where one confirms this level).
- Sells: Flat (Stop loss: N/A).
USD/CHF:
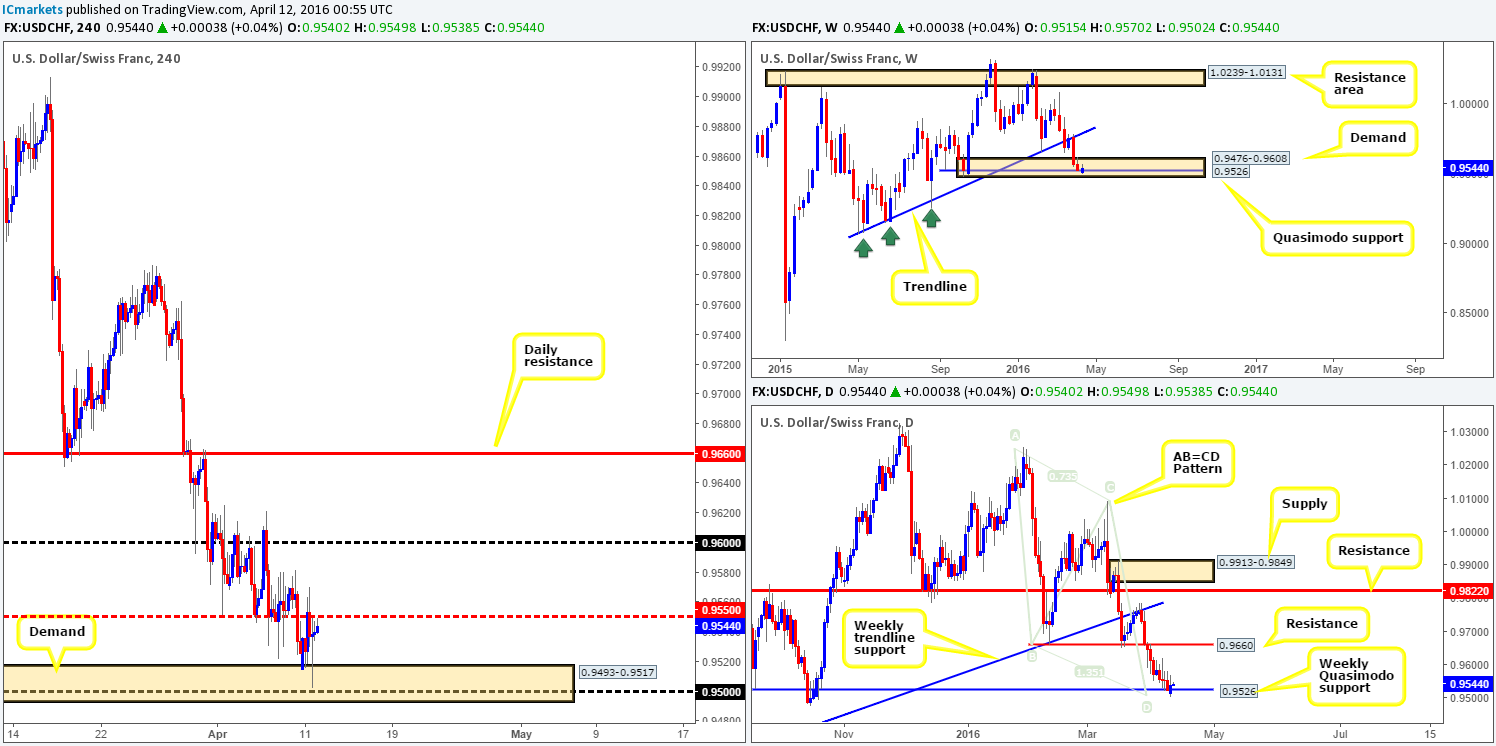
Starting from the top this morning, one can see that weekly price is currently holding firm above Quasimodo support at 0.9526, which is also wrapped up in a demand zone chalked in at 0.9476-0.9608. As we mentioned in Friday’s report (see link below), the current weekly Quasimodo line is also bolstered by a daily AB=CD bullish completion, thus adding weight to a possible reversal being seen.
In addition to the above, we also pointed out that our team placed a pending buy order above H4 demand drawn from 0.9493-0.9517 at 0.9519, with a stop below at 0.9490. As is shown on the H4 chart, our order was filled shortly after the market opened. Initially, we were going to take partial profits at the mid-level resistance 0.9550, but decided against it (due to the clear higher-timeframe support in place) and are now looking for a close above this number, and a move up to 0.9600 for partial profits. From this point, we’d be looking to trail this position up to at least the 0.9660 level – daily resistance.
Levels to watch/live orders:
- Buys: 0.9519 [LIVE] (Stop loss: 0.9490).
- Sells: Flat (Stop loss: N/A).
DOW 30:
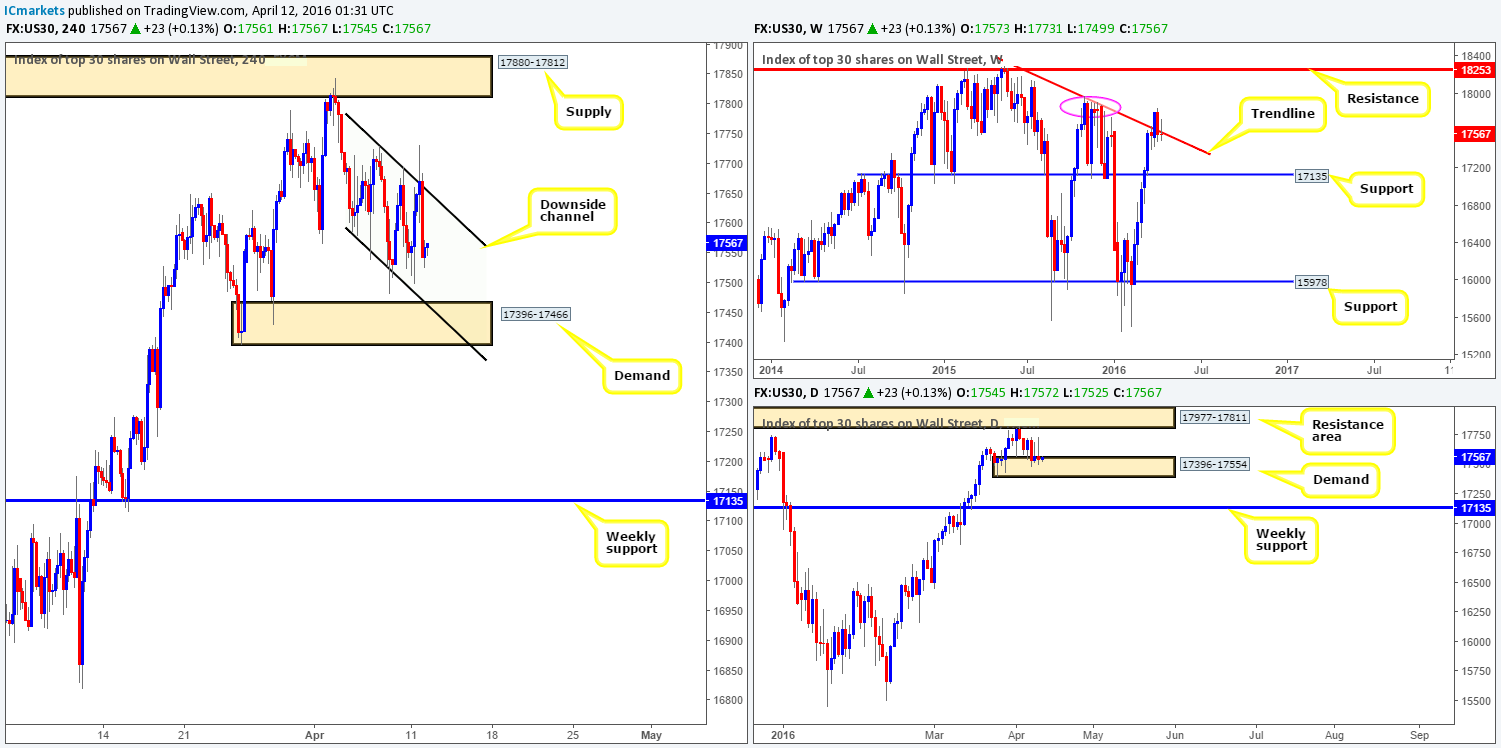
Studying the weekly chart this morning, we can see that the sell-side of this market has managed to keep price below the underside of a trendline resistance extended from the high 18365, bolstered by active offers seen from an area of weekly resistance (pink circle) at 17898. Although the bears are beginning to demonstrate some grit on the weekly timeframe, one must take into account that daily bulls remain on guard at demand drawn from 17396-17554. In fact, this area (from the daily chart) is the last obstacle to a move to weekly support at 17135 – the next weekly downside target.
Over on the H4 chart, nevertheless, the downside channel formation (17730/17586) continues to hold firm, with the upper edge being seen actively traded during the American session yesterday. Much the same as Friday’s report, the only area that catches our eye at the moment for possible trading opportunities is the H4 demand at 17396-17466, since it ties in nicely with the lower edge of the aforementioned H4 channel support line. In addition to this, it also sits within the extremes of daily demand that we discussed above. The only downside here of course is the fact that weekly price is showing bearish intentions at this time. Therefore, one could look to trade this barrier long if and only if a decent lower timeframe buy setup is seen beforehand (for confirmation techniques, see the top of this report).
Levels to watch/live orders:
- Buys: 17396-17466 [Tentative – confirmation required] (Stop loss: dependent on where one confirms this area).
- Sells: Flat (Stop loss: N/A).
XAU/USD:
(Gold – slightly revised from our previous outlook)
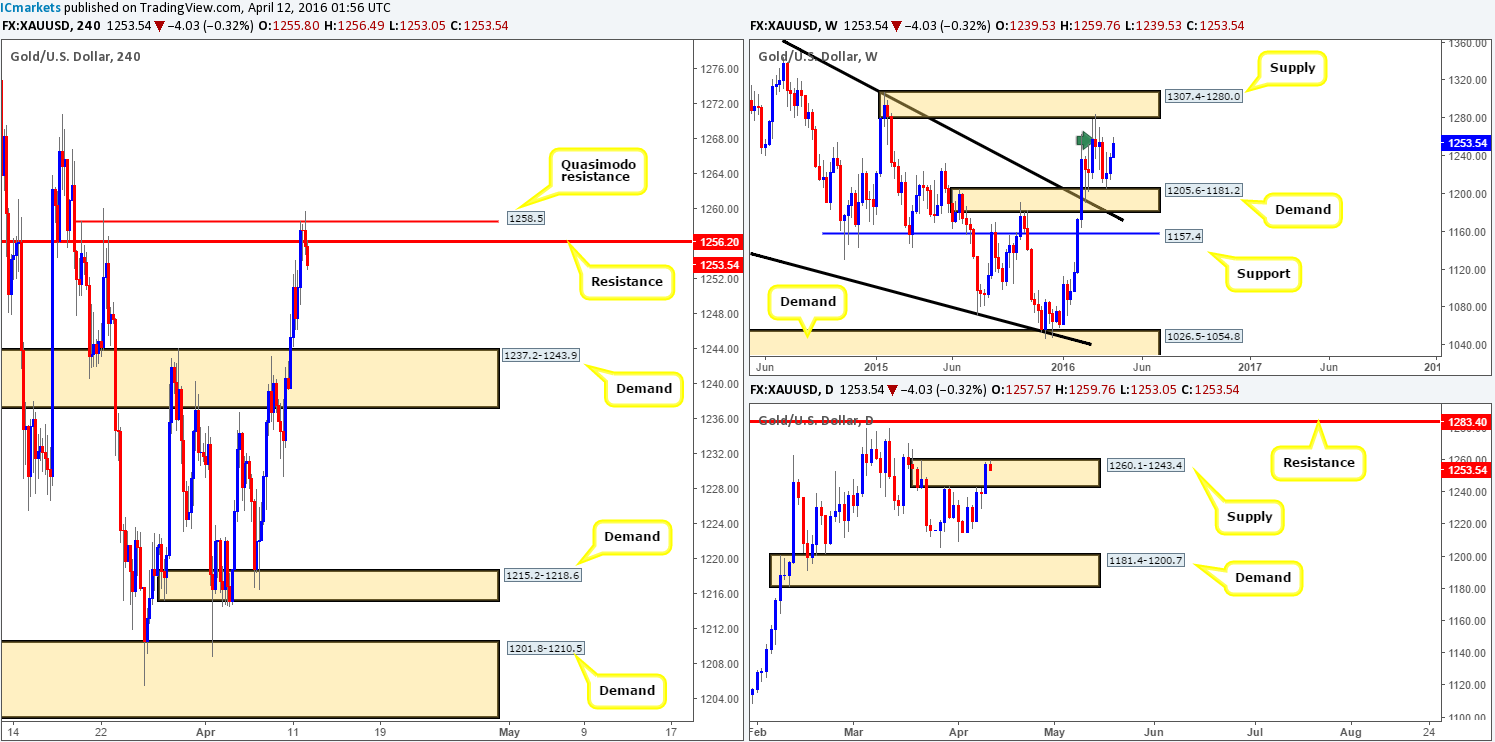
In Friday’s report (see link below) we spoke above looking for a break above and retest of the H4 supply at 1237.2-1243.9. As we can all see, price did break higher and even surpassed our pre-determined take-profit target at 1256.2 (H4 resistance) up to a H4 Quasimodo resistance at 1258.5. Unfortunately, however, price failed to retest the broken H4 supply as demand causing us to miss this move entirely.
From our perspective, it’s quite likely we’re going to see Gold depreciate in value from the current H4 Quasimodo resistance line at least until the H4 supply-turned demand at 1237.2-1243.9. Reason being is not only is there a reasonably clear run south down to this H4 demand zone, but the daily is trading within the extremes of supply coming in at 1260.1-1243.4. Furthermore, we’re expecting to see an appearance from the weekly sellers as there is likely some active supply around the 1270.8-1250.3 region (see green arrow) ahead of the major supply area above at 1307.4-1280.0. That being the case, our prime focus today will be on shorting the yellow metal from around the 1258.5/1256.2 region alongside a lower timeframe sell setup (for confirmation techniques, see the top of this report), targeting the 1243.0 mark.
Levels to watch/live orders:
- Buys: Flat (Stop loss: N/A).
- Sells: 1258.5/1256.2 [Tentative – confirmation required] (Stop loss: dependent on where one confirms this area).


