
EUR/USD:
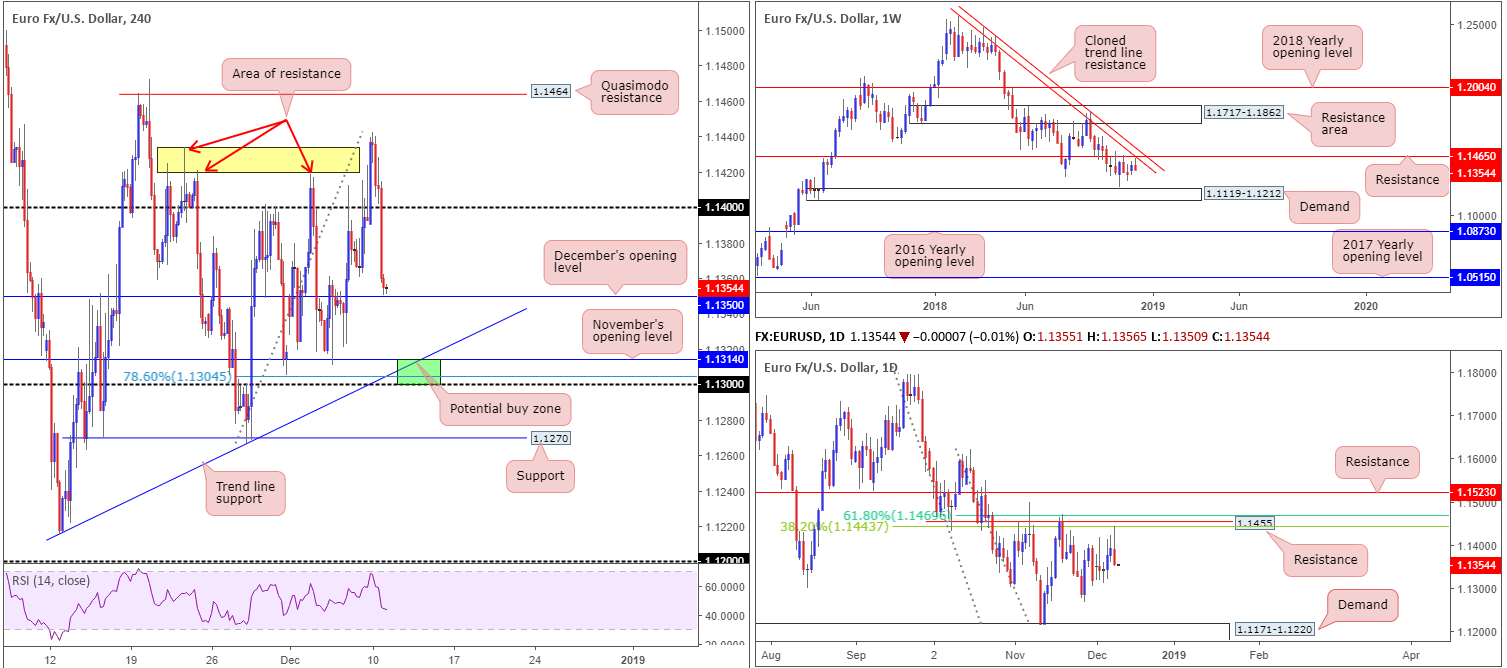
After decisively running stop-loss orders above H4 resistance (yellow) at 1.1434/1.1418 in early Asia Monday, the EUR/USD fell sharply. Further selling was observed throughout London and US sessions, as the greenback benefited from Brexit woes and fears of a global economic slowdown.
Stop-loss orders beneath 1.14 were also tripped yesterday from traders looking to fade the number following the session high printed in Asia at 1.1442. The break of this number also activated breakout sellers’ orders, therefore adding fuel to the sell side of this market. According to the H4 scale, the pair concluded the day bottoming just north of December’s opening level at 1.1350. Although the market may witness a bounce materialize from this region, the more appealing level resides around 1.13/1.1314, according to our research team (green – comprised of November’s opening level at 1.1314, a trend line support (taken from the low 1.1215), a 78.6% Fibonacci support value at 1.1304 and a round number at 1.13).
In terms of where we stand on the bigger picture this morning, weekly price turned south just ahead of resistance priced in at 1.1465, which, as you can probably see, brings with it a nearby cloned trend line resistance (extended from the high 1.2413). A closer reading on the daily timeframe adds a proven base of resistance circulating around the 1.1455 region. What’s appealing here, other than the fact the level capped upside three times in November and is closely linked to the weekly resistance mentioned above at 1.1465, is the merging Fibonacci resistances: a 61.8% and a 38.2% at 1.1469 and 1.1443, respectively. Note price recently turned lower just ahead of the 38.2% Fibonacci resistance.
Areas of consideration:
Medium term, the 1.13/1.1314 region marked in green on the H4 timeframe appears a reasonable location for a bounce higher today/this week. Why only a bounce comes down to both weekly and daily timeframes indicating a somewhat bearish vibe at the moment.
As for entry, traders have the choice of waiting for additional candlestick confirmation to form and entering based on the selected structure, or simply entering at 1.1314 and positioning stop-loss orders beneath 1.13.
Without seeing the approach, 1.1350 (December’s opening level) appears to be a logical starting point in terms of take-profit targets.
Today’s data points: German ZEW Economic Sentiment; US PPI m/m; US Core PPI m/m.
GBP/USD:
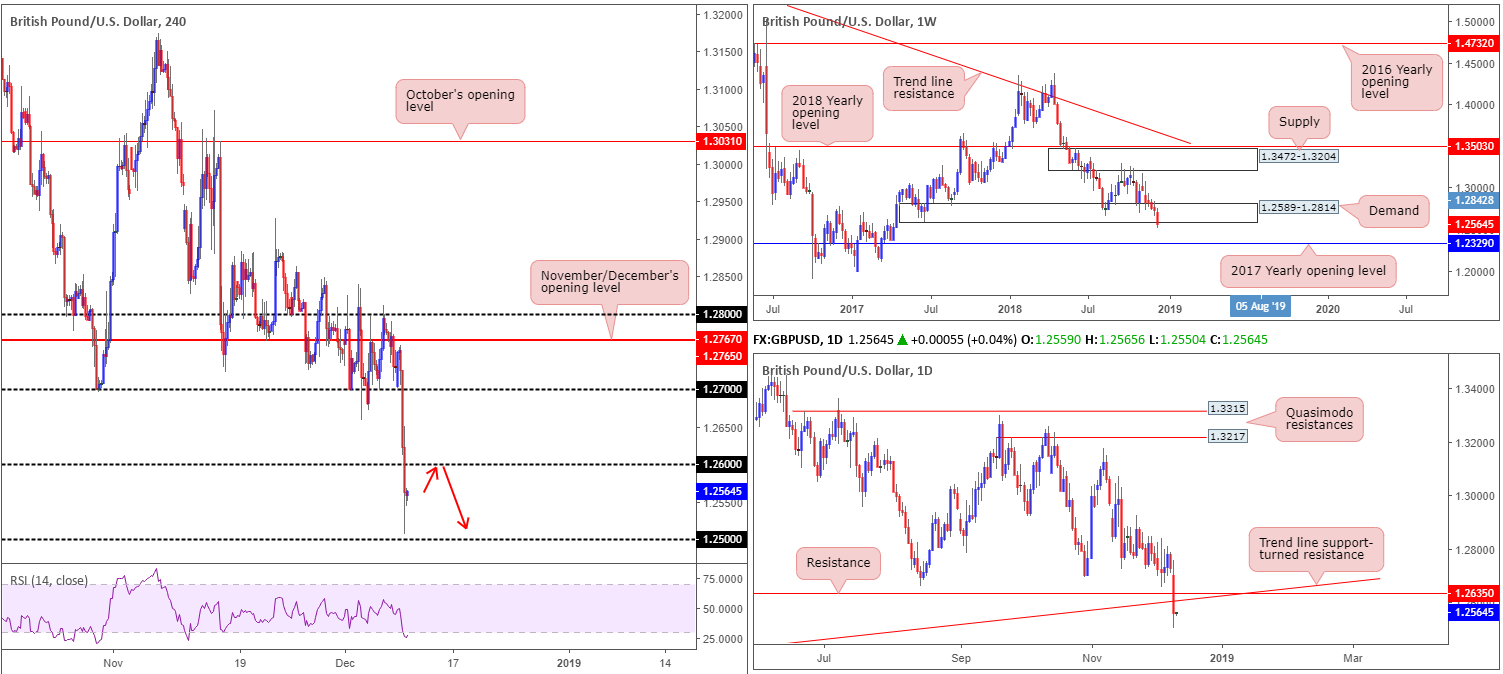
Sterling decisively ceded further ground to its US counterpart Monday as the UK government confirmed Tuesday’s vote was cancelled. The financial markets seldom respond favourably to uncertainty and yesterday was no different.
Cable finished the US session mildly paring losses just north of 1.25, securing a fresh 2018 yearly low of 1.2506. Thanks to yesterday’s selloff, the 1.26 handle offers a potential sell zone today, given there are likely unfilled sell orders positioned around this region. With respect to support, apart from the 1.25 handle on the H4 timeframe, there’s a H4 demand residing at 1.2403-1.2445 (not seen on the screen).
Higher-timeframe structure reveals weekly demand at 1.2589-1.2814 had its lower edge taken out yesterday, potentially setting the stage for further downside towards the 2017 yearly opening level at 1.2329. In similar fashion, daily movement also recently overthrew support at 1.2635 (now acting resistance) and a trend line support (taken from the low 1.1904). The next support target on the daily scale falls in around 1.2374 (not seen on the screen).
Areas of consideration:
In light of the bleak fundamental picture out of the UK right now, and both weekly and daily charts emphasizing additional selling might be at hand, shorts around the underside of the 1.26 handle on the H4 timeframe are an option today.
Knowing round numbers are prone to fakeouts, however, traders are urged to wait for additional candlestick confirmation before pulling the trigger (entry/stop parameters can be defined according to this pattern). From here, traders can look to target 1.25 as the initial port of call.
Today’s data points: UK Employment Data; US PPI m/m; US Core PPI m/m.
AUD/USD:
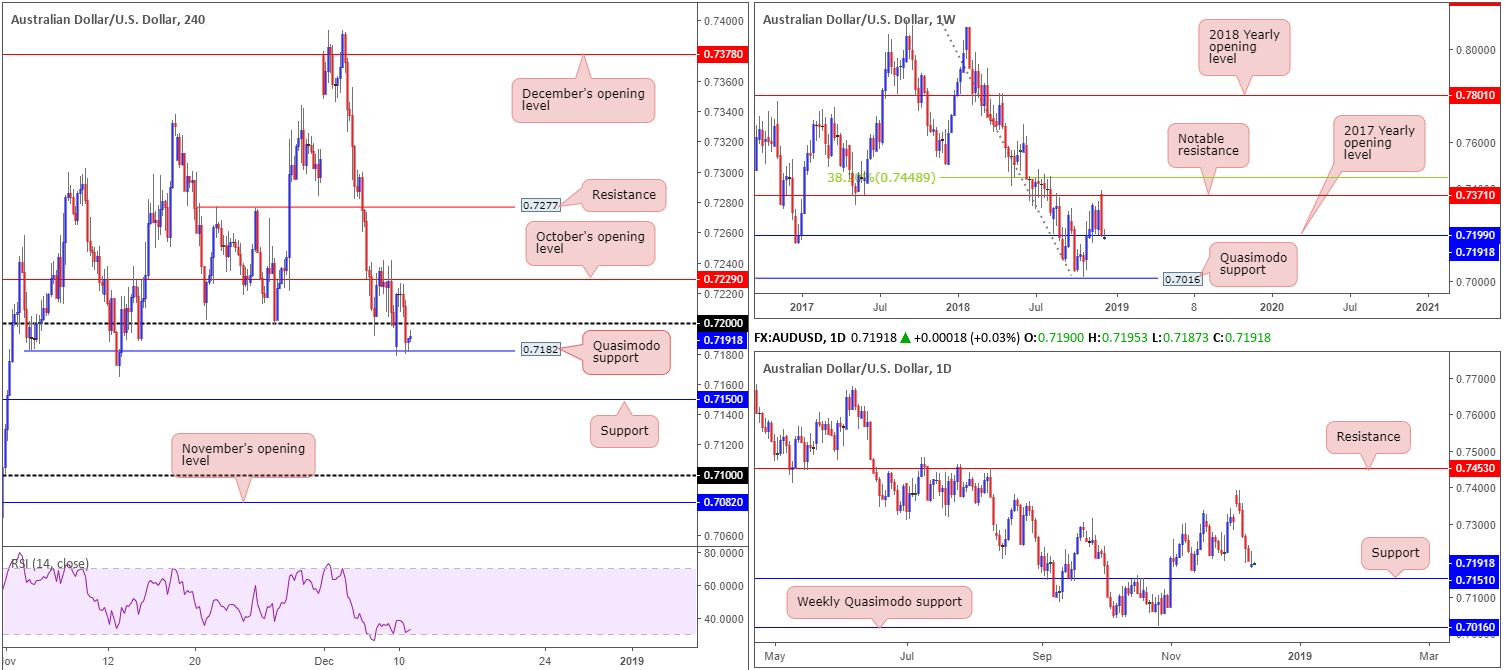
The AUD/USD reclaimed 0.72+ status in early Asia Monday, though bullish momentum quickly stalled just south of October’s opening level at 0.7229. Ongoing US-China trade war concerns remains a key market factor in this market, hampering upside.
As is evident from the H4 timeframe, the pair recaptured 0.72 to the downside amid US hours and retested the nearby H4 Quasimodo support at 0.7182, thus ending the day all but unchanged at the close. Should this barrier give way, there’s little stopping the unit from approaching support coming in at 0.7150. Although this level aligns perfectly with daily support at 0.7151, further downside beyond this level is a possibility. Weekly sellers will likely be looking to get involved as a large portion of stops beneath the 2017 yearly opening level at 0.7199 would have been filled. The next area of concern (support) on the weekly scale falls in around 0.7016: a Quasimodo support.
Areas of consideration:
According to the technical picture’s structure, this is a delicate market at the moment. Sellers could already be loading up on shorts after taking out the 2017 yearly opening level at 0.7199 on the weekly timeframe, though at the same time, active buyers are possibly positioned around nearby daily support at 0.7151.
Ultimately, the research team has labelled this market flat for the time being, as technical elements are mixed.
Today’s data points: US PPI m/m; US Core PPI m/m.
USD/JPY:
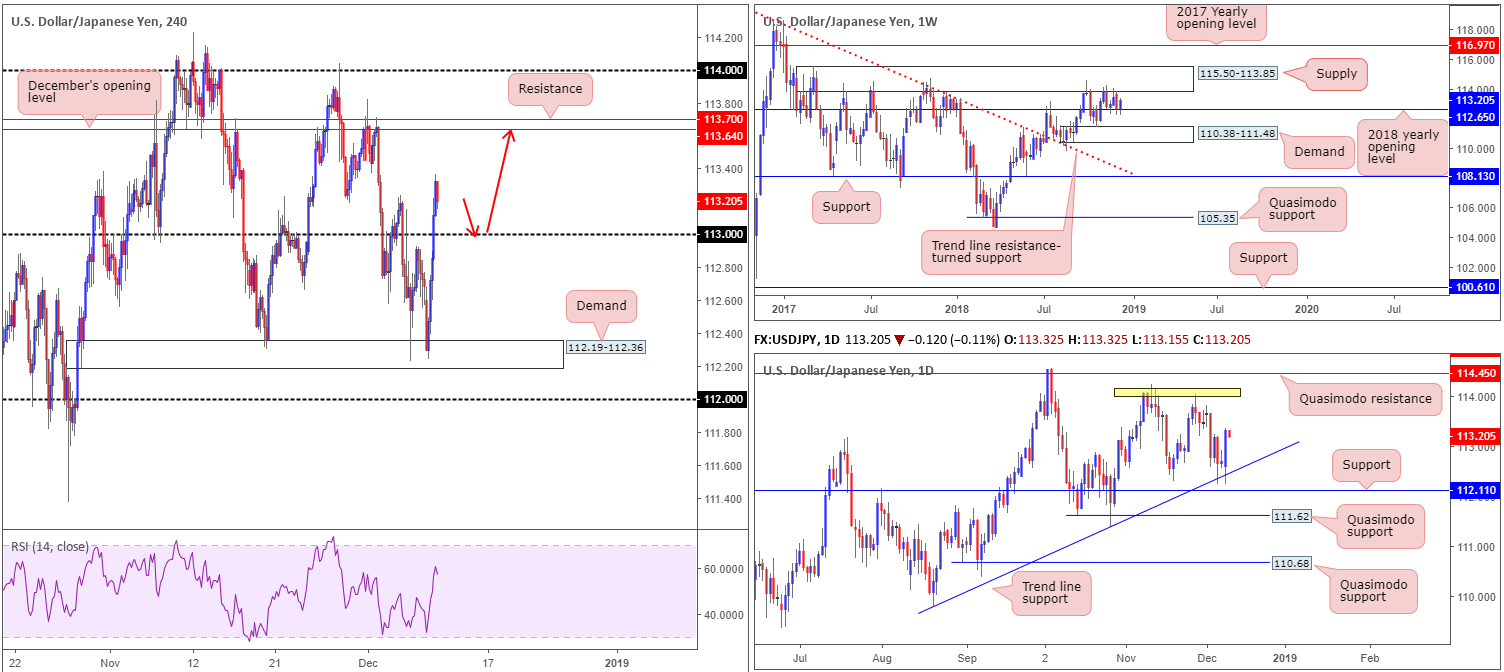
For those who read Monday’s briefing you may recall the piece highlighted promising buying opportunities either off H4 demand at 112.19-112.36, or the round number located beneath it at 112. As you can see, the H4 demand retained its position in early Asia Monday and drew in buyers to lift price action above 113 to highs of 113.36.
Why the research team selected this area came down to the higher-timeframe structure. Weekly price was in the process of testing the 2018 yearly opening level at 112.65. In support of weekly price, daily movement recently checked in with a trend line support (etched from the low 109.77). Well done to any of our readers who managed to take advantage of this move!
In terms of upside targets at current price, H4 structure shows resistance residing around December’s opening level at 113.64, trailed closely by resistance at 113.70. Meanwhile, weekly price displays room to press as far north as weekly supply coming in at 115.50-113.85, and daily price appears poised to approach tops located around the 114.05ish neighbourhood.
Areas of consideration:
With all three timeframes suggesting additional buying might be on the cards, a retest of 113 as support today could provide a platform for longs, targeting December’s opening level mentioned above at 113.64 (red arrows). To avoid the possibility of a whipsaw beneath 113, which is common viewing around psychological numbers, traders may look to enter based on bullish candlestick confirmation. Not only will this provide entry/stop levels, it’ll also reveal buyer intent.
Today’s data points: US PPI m/m; US Core PPI m/m.
USD/CAD:
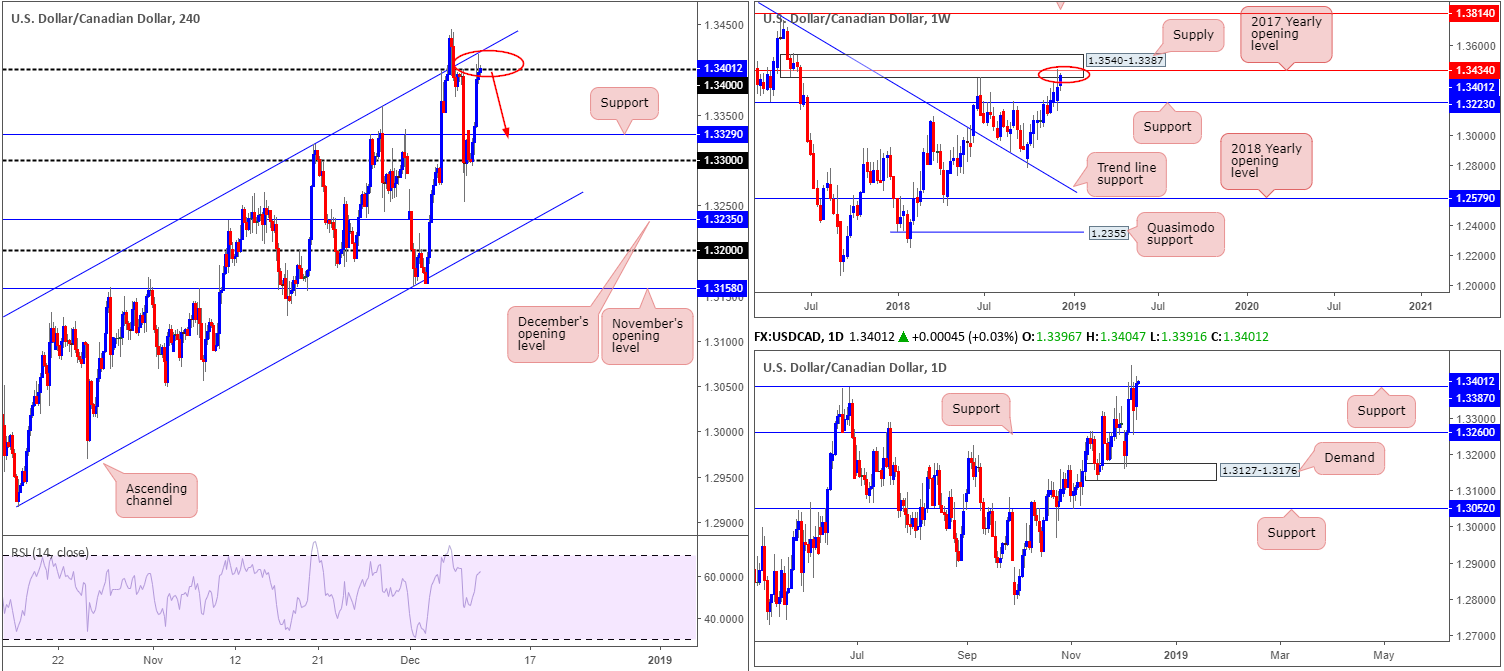
A combination of softening crude oil prices and broad-based USD buying lifted the USD/CAD to higher ground Monday. Strong buying interest emerged from 1.33 on the H4 timeframe, pulling the unit above nearby resistance at 1.3329 (now acting support) towards 1.34/channel resistance (extended from the high 1.3317). Stop-loss orders above 1.34 are likely under pressure, and a portion of breakout buyers’ orders are perhaps filled.
With respect to the higher-timeframe action, weekly price is seen challenging supply at 1.3540-1.3387/the 2017 yearly opening level within at 1.3434. Despite this, daily movement recently conquered resistance at 1.3387 (now acting support), possibly unlocking the door towards resistance priced in at 1.3533 (not seen on the screen), located within the upper limit of the current weekly supply.
Areas of consideration:
With weekly supply at 1.3540-1.3387 in play, along with 1.34 and a H4 channel resistance also in motion, a pullback to lower levels may be on the cards towards H4 support priced in at 1.3329. However, having seen daily price portend further buying, traders are urged to exercise caution. Waiting for a decisive H4 bearish candlestick formation to print off 1.34 is recommended before pulling the trigger, as not only will this display seller intent, it’ll also provide entry/stop parameters.
Today’s data points: US PPI m/m; US Core PPI m/m.
USD/CHF:
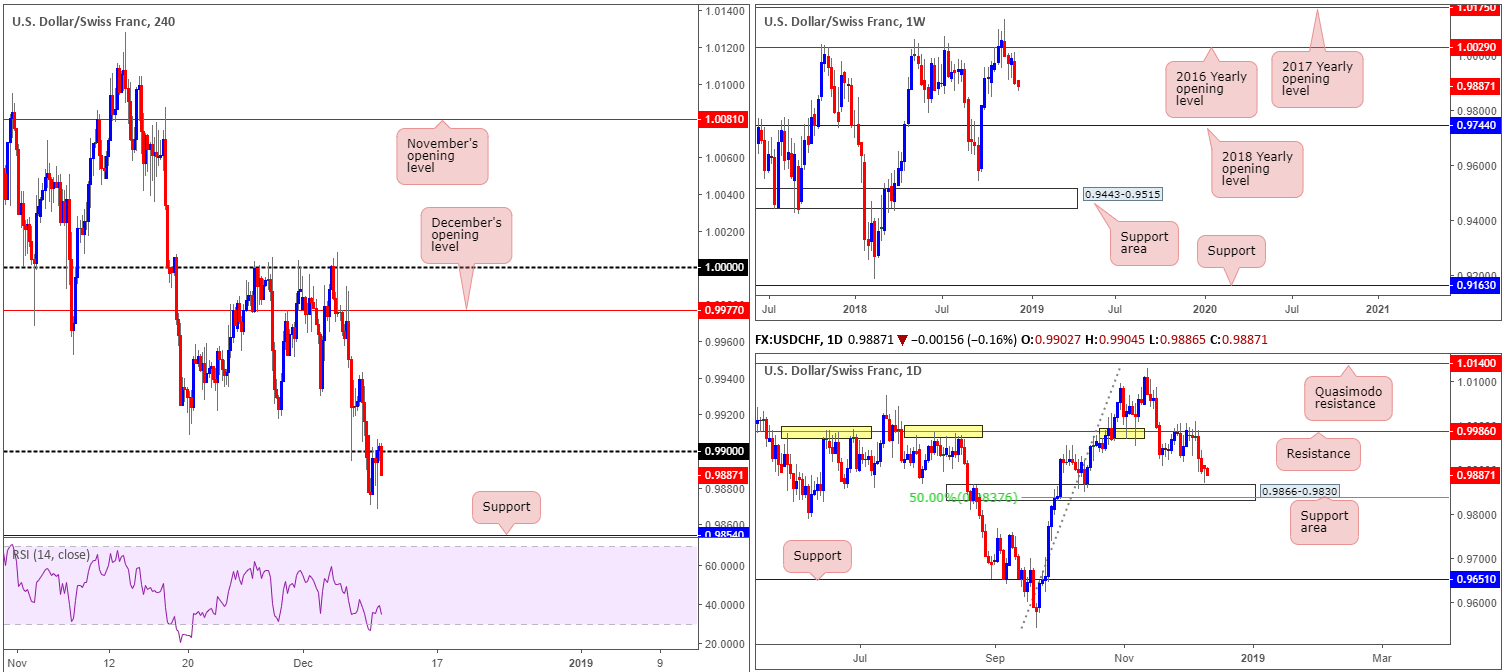
In recent sessions, the H4 candles tested lows of 0.9868 – levels not seen since mid-October – and pulled back to retest the underside of the 0.99 handle. Although buyers and sellers remain battling for position around this number, sellers appear to have the upper hand at the moment – check out the bearish rotation being seen from the current candle!
Assuming the current H4 candle closes as is, further selling towards H4 support at 0.9854 is in the offing. Supporting this, we can also see weekly structure indicating additional downside as the next support target does not come into play until the 2018 yearly opening level at 0.9744. The weekly timeframe’s bearish vibe is also echoed on the daily timeframe after meeting strong selling opposition off resistance at 0.9986 last week. The level, as you can see (yellow), boasts incredibly strong historical significance. The only difference between the weekly/daily timeframes is daily movement shows its next downside target falls in relatively close by at 0.9866-0.9830 in the form of a support area.
Areas of consideration:
With the higher timeframes signifying further selling, and H4 action showing promise sub 0.99, further downside is likely in store. As long as H4 candle closes in its current shape, this is likely sufficient enough to justify a sell (stop-loss orders can be positioned above the rejecting candle’s wick), targeting the top edge of the daily support area mentioned above at 0.9866 as an initial take-profit zone.
Today’s data points: US PPI m/m; US Core PPI m/m.
Dow Jones Industrial Average:
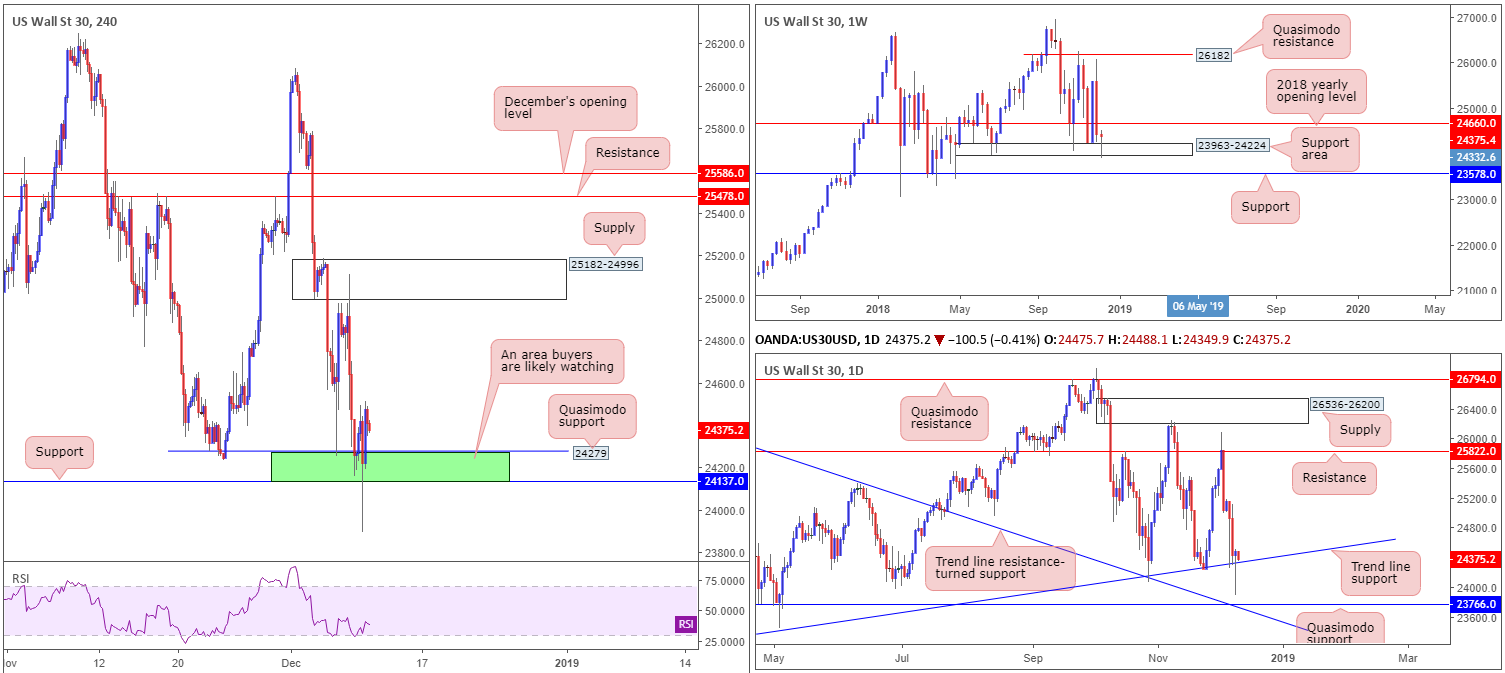
Global market sentiment remained delicate Monday on the back of global relationships from Brexit and the US/China dispute over Huawei’s CFO.
Weekly movement, as you can see, recently tested a noteworthy area of support at 23963-24224. In the shape of a strong bullish tail, price aggressively rejected the area and appears poised to reconnect with the underside of its 2018 yearly opening level at 24660.
In conjunction with weekly flow, daily action printed a nice-looking bullish pin-bar formation yesterday that pierced through a trend line support (etched from the low 23055). By and of itself, this has likely attracted candlestick enthusiasts into the market, with eyes on resistance at 25822 as the next upside target.
Despite a rather aggressive whipsaw to lows of 23894 amid early US hours Monday, 24137/24279 (green – comprised of a H4 Quasimodo support at 24279, a H4 support at 24137 and the top edge of the said weekly support area at 24224), maintained a defense.
Areas of consideration:
In view of our technical reading, the higher-timeframe picture shows buying could still enter the fold. With that being the case, traders are urged to keep a close eye on the green H4 area mentioned above at 24137/24279 for signs of buying pressure. A strong H4 bullish candlestick pattern printed out of this zone today would, according to the overall technical picture, likely be enough to justify considering a possible buy in this market. As for upside targets out of this zone, the underside of the 2018 yearly opening level on the weekly timeframe mentioned above at 24660 appears a logical starting point.
Today’s data points: US PPI m/m; US Core PPI m/m.
XAU/USD (Gold):
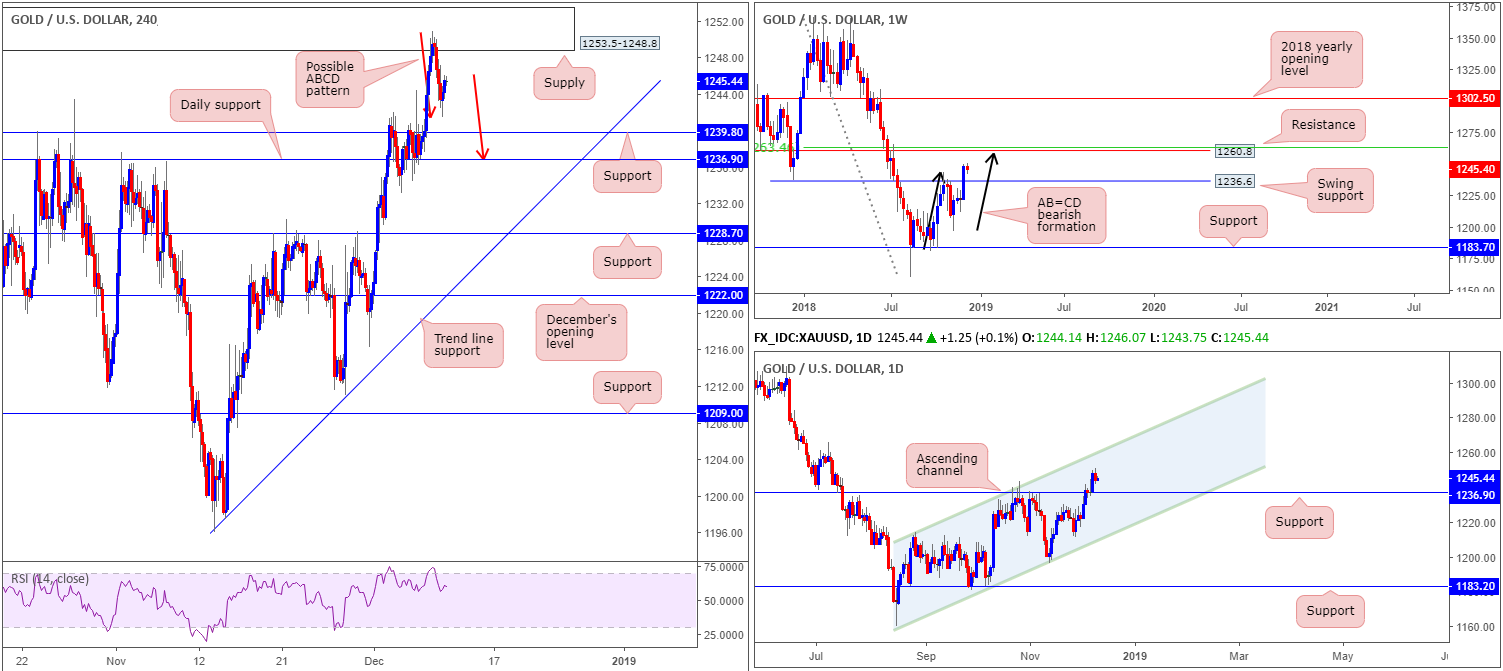
H4 supply at 1253.5-1248.8, as you can see, confronted buyers head on Monday. Influenced by a robust USD, H4 action pressed the yellow metal as far south as 1241.4, though managed to find a bottom just north of a support level priced in at 1239.8.
Whether price action decides to retest the H4 supply today is difficult to judge, given daily support at 1236.9 is seen positioned close by (also effectively represents weekly support at 1236.6 as well). Couple this with the possibility of a H4 ABCD bullish formation (red arrows) taking shape that completes around the daily support adds weight to a move lower coming to fruition. What this also implies is a fakeout of nearby H4 support at 1239.8 may take shape, so do bear this in mind if you’re contemplating a long from this vicinity.
Areas of consideration:
Ultimately, the research team believes if the market tests daily support highlighted above at 1236.9 today, a rotation to the upside will highly likely be observed. This is simply because both weekly and daily timeframes agree support resides around 1236.9ish.
Should the metal explore higher ground today from current prices, on the other hand, and challenge the current H4 supply, the research team recommends waiting for the area to be engulfed. A break above this zone followed by a pullback to the H4 support at 1239.8/daily support at1236.9 places the market in good stead for a rally towards weekly resistance at 1260.8. The break through H4 supply theoretically clears the majority of sellers out of the market, unlocking the pathway north to higher levels. Note the weekly resistance level is also joined by a possible AB=CD bearish completion point (black arrows) and a nearby 50.0% resistance value at 1263.4.
The use of the site is agreement that the site is for informational and educational purposes only and does not constitute advice in any form in the furtherance of any trade or trading decisions.
The accuracy, completeness and timeliness of the information contained on this site cannot be guaranteed. IC Markets does not warranty, guarantee or make any representations, or assume any liability with regard to financial results based on the use of the information in the site.
News, views, opinions, recommendations and other information obtained from sources outside of www.icmarkets.com.au, used in this site are believed to be reliable, but we cannot guarantee their accuracy or completeness. All such information is subject to change at any time without notice. IC Markets assumes no responsibility for the content of any linked site. The fact that such links may exist does not indicate approval or endorsement of any material contained on any linked site.
IC Markets is not liable for any harm caused by the transmission, through accessing the services or information on this site, of a computer virus, or other computer code or programming device that might be used to access, delete, damage, disable, disrupt or otherwise impede in any manner, the operation of the site or of any user’s software, hardware, data or property.


