
Key risk events today:
Australia NAB Business Confidence; UK Employment Data.
(Previous analysis as well as outside sources – italics).
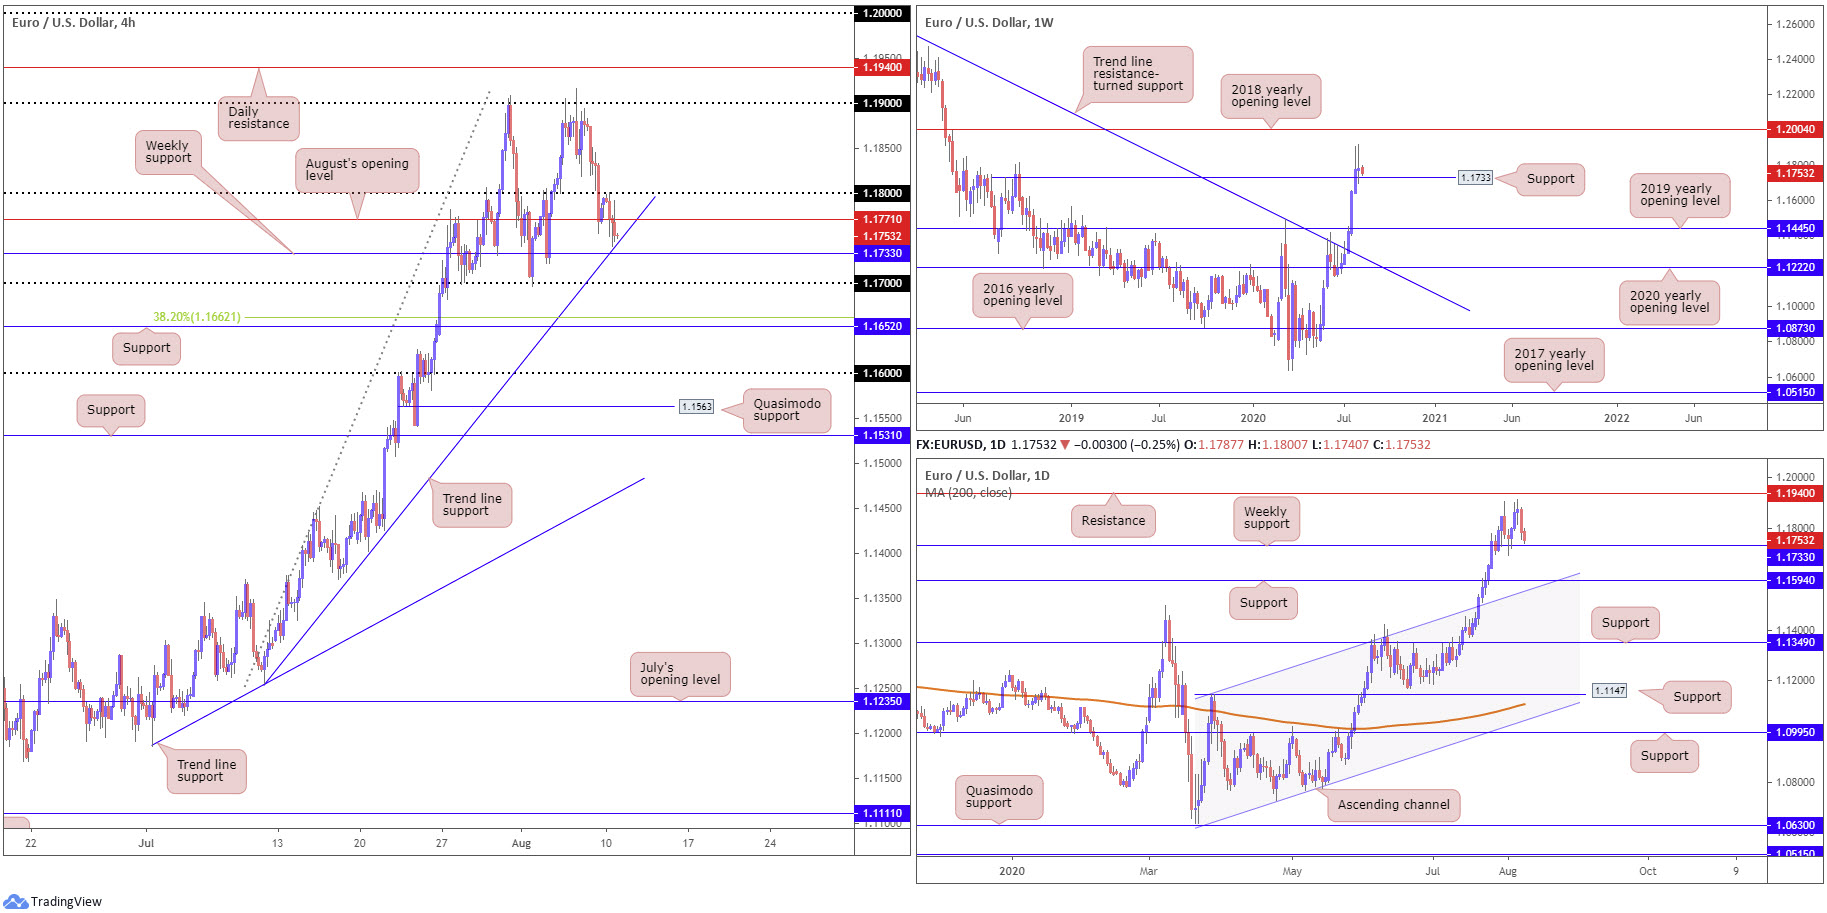
EUR/USD:
The US dollar index, or DXY, built on Friday’s advance during Monday’s session, clocking highs at 93.70. As a reminder, the DXY closed out last week recording a seventh consecutive decline.
Going into the early hours of European trading Monday, 1.18 elbowed its way back into the spotlight on EUR/USD as a resistance following Friday’s decisive breach. Recent downside has observed H4 action trade within striking distance of trend line support, extended from the low 1.1254, which happens to align closely with weekly support at 1.1733 (a previous Quasimodo resistance level). Brushing aside the aforementioned level this week places 1.17 in view on the H4, followed by support at 1.1652 (merging closely with a 38.2% Fibonacci retracement ratio at 1.1662).
Price action based on the weekly timeframe shows we recently struck a fresh 27-month peak at 1.1916. North of 1.1733, the 2018 yearly opening level at 1.2004 is seen as the next available resistance, whereas a dip to deeper water could have the pair shake hands with the 2019 yearly opening level at 1.1445.
A closer reading of price action on the daily timeframe also shows the weekly level at 1.1733 as a base for support. Resistance on the daily chart, however, can be seen parked at 1.1940, with a break largely exposing weekly resistance mentioned above at 1.2004 (2018 yearly opening level). Beyond 1.1733 (on the daily chart) could draw attention to daily support at 1.1594, a level closely connected with channel resistance-turned support, taken from the high 1.1147.
Areas of consideration:
The break of weekly trend line resistance (July 13), taken from the high 1.2555, and violation of the 1.1495 March 9 high, reflects a long-term (potential) technical trend change.
As stated in Monday’s technical briefing, 1.1733 weekly support is likely a watched level, particularly for buyers at the point it converges with H4 trend line support, drawn from the low 1.1254. A reaction from this point, one that moves price above August’s opening level at 1.1771 and 1.18, could strive to reach at least 1.19, with the possibility of stirring daily resistance at 1.1940 and even weekly resistance at 1.2004.
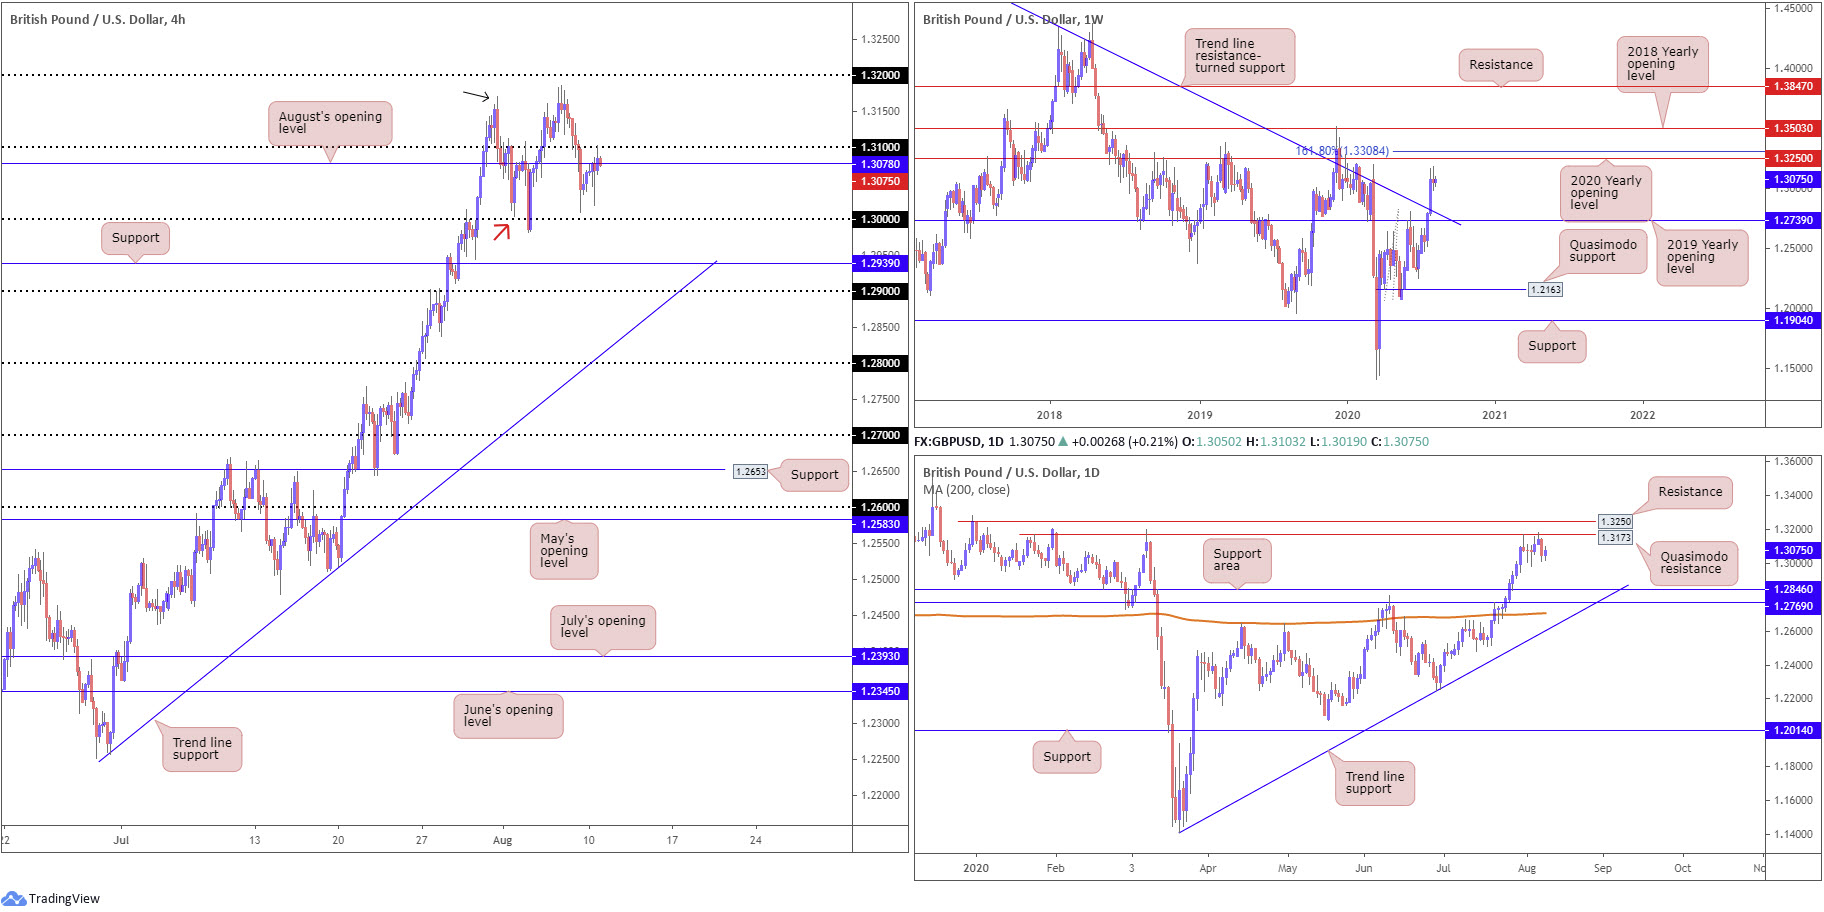
GBP/USD:
Despite the DXY ascending to fresh highs, GBP/USD entered an offensive phase and ran through August’s opening level at 1.3078 to touch gloves with the underside of 1.31. Turning lower today swings the key figure 1.30 back into the frame, a level boasting a connection with a Quasimodo support left shoulder (red arrow – 1.3004). Beyond here, traders’ crosshairs are likely fixed on support listed at 1.2939 and then the 1.29 handle. Above 1.31, traders may be watching the left shoulder (black arrow) at 1.3170 to provide some resistance, though most will be eyeing 1.32.
Price structure on both the weekly and daily timeframes remain unchanged, therefore here’s a reminder of where we left things in Monday’s technical briefing (italics):
The recent trend line resistance break on the weekly timeframe (1.5930), despite the 1.3514 December 9 high (2019) still intact (a break of here also signals trend change to the upside), may have long-term traders consider bullish positions.
After powering through trend line resistance, scope to reach higher terrain is visible on the weekly timeframe, despite last week trading somewhat subdued. Resistance can be seen by way of the 2020 yearly opening level at 1.3250, closely tailed by a 161.8% Fibonacci extension point at 1.3308.
Leaving said resistances unchallenged this week and retreating south could call for a retest at the 2019 yearly opening level drawn from 1.2739 (dovetails closely with the recently broken trend line).
Daily timeframe:
Quasimodo resistance at 1.3173 entered the fold last week, a level situated south of 1.3250 resistance. Interestingly, the latter shares the same space with resistance on the weekly timeframe, the 2020 yearly opening level.
An extension to the downside this week may have a support area between 1.2769/1.2846 nudge its way into focus, positioned ahead of the 200-day SMA (orange – 1.2706) and trend line support, taken from the low 1.1409.
Areas of consideration:
Although weekly price indicates a shift to 1.3250ish, daily action is capped by Quasimodo resistance at 1.3173, threatening moves as far south as 1.2769/1.2846.
Against the backdrop of higher timeframe activity, the 1.30 figure on the H4 timeframe presents robust support to keep a tab on, despite the recent advance (knowing the level joins with Quasimodo support at 1.3004). Consequently, buyers could make a stand from this region and attempt a recovery.
A breakout north of 1.31 will equally likely arouse the interest of buyers, particularly those favouring breakout strategies. Upside targets fall in at daily resistance from 1.3173, followed by the 1.32 on the H4.
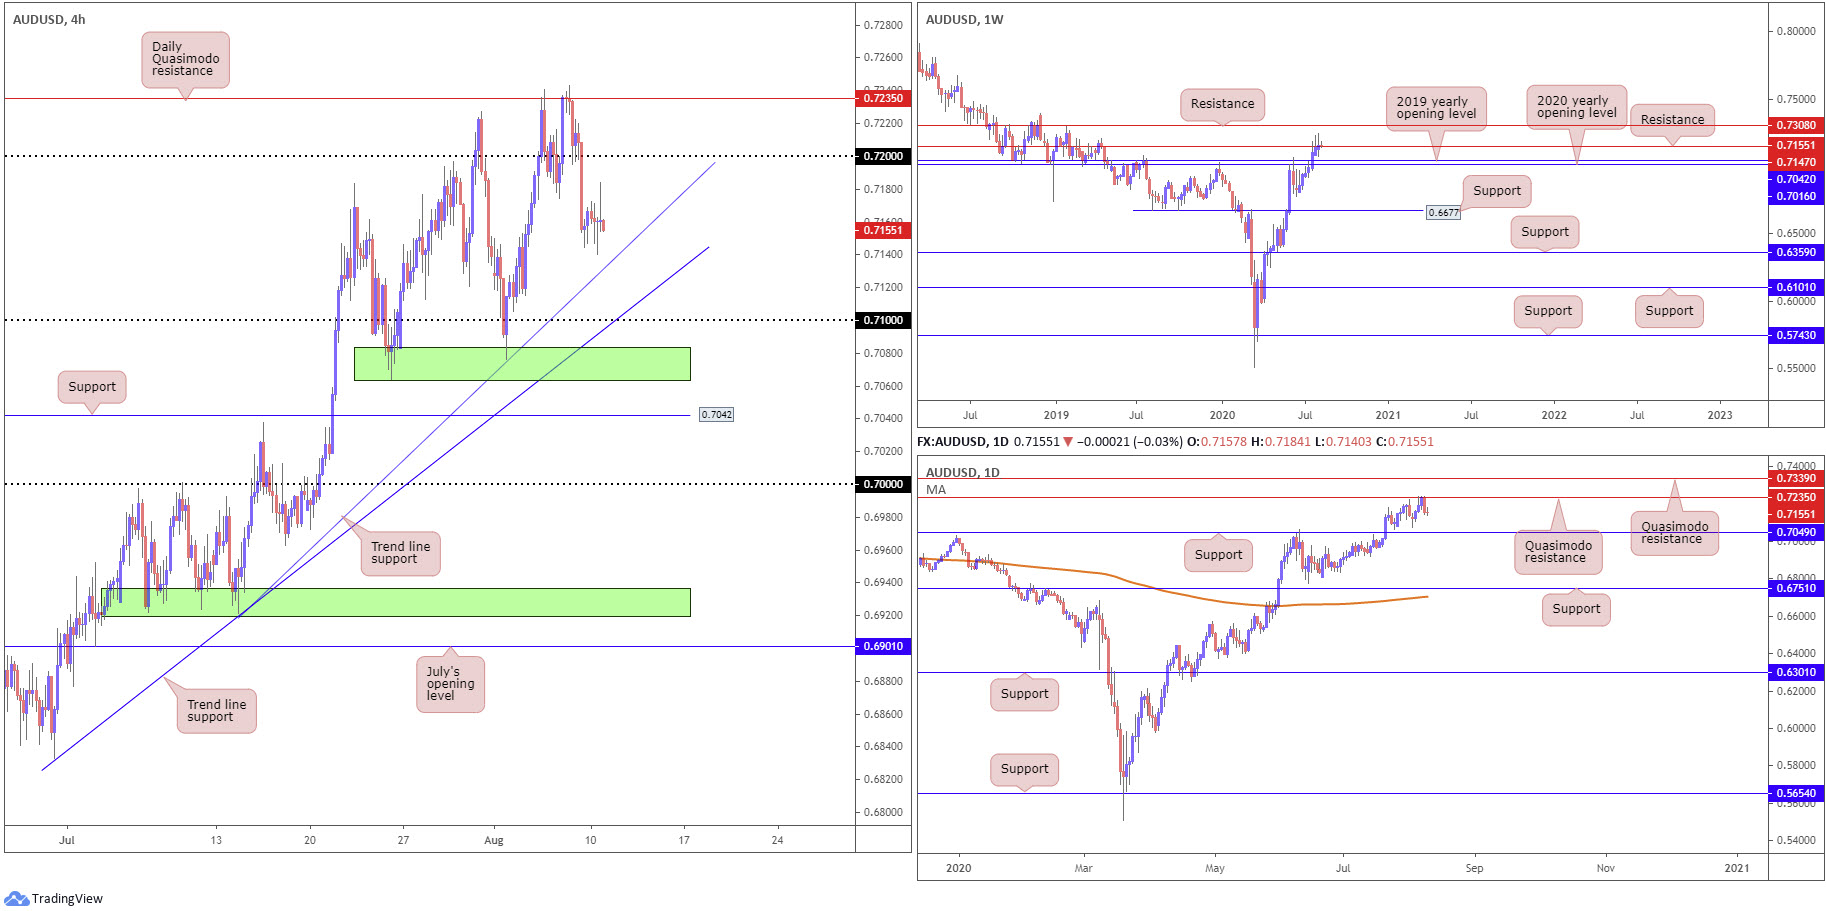
AUD/USD:
AUD/USD finished European trading unmoved, with daily extremes fashioned between 0.7140/0.7184. In light of Monday’s lacklustre performance, much of the following will echo thoughts put forward in Monday’s technical briefing.
From the weekly timeframe:
Buyers and sellers continue to battle for position around resistance at 0.7147, consequently ending recent trade considerably off best levels. As a result, upside momentum appears to be diminishing in recent weeks, underscoring the possibility of a retreat to the 2020 and 2019 yearly opening levels at 0.7016 and 0.7042, respectively. Conversely, assuming 0.7147 cracks, resistance at 0.7308 is likely to make an appearance this week.
From the daily timeframe:
Quasimodo resistance at 0.7235, as you can see, impacted price movement Friday, snapping a three-day bullish phase. This swings support back into the frame at 0.7049 this week, though given the current uptrend (present since March), prudent traders will also acknowledge the likelihood of reaching higher and perhaps testing Quasimodo resistance at 0.7339.
H4 perspective:
Despite a brief flicker of activity at 0.72, the round number relinquished its position heading into US trading as the buck responded to Friday’s non-farm payrolls data. Bypassing Thursday’s low at 0.7174, candle action concluded the week poised to reconnect with trend line support, pencilled in from the low 0.6921. Additional support can be found at another trend line support (0.6832) this week, coordinating closely with the 0.71 handle and a neighbouring support area (upper green) between 0.7063-0.7083.
Areas of consideration:
Waning momentum seen on the weekly timeframe, together with Friday sinking from Quasimodo resistance at 0.7235 on the daily timeframe, suggests a test of the two H4 trend line supports highlighted above in bold and round number 0.71. It is also possible we draw in the H4 support area noted at 0.7063-0.7083.
It will be at the aforementioned H4 supports traders expect dip-buyers to make a show. Failure to do so, we are then possibly headed for daily support at 0.7049, followed by H4 support at 0.7042 (merges with the 2019 yearly opening level on the weekly timeframe).
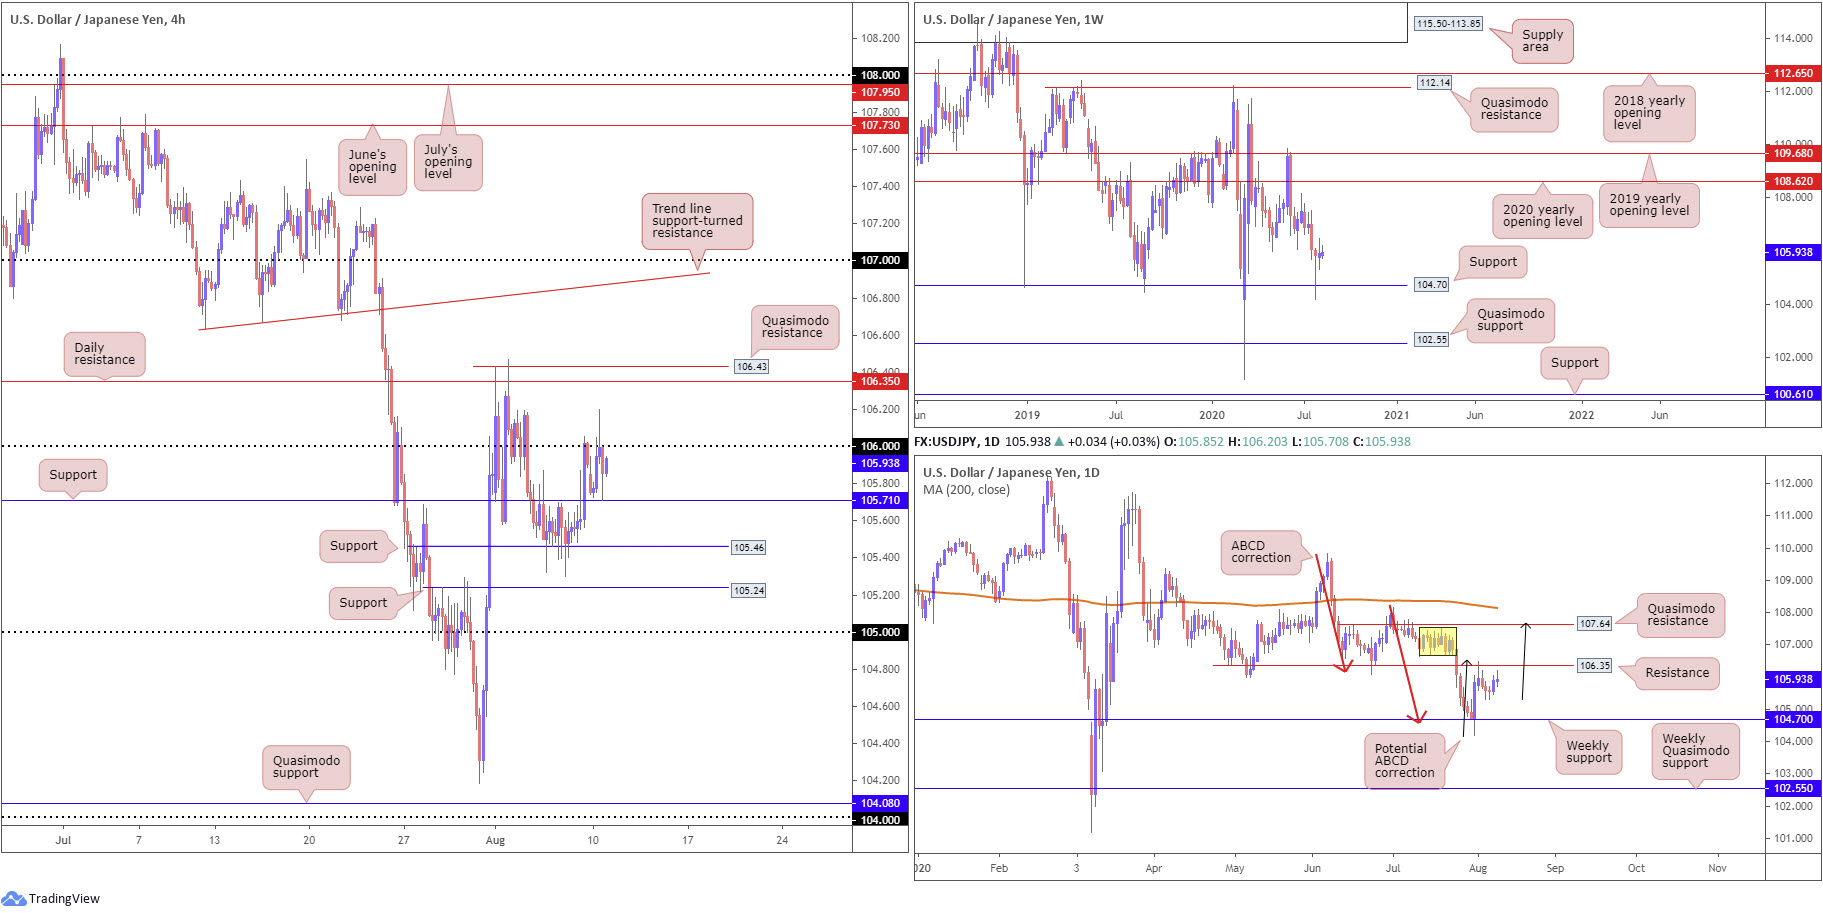
USD/JPY:
Buyers and sellers spent the first day of the week confined between the 106 handle and H4 support coming in at 105.71. Mid-way through London, as you can see, an animated push to the upside took shape, though buyers failed to sustain gains past 106.20 before collapsing back under 106. Traders can look forward to daily resistance at 106.35 entering the light should buyers manage to topple 106, stationed close by neighbouring H4 Quasimodo resistance at 106.43. In the event 105.71 gives way, support at 105.46 is in focus (prior Quasimodo resistance level).
Longer-term traders still appear to be digesting a recent hammer pattern on the weekly timeframe, established off support at 104.70. By and of itself, this is a strong bullish signal, with obvious upside targets resting as far north as the 2020 yearly opening level from 108.62 and the 2019 yearly opening level at 109.68.
The story on the daily timeframe shows that following an eager bounce from weekly support mentioned above at 104.70, resistance at 106.35 (a prior Quasimodo support) made an appearance. Ousting 106.35 is certainly an option, not only because of where the unit is coming from on the weekly timeframe, but also due to the lacklustre (bearish) response seen from 106.35 so far. Above the latter, we have supply to contend with at 107.54-106.67 (yellow), as well as Quasimodo resistance coming in at 107.64. Also worth acknowledging is the prospect of establishing an ABCD bearish correction (black arrows) that conveniently terminates around 107.64.
Areas of consideration:
Governed by the weekly timeframe rebounding from support at 104.70 and establishing a bullish candlestick signal, longer-term analysis suggests the possibility of a run higher. Daily resistance at 106.35, although an additional reaction could form, also shows signs of relaxing its position.
In addition to the above, research further reported the following in Monday’s briefing (italics):
This slides across two potential bullish scenarios to keep an eye on early week:
- A retest at 105.71, a move which may interest dip-buyers.
- A breakout above 106, consequently attracting breakout strategies.
Irrespective of the entry, daily resistance at 106.35 rests as the initial target, closely shadowed by H4 Quasimodo resistance at 106.43.
As evident from the H4 chart this morning, we can see a 105.71 retest took place with buyers appearing to be healthy. Those long are now likely watching for 106 to cede ground in order to reduce risk to breakeven. At the same time, a move above 106 is likely to draw in breakout strategies for the aforementioned targets (bold).
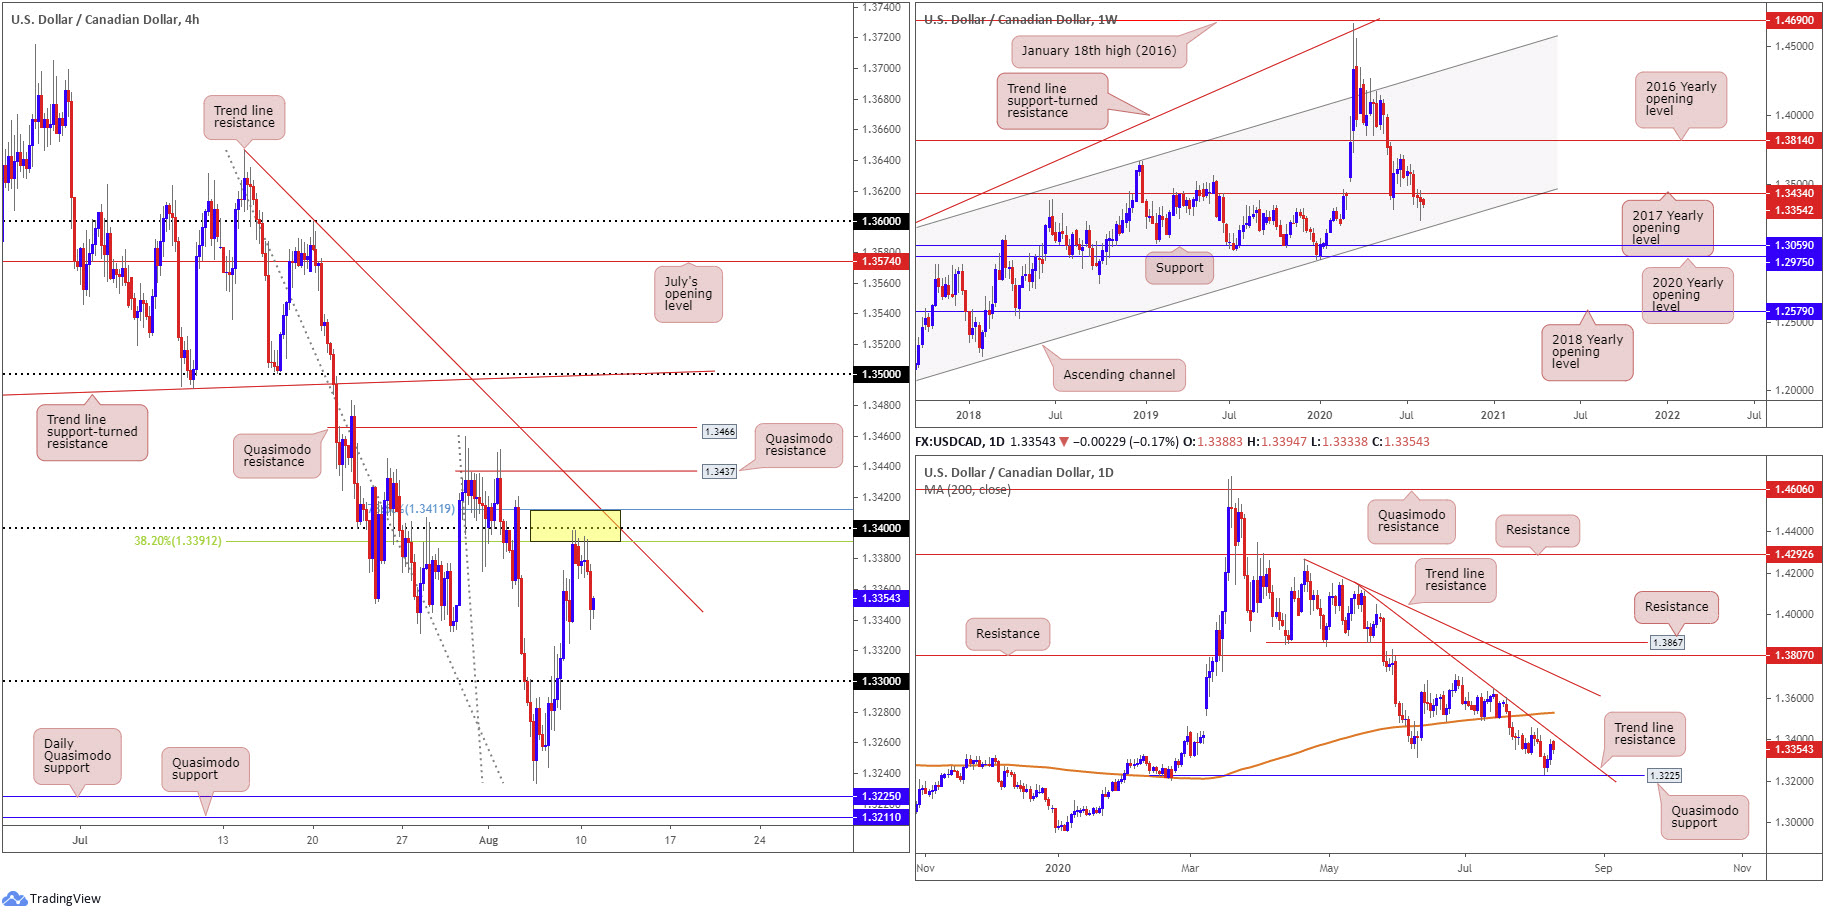
USD/CAD:
For those who read Monday’s technical briefing you may recall the following (italics):
This had USD/CAD extend north of the 1.33 handle and bump heads with an interesting area of resistance (yellow) between 1.3412/1.3391, made up of a 78.6% Fibonacci retracement ratio at 1.3412, the 1.34 handle and the 38.2% Fibonacci retracement ratio at 1.3391. Also worth pointing out is trend line resistance, taken from the high 1.3646, and Quasimodo resistance plotted at 1.3437.
A bearish response from the H4 resistance area at 1.3412/1.3391 is a possibility early week, owing to the confluence the zone brings to the table.
As evident from the H4 chart this morning, price rotated lower from 1.3412/1.3391 and shook hands with lows as far south as 1.3334.
As a reminder of where we stand on the bigger picture, Monday’s technical piece had the following to report (italics):
Weekly timeframe:
July 22 witnessed a break of the 2017 yearly opening level at 1.3434, signalling channel support, taken from the low 1.2061, could enter the fight. Yet, since the break we have seen sellers reluctant to commit, with last week finishing considerably off worst levels.
Daily perspective:
Heading into the second half of the week, price turned ahead of Quasimodo support at 1.3225 and extended recovery gains into the close.
Should we take the pair above the 2017 yearly opening level at 1.3434 this week, and cross above daily trend line resistance, taken from the high 1.4140, the 200-day SMA (orange – 1.3529) could surface as potential resistance.
Areas of consideration:
Current short positions out of 1.3412/1.3391 are likely considering reducing risk to breakeven at this point, with the majority (given the higher timeframe picture) potentially anticipating further declines to at least the 1.33 base (H4).
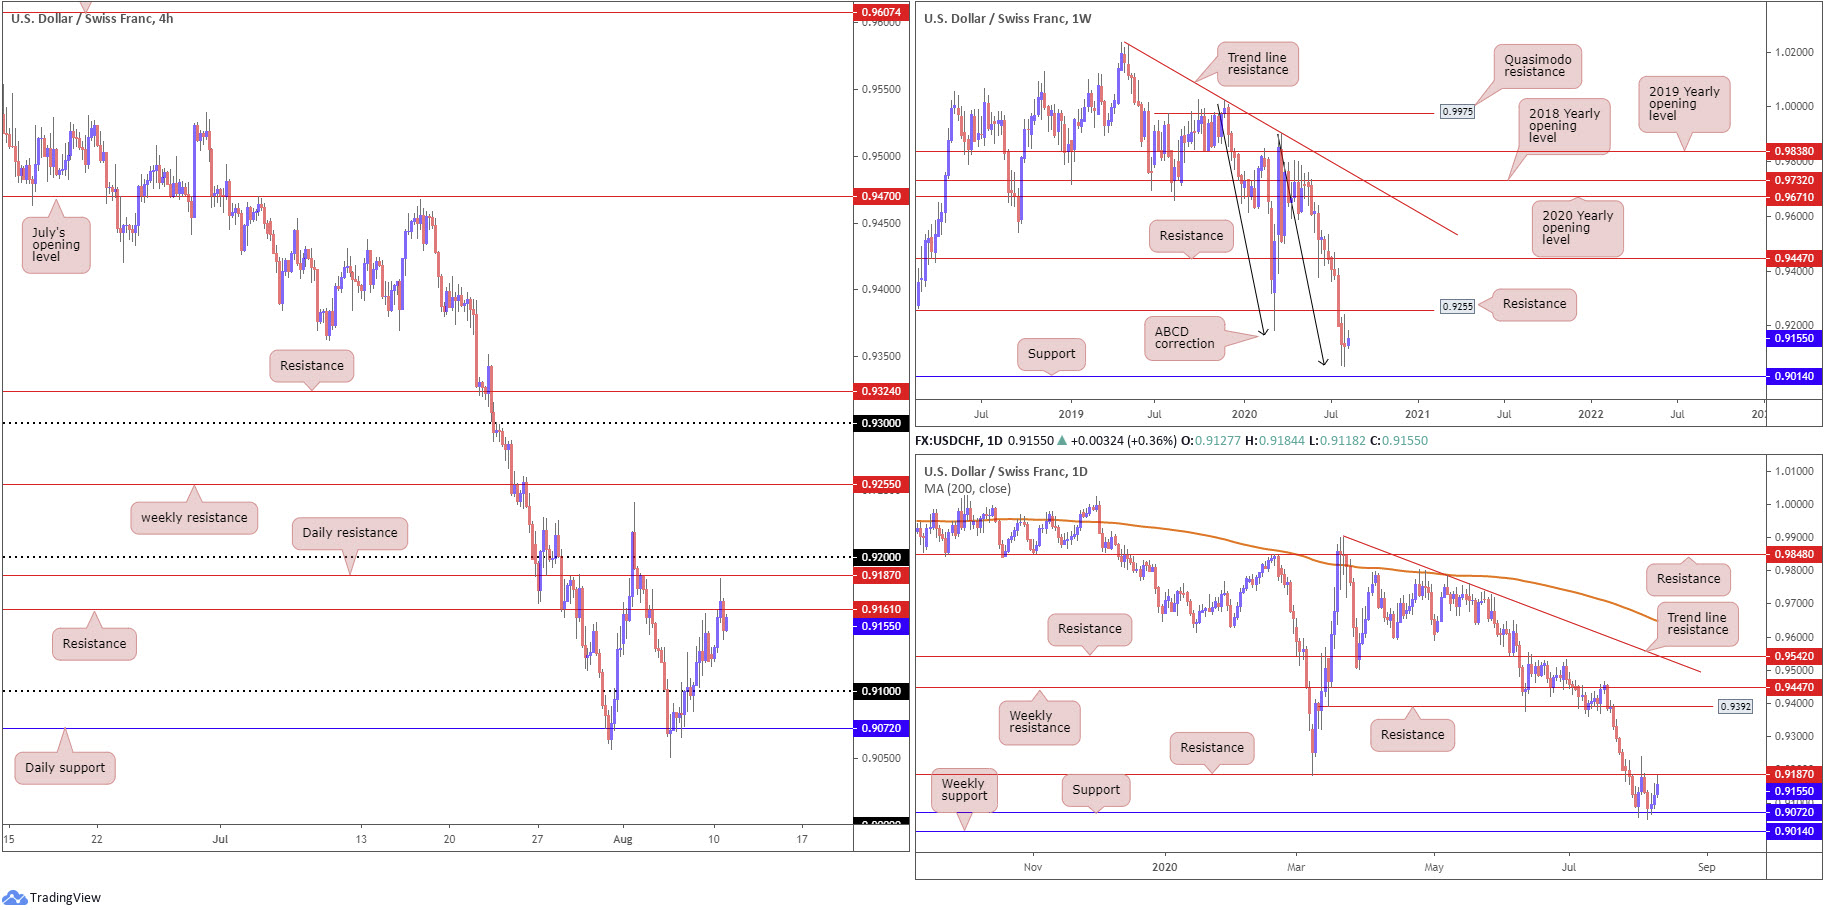
USD/CHF:
In conjunction with the US dollar index pencilling in additional upside, USD/CHF also took on a bullish presence Monday and extended recovery gains from daily support at 0.9072.
Sweeping to a third successive daily gain, technicians will acknowledge the recent whipsaw through H4 resistance at 0.9161 and near-test of daily resistance at 0.9187. These levels, as can be seen on the H4 chart, are positioned close by the 0.92 handle.
Looking at the technical landscape from the weekly timeframe, we can see we recently come off a seven-week decline. Buyers and sellers, however, wrapped up last week’s action hesitantly, forming a long-legged doji candlestick pattern at an ABCD completion point (black arrows) around 0.9051.
The doji suggests forces of supply and demand are possibly nearing equilibrium. Therefore, given we’re testing ABCD support, along with additional support present nearby at 0.9014, traders may interpret the recent indecision as a potential change of direction.
Areas of consideration:
While the underlying trend points southbound, weekly price recently crossing swords with an ABCD correction at 0.9051, in the shape of a long-legged doji candlestick pattern, implies additional recovery gains may surface.
Yet, many technically-minded traders will want to observe H4 resistance at 0.9161, daily resistance at 0.9187 and the 0.92 handle (H4) taken out before considering bullish strategies, targeting weekly resistance at 0.9255 as the initial call (a prior Quasimodo support).
Another scenario worth watching for is a 0.91 retest (H4), which could entice dip-buying.
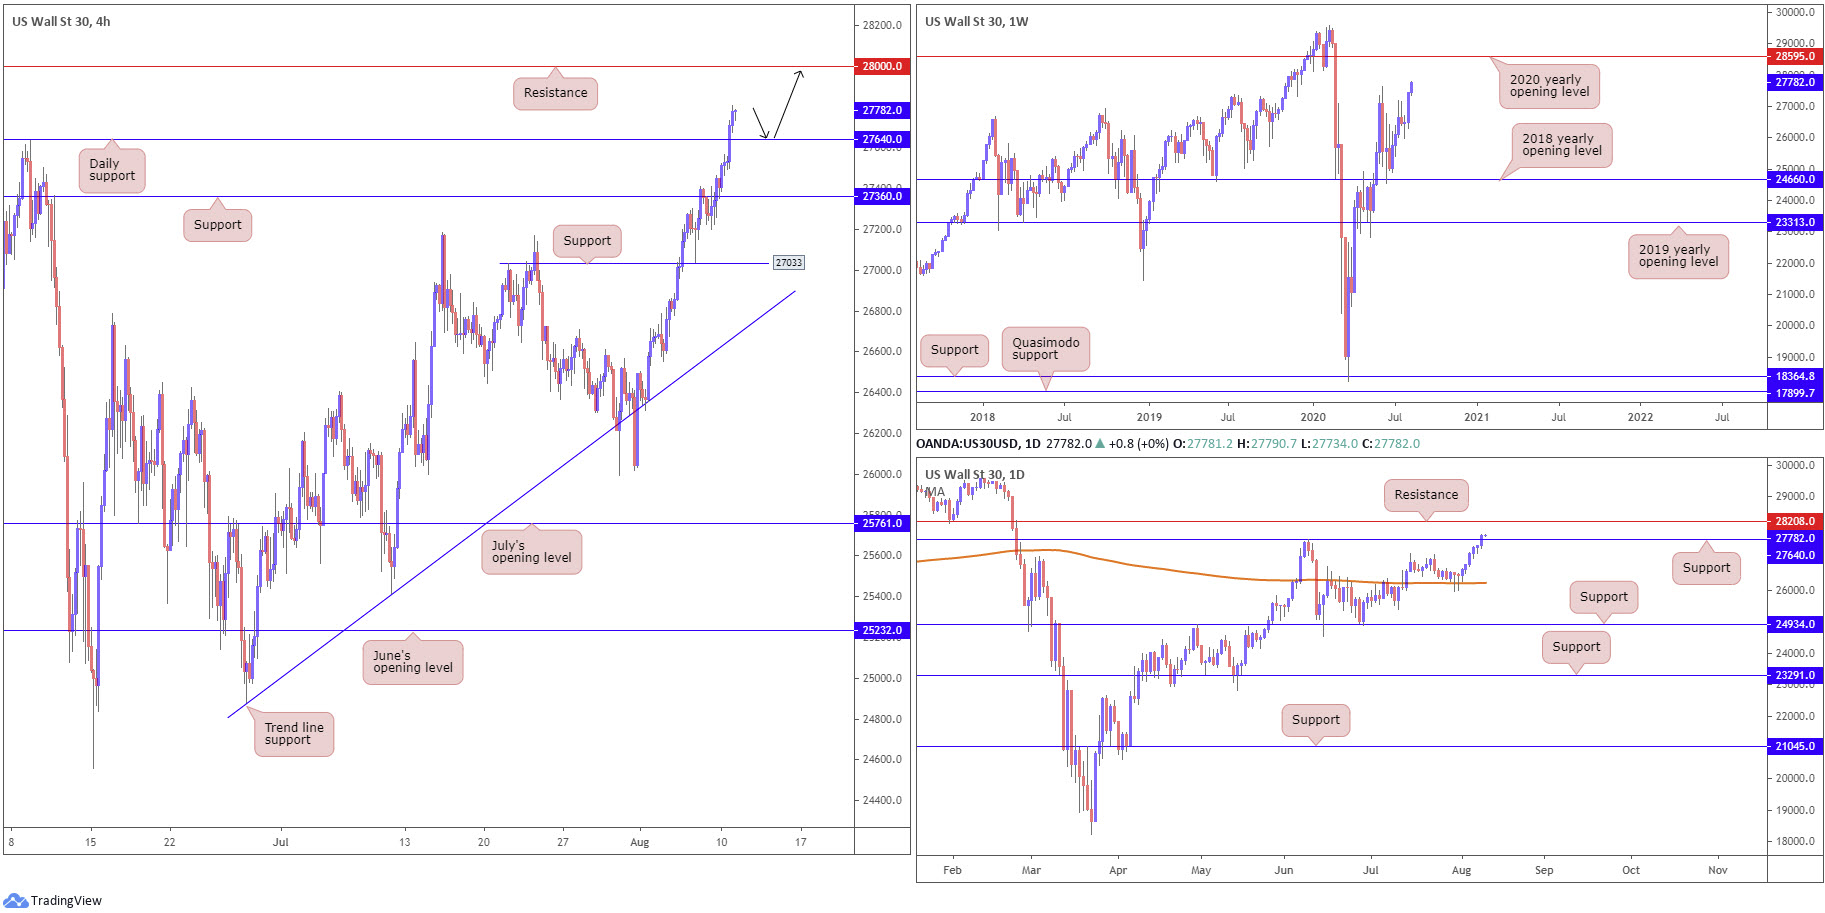
Dow Jones Industrial Average:
Major US equity benchmarks finished Monday mostly higher.
The Dow Jones Industrial Average climbed 357.96 points, or 1.30%; the S&P 500 rallied 9.19 points, or 0.27%, while the tech-heavy Nasdaq 100 concluded lower by 54.22 points, or 0.49%.
Technically, from the weekly timeframe, we recently secured ground above the 27638 high, following a mid-June retest at the 2018 yearly opening level from 24660. As we head into Tuesday, the unit is now poised to run to the 2020 yearly opening level at 28595.
After retesting the 200-day SMA (orange – 26256) on the daily timeframe, in the form of back-to-back hammer candle patterns, recent trading put up a sixth consecutive bullish candle. This placed things above resistance at 27640, with the break pulling forward another layer of resistance seen at 28208.
With H4 action making quick work of daily resistance at 27640 Monday, further buying could be on the cards today, targeting H4 resistance plotted at 28000, followed by daily resistance at 28208.
Areas of consideration:
Keeping things simple this morning – all three timeframes exhibit scope to discover higher levels today. With this being the case, the break of daily resistance at 27640 likely lured breakout buyers into the fight, while a retest of the latter today may entice conservative buyers to join in (black arrows).
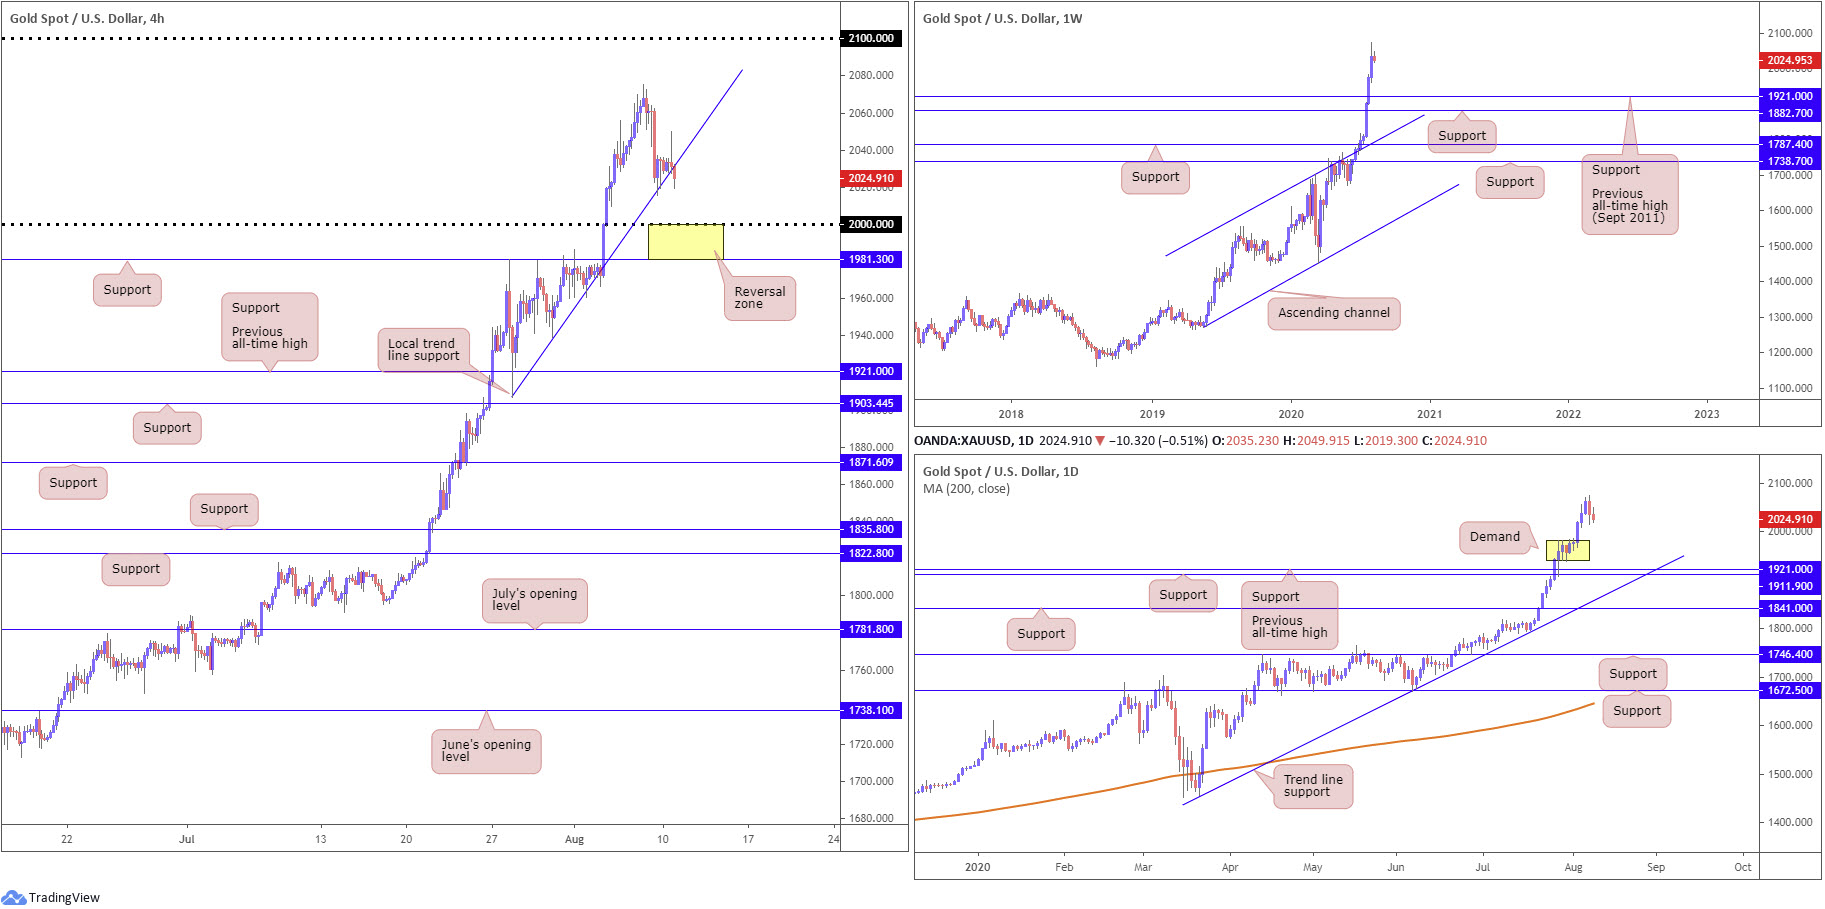
XAU/USD (GOLD):
Friday, as evident from the daily chart, snapped a five-day bullish phase, shaped by way of a reasonably dominant bearish outside candle. As the US dollar index navigated higher levels Monday, this weighed on the yellow metal, consequently extending the retracement slide south of all-time peaks at $2,075.28 per ounce.
According to the weekly timeframe, limited support is visible until as far south as $1,921.00, the previous all-time high (September 2011). A closer examination of price movement on the daily timeframe, nevertheless, reveals that in the event we continue to slip lower, the demand area marked at $1,941.10/$1,981.20 (yellow) could enter play.
Local H4 trend line support, taken from the low $1,907.06, an ascending base that entered view late Friday, recently gave way despite an earnest attempt to hold things higher. Any sustained move under this line today positions the key figure $2,000.00 back in view as potential support.
Areas of consideration:
In spite of the two-day decline, buyers still have the upper hand in this fight, given the current trend and recent upside momentum.
The break of current H4 trend line support is likely to trigger sell-stop liquidity and accelerate action towards $2,000.00 support. Traders will also acknowledge H4 could whipsaw through $2k to support at $1,981.30 support before buyers pull things higher. In view of this, traders will likely observe the range between $1,981.30/$2,000.00 (yellow) as a potential reversal zone to consider bullish scenarios.
The accuracy, completeness and timeliness of the information contained on this site cannot be guaranteed. IC Markets does not warranty, guarantee or make any representations, or assume any liability regarding financial results based on the use of the information in the site.
News, views, opinions, recommendations and other information obtained from sources outside of www.icmarkets.com.au, used in this site are believed to be reliable, but we cannot guarantee their accuracy or completeness. All such information is subject to change at any time without notice. IC Markets assumes no responsibility for the content of any linked site.
The fact that such links may exist does not indicate approval or endorsement of any material contained on any linked site. IC Markets is not liable for any harm caused by the transmission, through accessing the services or information on this site, of a computer virus, or other computer code or programming device that might be used to access, delete, damage, disable, disrupt or otherwise impede in any manner, the operation of the site or of any user’s software, hardware, data or property.


