
A note on lower timeframe confirming price action…
Waiting for lower timeframe confirmation is our main tool to confirm strength within higher timeframe zones, and has really been the key to our trading success. It takes a little time to understand the subtle nuances, however, as each trade is never the same, but once you master the rhythm so to speak, you will be saved from countless unnecessary losing trades. The following is a list of what we look for:
- A break/retest of supply or demand dependent on which way you’re trading.
- A trendline break/retest.
- Buying/selling tails/wicks – essentially we look for a cluster of very obvious spikes off of lower timeframe support and resistance levels within the higher timeframe zone.
- Candlestick patterns. We tend to only stick with pin bars and engulfing bars as these have proven to be the most effective.
For us, lower timeframe confirmation starts on the M15 and finishes up on the H1, since most of our higher timeframe areas begin with the H4. Stops usually placed 5-10 pips beyond your confirming structures.
EUR/USD:
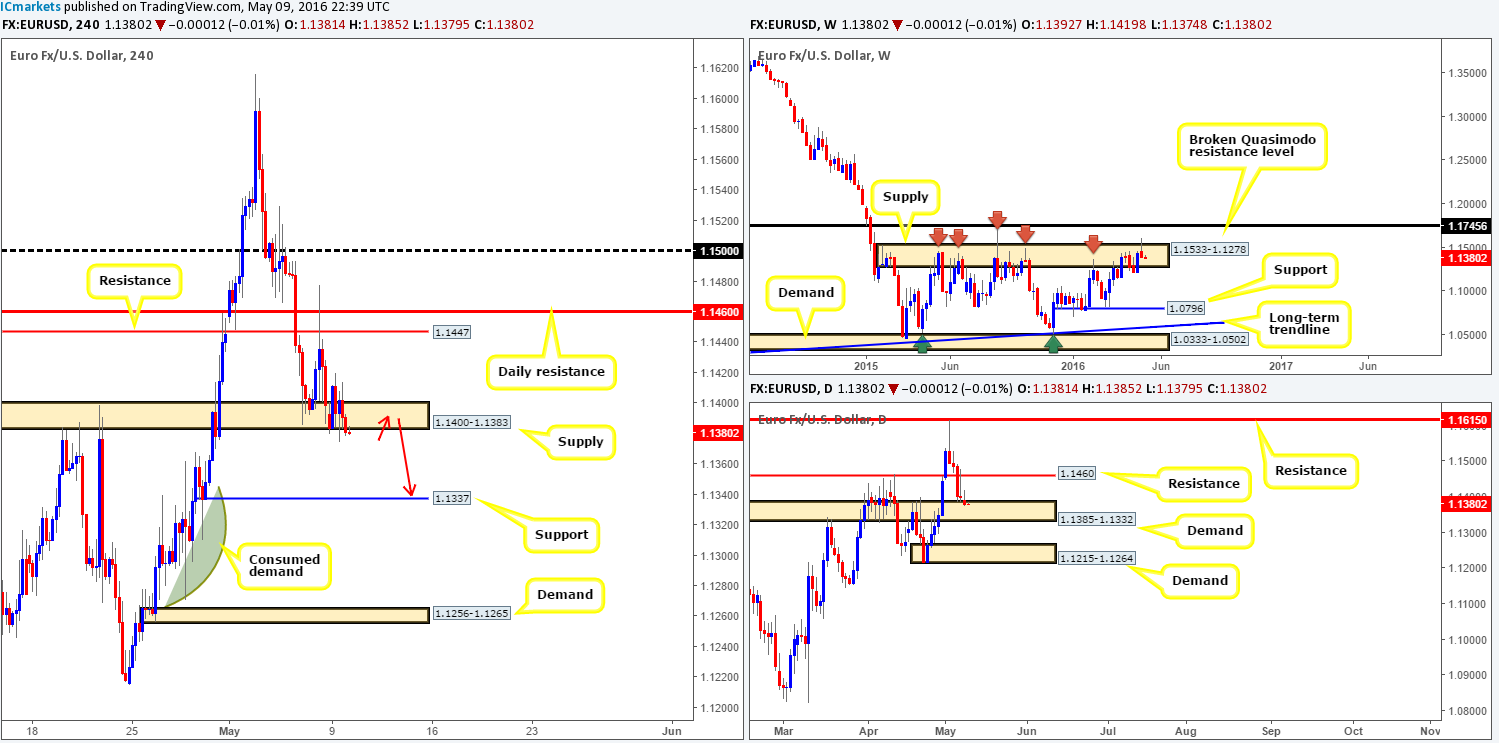
Yesterday’s sessions saw the EUR employ a more subtle approach with price ranging 45 pips all in all (1.1419/1.1374). During this time, however, H4 demand at 1.1400-1.1383 appears to have been consumed, possibly clearing the river south towards 1.1337 – a small line of H4 demand.
Now, as we mentioned in Monday’s report, weekly action formed a beautiful-looking bearish selling wick within a major area of weekly supply coming in at 1.1533-1.1278 last week. Nevertheless, before we begin looking to short this market, traders need to keep in mind that demand is currently being seen on the daily chart at 1.1385-1.1332.
In view of the points above, our thinking remains the same as in Monday’s report. We feel weekly sellers may take over this market this week! Furthermore, seeing as how price recently closed below the current H4 demand zone, our team is now in a place to begin hunting for shorting opportunities on any confirmed retest that may be seen at this area as supply (for confirmation techniques, please see the top of this report). The next downside target from here, as we already highlighted above, is 1.1337 – the small line of H4 demand. This would be our first take-profit target. Beyond this barrier, however, we have our eye on the small H4 demand chalked up at 1.1256-1.1265 (conveniently sits within daily demand at 1.1215-1.1264 – the next area of value beyond the current daily demand), as in between here resembles what we believe to be demand consumption (green arc).
Levels to watch/live orders:
- Buys: Flat (Stop loss: N/A).
- Sells: 1.1400-1.1383 [Tentative – confirmation required] (Stop loss: dependent on where one confirms this area).
GBP/USD:
For traders who read our previous report on Cable (see link below) you may recall us mentioning to keep a tab on the 1.4400 handle for possible buying opportunities due to the following confluence:
- Clear H4 trendline convergence from lows of 1.4005.
- 78.6% H4 Fibonacci support at 1.4399.
- Strong-looking demand coming in from the daily timeframe at 1.4297-1.4393.
The only downside of course was the fact that weekly sellers recently chalked up a bearish engulfing candle off the back of a broken weekly Quasimodo resistance line fixed at 1.4633. Well done to any of our readers who took part in this bullish move as price hit the first take-profit zone (H4 supply at 1.4462-1.4501) relatively quickly!
As a result of price tagging the above said H4 supply and also its converging daily resistance line at 1.4470 yesterday, 1.4400 may struggle to hold firm today considering the weekly picture (see above). That being the case, if the pound closes below 1.4400 and retests the underside of this barrier as resistance, selling this market down to the 1.4300 hurdle could be something to consider. Yes, by doing so you would effectively be shorting into daily demand, but let’s not forget that supporting this trade is that large weekly bearish engulfing candle (see above). However, to be on the safe side, we would recommend only pulling the trigger here should one be able to spot a nice-looking lower timeframe sell setup (for confirmation techniques, please see the top of this report) following the retest of 1.4400, since fakeouts are common around fixed psychological numbers such as these!

Levels to watch/live orders:
- Buys: Flat (Stop loss: N/A).
- Sells: Watch for price to close below 1.4400 and look to trade any retest seen thereafter (lower timeframe confirmation required).
AUD/USD:
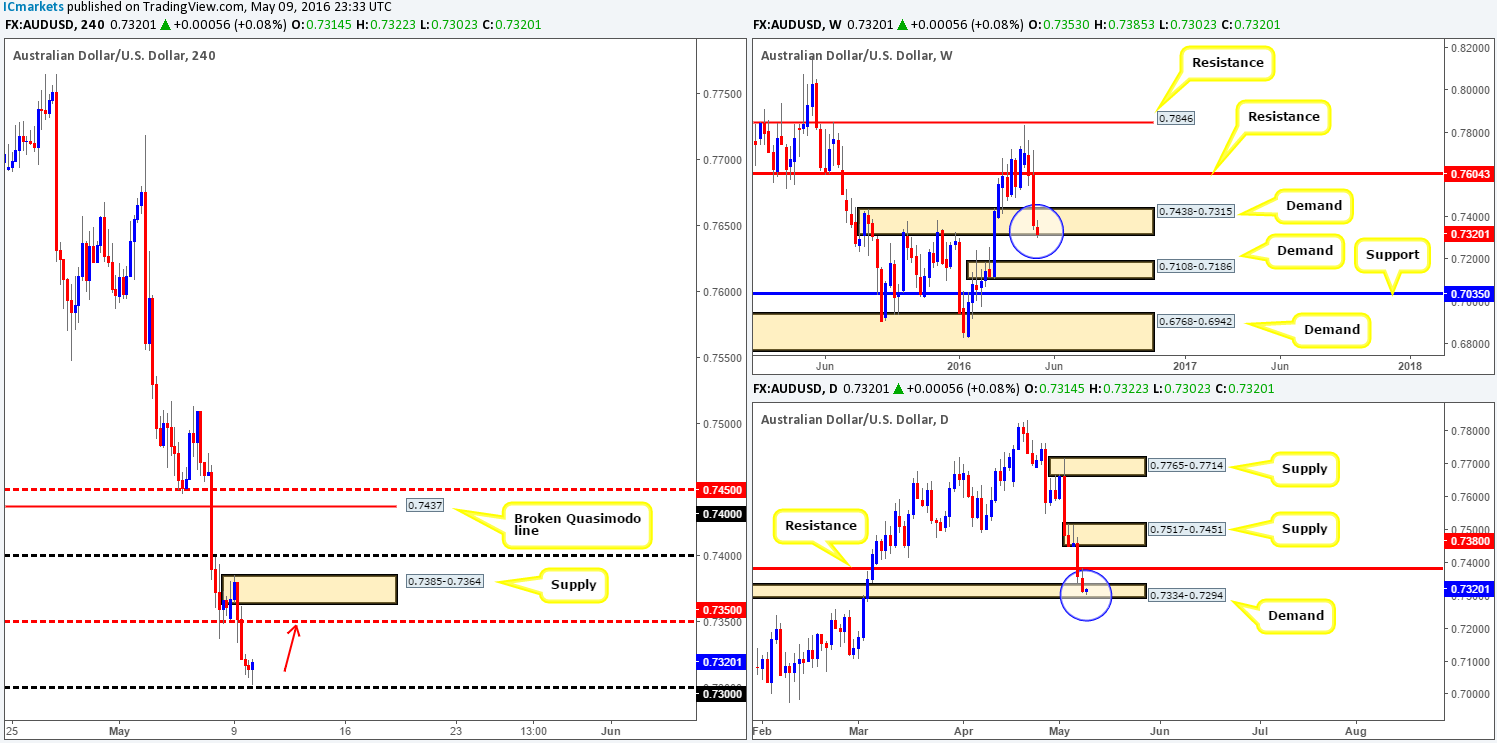
Using a top/down approach this morning, we can see that the commodity currency recently posted a fresh break beyond weekly demand at 0.7438-0.7315. Now, before we ring the bearish bells, it may be worth waiting for the weekly candle to close before presuming this area to be consumed. Further down the line, yesterday’s daily action retested daily resistance at 0.7380 and plunged into the jaws of a daily demand penciled in at 0.7334-0.7294, which for now is holding firm.
Stepping across to the H4 chart, the Aussie appears to have found support just ahead of the psychological boundary 0.7300. Due to this unit trading within both weekly and daily demand areas right now (see above), we feel price has the potential to advance up to at least the H4 mid-way resistance 0.7350, followed closely by H4 supply at 0.7385-0.7364 (surrounds the aforementioned daily resistance line). That being the case, our prime focus today will be on looking for lower timeframe buy entries around current price. In regards to finding an entry technique, this could be in the form of an engulf of supply and subsequent retest, a break/retest of a trendline or simply a collection of buying tails around a lower-timeframe support hurdle.
Levels to watch/live orders:
- Buys: 0.7300 region [Tentative – confirmation required] (Stop loss: dependent on where one confirms this area).
- Sells: Flat (Stop loss: N/A).
USD/JPY:
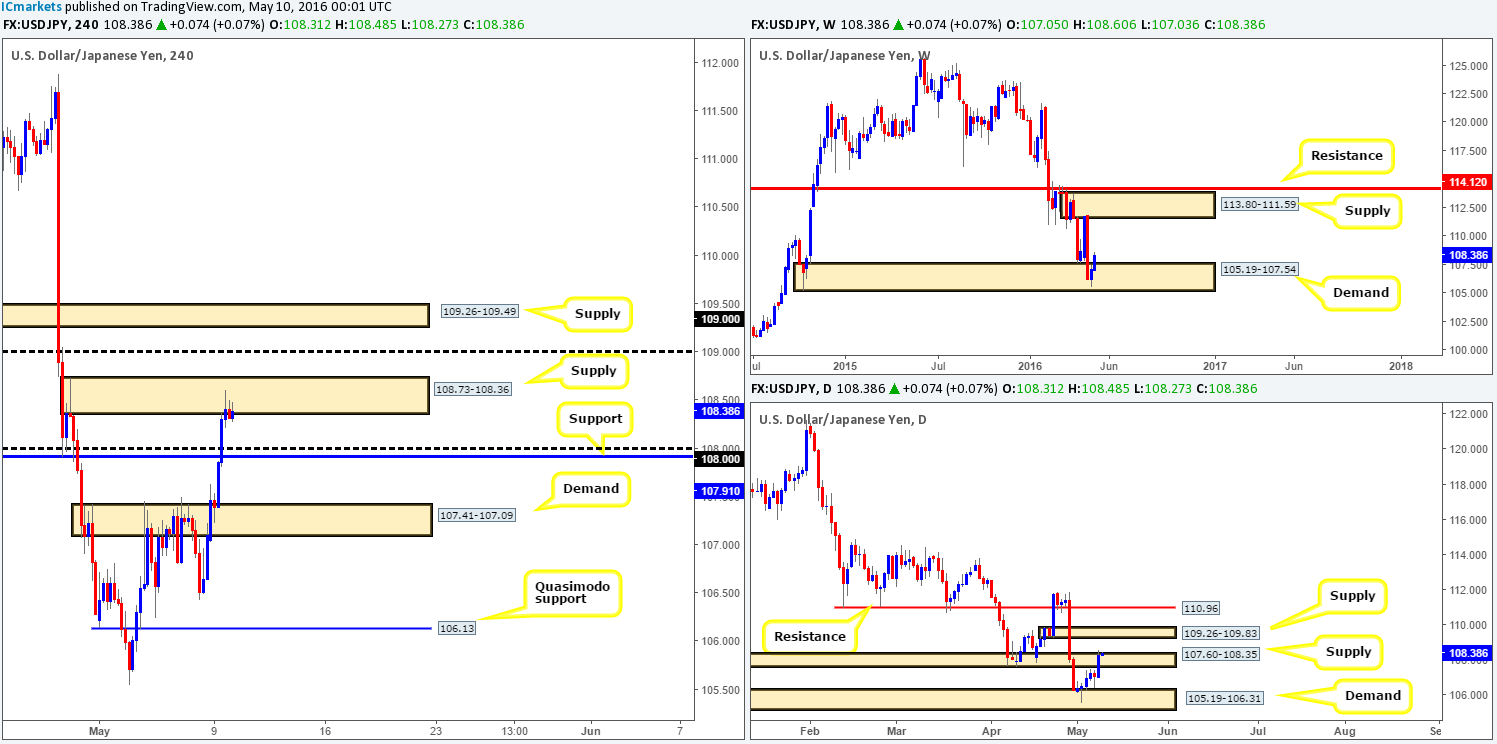
Following the week’s open 107.05, the USD/JPY rallied over 100 pips on the day. This, as can be seen from the H4 chart, ended with price connecting with H4 supply at 108.73-108.36 going into yesterday’s American session. Given the H4 selling wicks seen around this zone, there’s a possibility the pair could pull back to retest the recently broken H4 resistance line at 107.91 sometime today. Is this a high-probability short trade? Well, for us personally, we will not be shorting here for the following reasons:
- The room for profit is around thirty or so pips to the first take-profit target – the 108.08 handle.
- Bids currently look strong from weekly demand at 105.19-107.54 with room seen to advance all the way up to weekly supply drawn from 113.80-111.59.
- Yesterday’s rally saw daily price breach daily supply at 107.60-108.35, which could have possibly opened the floodgates to a move towards daily supply coming in at 109.26-109.83.
In regards to buying this market, which would be the more logical route to take considering the higher-timeframe picture (see above), we see little room to maneuver beyond the current H4 supply. Directly above sits 109.00, followed closely by H4 supply at 109.26-109.49 which represents the underside of daily supply at 109.26-109.83!
Therefore, opting to stand on the sidelines here may very well be the best path to take for now.
Levels to watch/live orders:
- Buys: Flat (Stop loss: N/A).
- Sells: Flat (Stop loss: N/A).
USD/CAD:
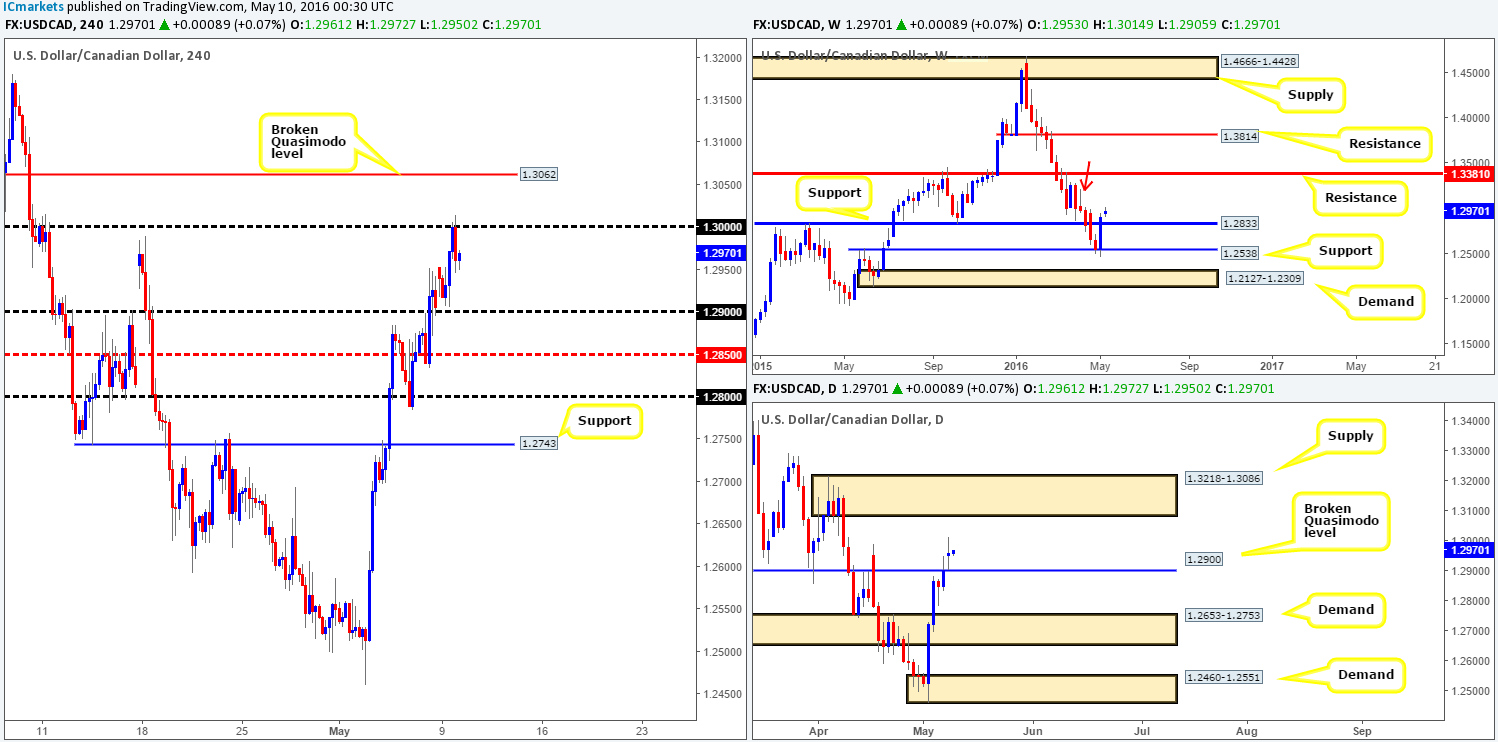
Mid-way through yesterday’s London session the USD/CAD came alive, bidding itself up to the large psychological resistance 1.3000 which has held firm since. In view of Oil now trading just ahead of H4 demand coming in at 42.48-43.07, the sell-off from 1.3000 could be a short-lived one! Not only this, but we also have to take into account what the higher-timeframe picture is showing. Over on the weekly chart, price remains trading above support drawn from 1.2833. If the bull-side of this market continues to dominate, further upside could be seen towards resistance at 1.3381. There is some supply seen in between these two areas, but not really something that could hamper further buying in our opinion. The reason being simply comes down to the supply consumption wick seen marked with a red arrow at 1.3218. From the daily chart, however, an indecision candle formed during yesterday’s session directly above a broken daily Quasimodo level (support) at 1.2900. The next upside target in view from here can be seen around a sturdy-looking supply zone at 1.3218-1.3086.
Therefore, given our notes our team is looking for 1.3000 to break today. Should this come to fruition, it’s likely the Loonie is then heading up to 1.3062 – a broken Quasimodo line (resistance). If price retests 1.3000 together with some form of lower timeframe buy signal, a long from number is high probability in our opinion (for confirmation techniques, please see the top of this report).
Levels to watch/live orders:
- Buys: Watch for price to close above 1.3000 and look to trade any retest seen thereafter (lower timeframe confirmation required).
- Sells: Flat (Stop loss: N/A).
USD/CHF:
In recent trading, the Swissy sold-off from highs of 0.9735 in the early hours of yesterday’s session, forcing price to whipsaw through the 0.9700 handle. Leaving the H4 chart for the minute and moving over to the higher timeframes, we can see the following:
- From the weekly chart, an awesome rebound was recently seen from weekly support penciled in at 0.9508. Subject to bids remaining strong here, we see little overhead resistance until supply formed at 1.0092-0.9928.
- Down on the daily chart, this pair is now trading within shooting distance of a supply zone carved from 0.9787-0.9755. As such, the upside potential seen on the weekly chart may begin to suffer if price connects with this zone!
Moving back to the H4 chart, if H4 supply marked with a red arrow at 0.9735-0.9718 is spiked today and price retests the 0.9700 boundary and holds, longs could be a possibility. Our rationale behind this approach comes from seeing little active supply above the current H4 supply (supply consumption wicks [1-2] 0.9753/0.9766) until H4 supply coming in at 0.9796-0.9781 (positioned within the extremes of the daily supply mentioned above at 0.9787-0.9755). In the event that the above scenario in bold plays out, we would, dependent on the time of day, enter long at market from 0.9700.
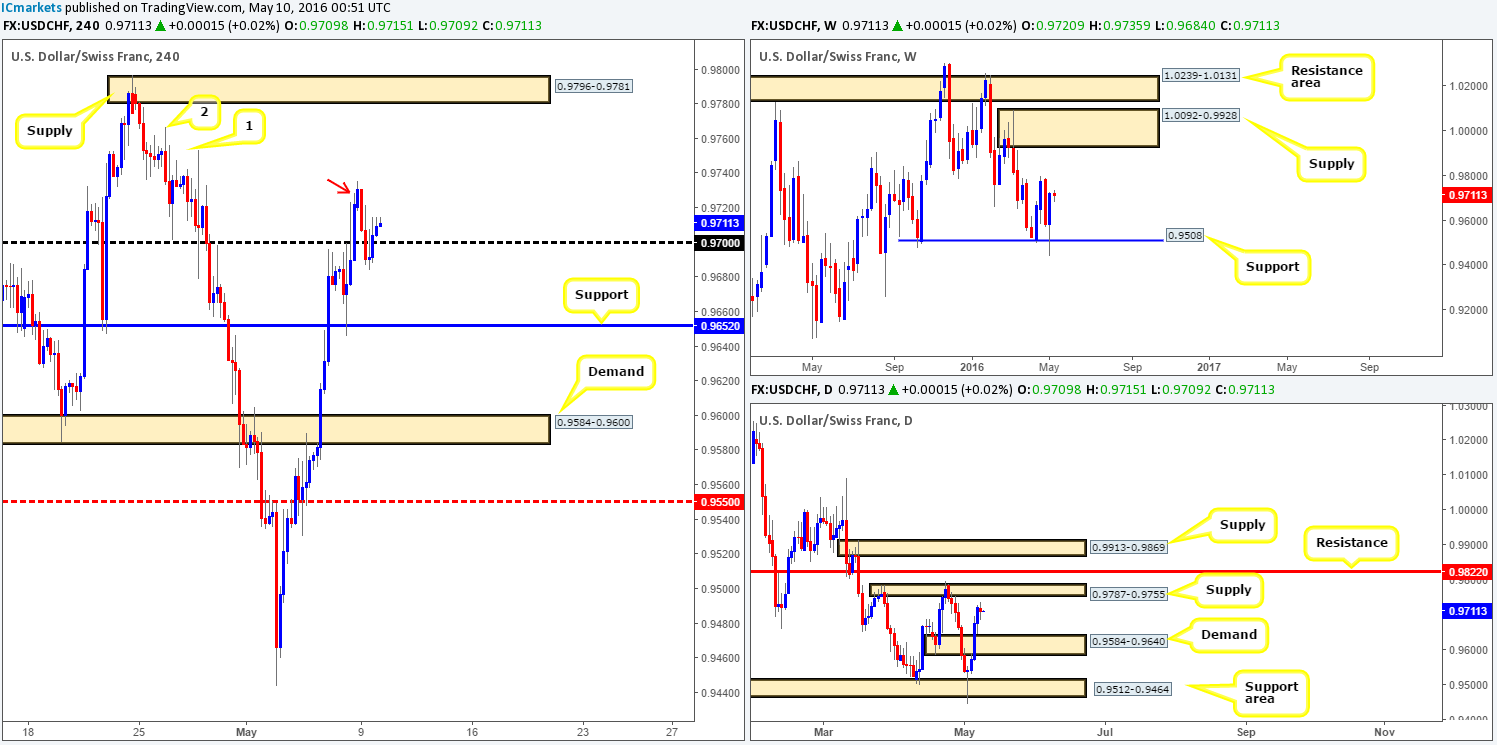
Levels to watch/live orders:
- Buys: 0.9700 region could, if the overhead H4 supply at 0.9735-0.9718 is consumed, be a nice level to enter long from at market
- Sells: Flat (Stop loss: N/A).
DOW 30:
U.S stocks ended the day down around 80 points from highs of 17794. Our long trade taken from 17576 on Friday still has 30% of its remaining position left in the market with the stop-loss order set at breakeven. The reason behind leaving 30% in the market here was simply because weekly action bounced from weekly support at 17606, and daily price shows room for the DOW to advance up to daily resistance chalked in at 17894.
Right now, we see very little opportunity to trade this unit. Nevertheless, should price rally as the higher timeframes suggest, the index could very well connect with H4 resistance at 17920 (green circle) very soon. This level not only boasts relatively strong H4 confluence, it also sits directly above the daily resistance level at 17894. Jumping in short at market from here would be a risky play in our book since price would be coming from weekly support (see above), so lower timeframe confirmation is required in order for us to short here!
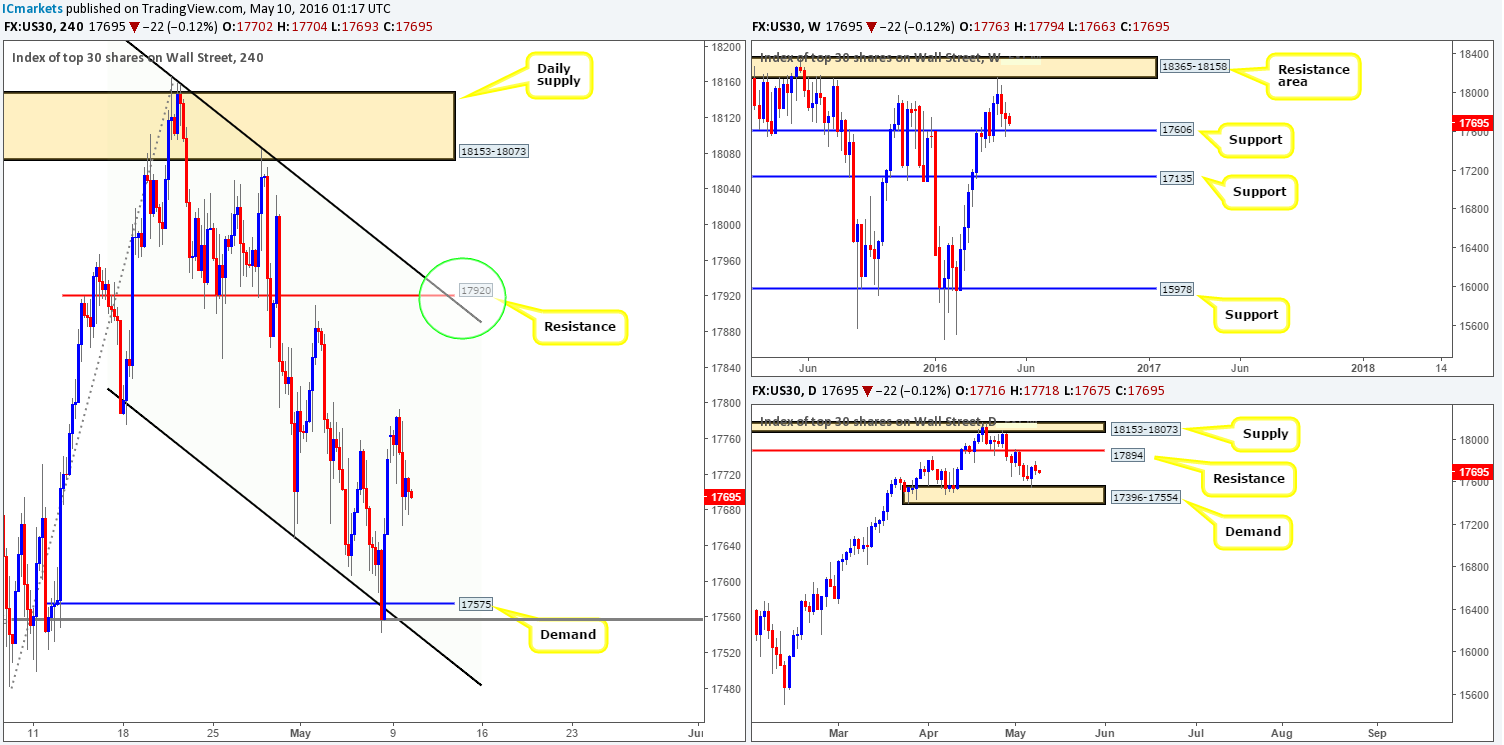
Levels to watch/live orders:
- Buys: 17576 [LIVE] (Stop loss: Breakeven).
- Sells: 17920 region [Tentative – confirmation required] (Stop loss: dependent on where one confirms this area).
GOLD:
Gold took an absolute clobbering yesterday on the back of a stronger dollar, losing just under $25 dollars on the day! Through the simple lens of a technical trader who analyses multiple timeframes, this sell-off should not have really come as much of a surprise. Up on the weekly chart, the yellow metal was housed within weekly supply carved from 1307.4-1280.0.
Standing in the way of a continuation move south, however, we see daily price now trading within daily demand at 1270.8-1257.5 and H4 price lurking just above H4 demand at 1252.9-1256.8 (sits just below daily demand).
Therefore, we will not be considering shorts until the aforementioned H4 demand is taken out! In addition to this, we feel buying this market in the face of the recent sell-off from the above said weekly supply is a risky play despite what the H4 and daily timeframes show. With that in mind, we’ll remain on the sidelines for now and wait for further developments.
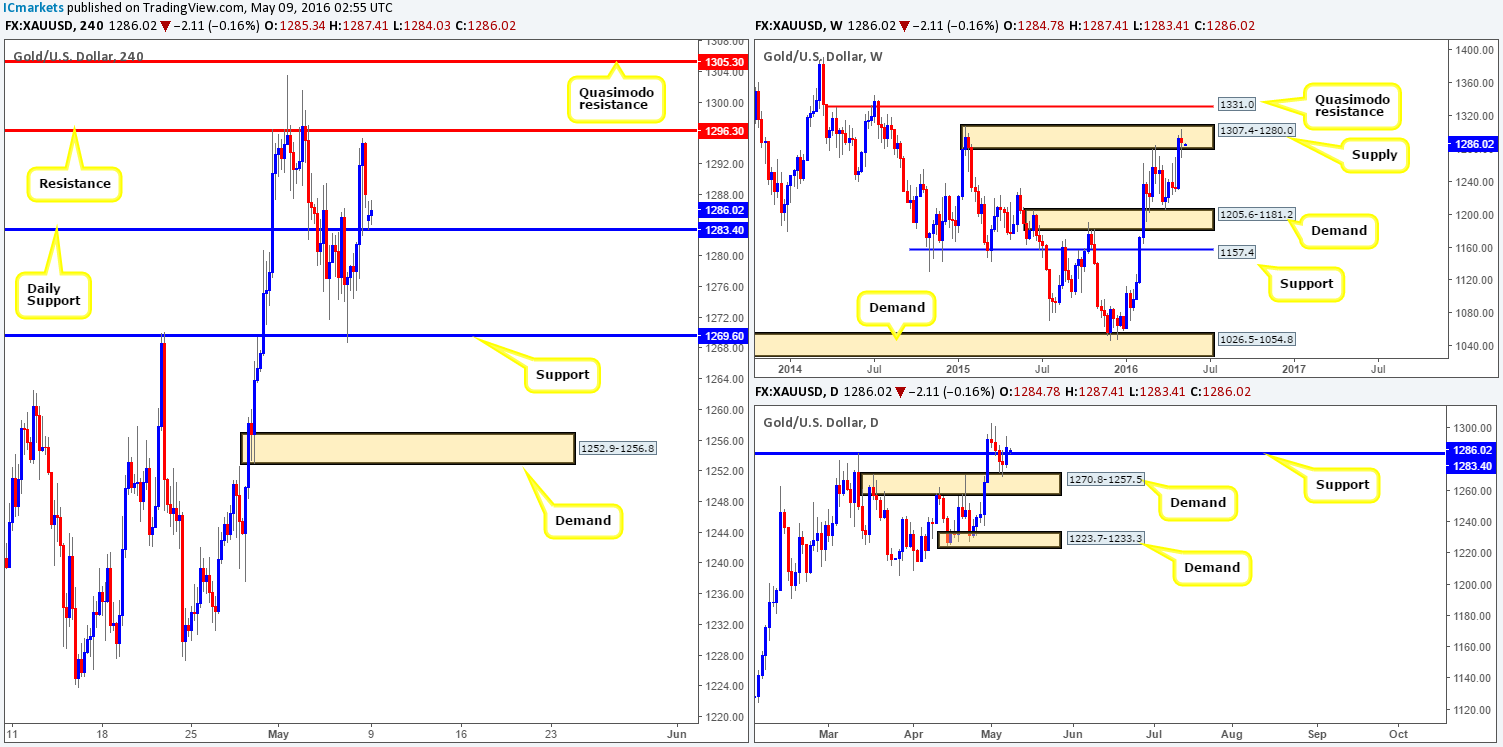
Levels to watch/live orders:
- Buys: Flat (Stop loss: N/A).
- Sells: Flat (Stop loss: N/A).


