
EUR/USD:
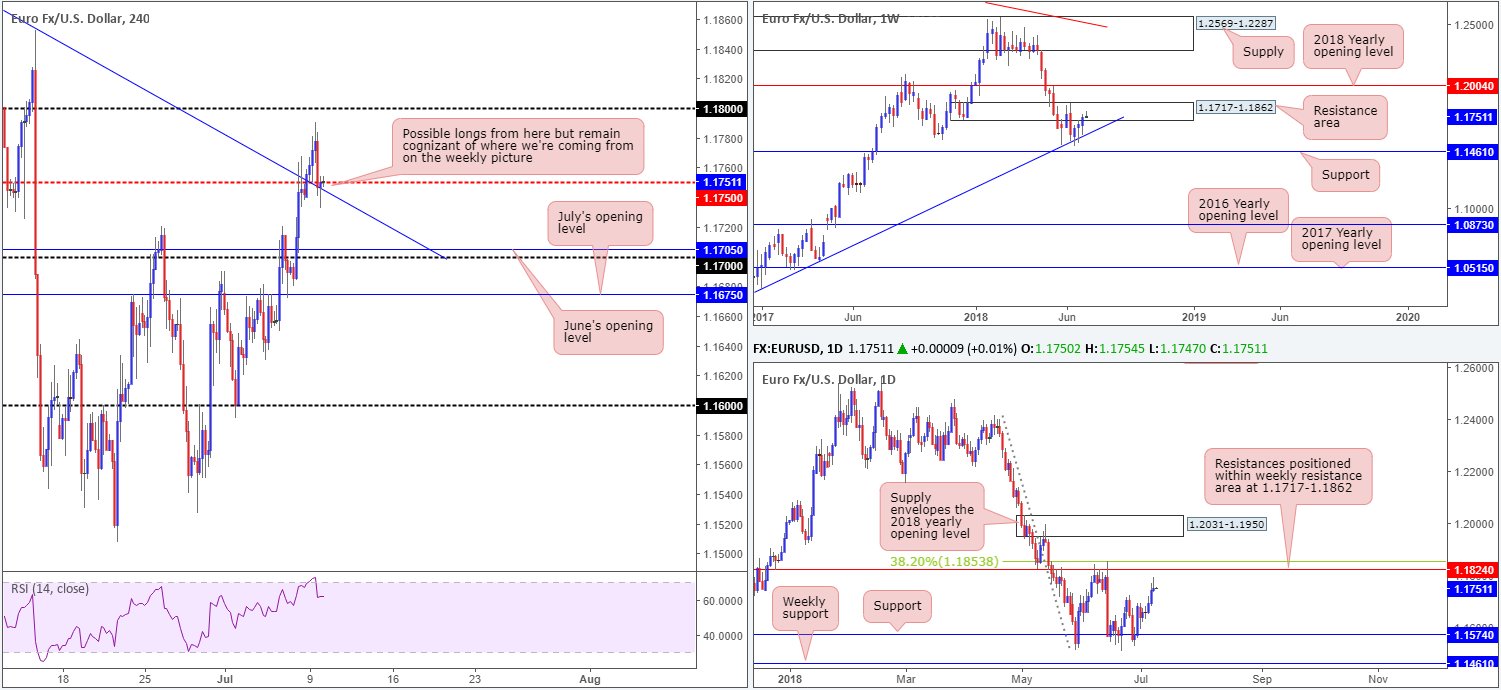
EUR/USD bulls went on the offensive in early trade on Monday, looking to build on Friday’s NFP-induced gains. Despite this, the pair failed to sustain upside and topped just south of the 1.18 handle seen on the H4 timeframe (1.1790). Following the GBP lower on political tensions, the shared currency reconnected with H4 mid-level support at 1.1750 and a nearby converging H4 trend line resistance-turned support taken from the high 1.1996.
The story over on the bigger picture reveals weekly price remains trading within the walls of a resistance area parked at 1.1717-1.1862. A closer look at price action on the daily timeframe, though, reports that despite yesterday’s action chalking up a bearish pin-bar formation, there’s a clear path north on this scale until resistance plotted at 1.1824, shadowed closely by a 38.2% Fib resistance at 1.1853. As marked on the chart, these barriers are also situated within the walls of the aforementioned weekly resistance zone.
Areas of consideration:
A long from 1.1750 on the H4 timeframe could be something to consider today. Not only is it bolstered by a H4 trend line support, let’s remember daily movement also shows room to press as high as 1.1824. The only grumble, of course, is the current weekly resistance area. Because of this, it might be an idea to wait and see if H4 price can pencil in a full or near-full-bodied bull candle off 1.1750, before pulling the trigger. Stop-loss orders are best placed beyond the rejecting candle’s tail, with the ultimate target set around the 1.1824 mark.
Today’s data points: German ZEW economic sentiment.
GBP/USD:
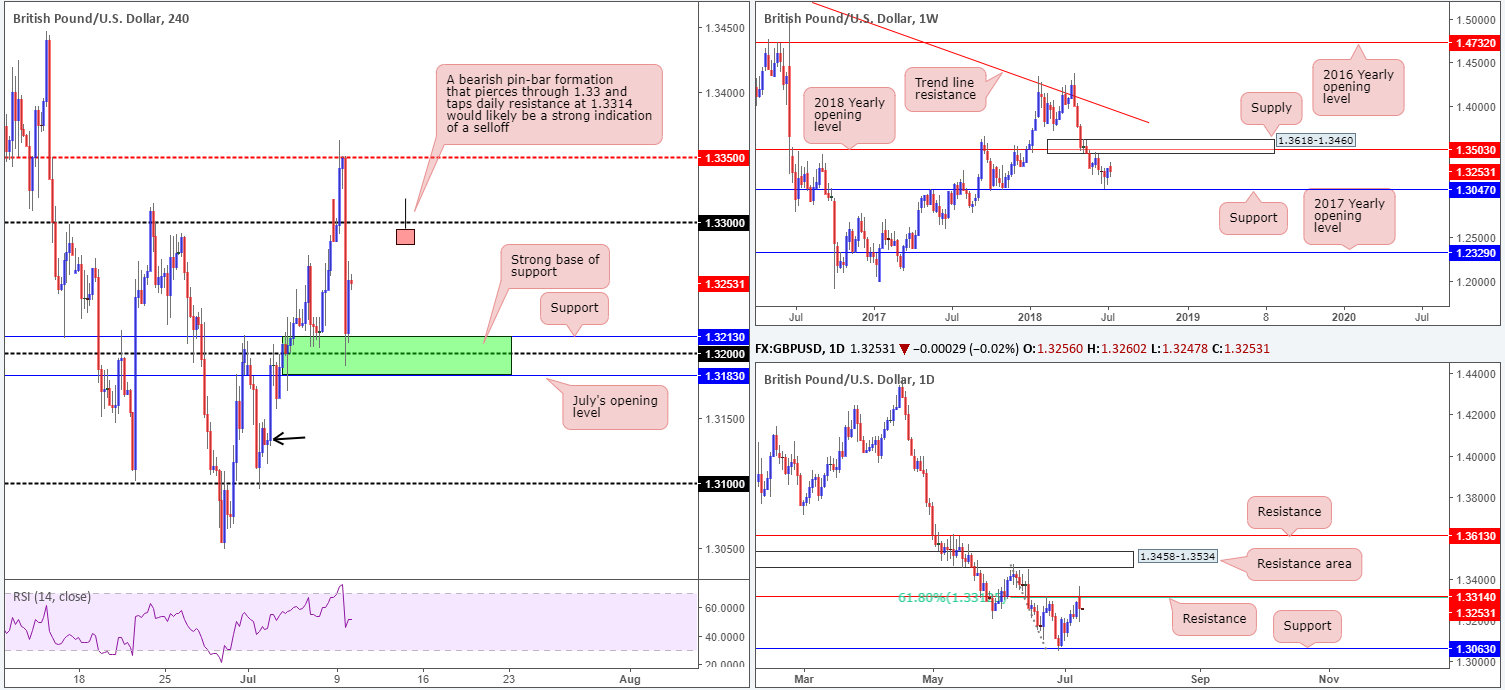
The British pound, as you can see, started the week off on a high note. News that David Davis quit as Brexit Secretary saw the currency gain on a ‘softer Brexit’ theme. Things, however, took a turn for the worse later in the day as Boris Johnson quit as Foreign Secretary, swiftly pulling the GBP to a H4 support area marked in green at 1.3183/1.3213 (comprised of July’s opening level, a round number and H4 support).
Supporting a downside move is daily resistance planted at 1.3314. Since mid-Oct 2017, this level has provided strong support/resistance on numerous occasions so it is not a base one should overlook! Further adding to this level’s appeal, note the 61.8% Fib resistance value at 1.3312.
Areas of consideration:
A retest of the noted (green) H4 support area at 1.3183/1.3213 is a likely scenario we feel, as markets look to digest Boris Johnson’s resignation. A break beyond this area (highly likely should daily sellers continue to press lower) has the H4 demand base marked with a black arrow at 1.3114-1.3138 to target. Though, given the 1.31 handle is located a few pips beneath this area, we’re likely witness a fakeout below this demand.
The idea of shorting below the green H4 zone is appealing, but may not come about today. However, it is still something to have penciled in on your watchlist.
In addition to this, keep eyeballs on the 1.33 handle. A truckload of buyers’ stops were tripped here, thus unfilled order may remain on those who attempted to short the move. An ideal sell setup here would be for H4 price to chalk up a bearish pin-bar formation that pierces through the underside of 1.33 and taps daily resistance mentioned above at 1.3314 (for a visual representation, see the H4 chart).
Today’s data points: UK GDP m/m; UK manufacturing production m/m and Goods trade balance.
AUD/USD:
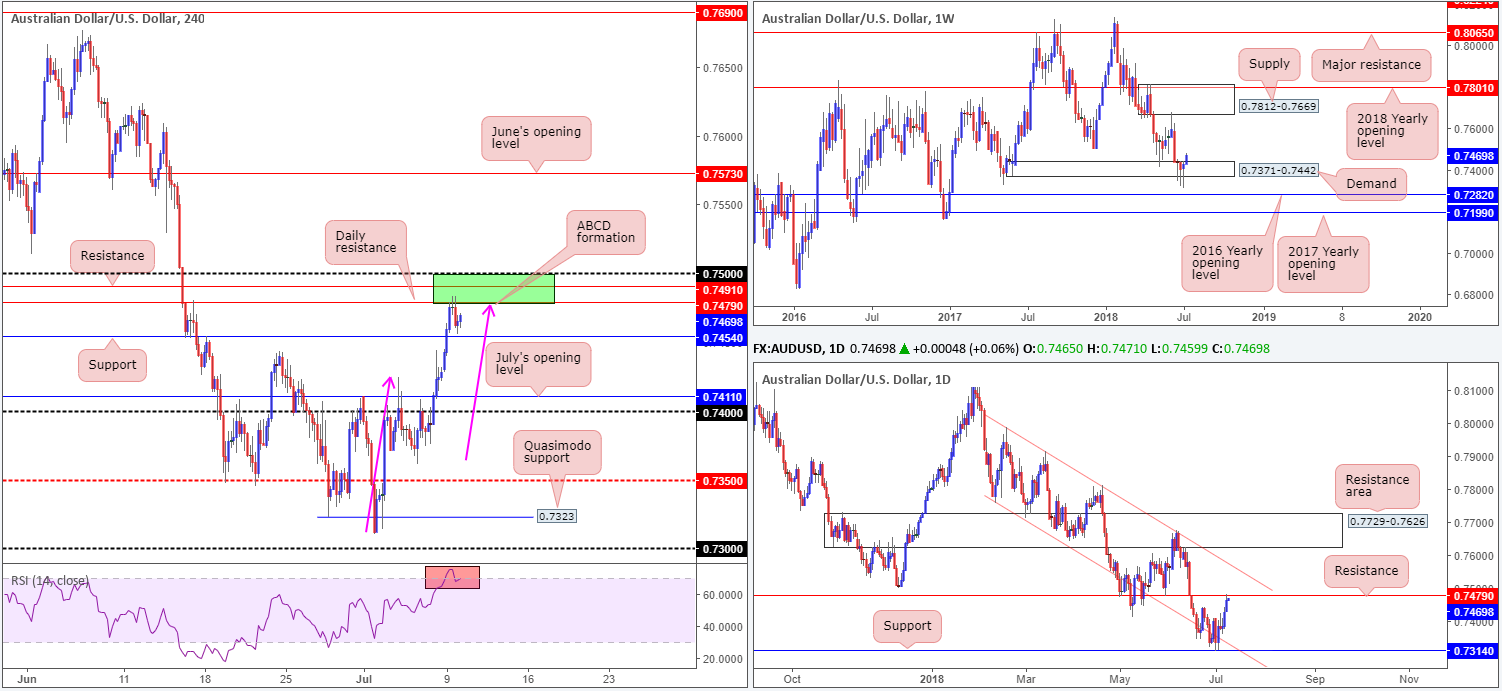
For folks who read Monday’s report you may recall the team highlighted the 0.75/0.7479 (green) area as a possible sell zone (comprised of an ABCD [pink arrows] completion point, daily and H4 resistance levels and the 0.75 handle – also note H4 RSI is registering an overbought reading). As you can see, the area held nicely in recent trade, though the H4 candles are struggling to extend lower, bottoming just north of H4 support at 0.7454. In view of this, the possibility of a second test of 0.75/0.7479 is likely today.
Areas of consideration:
Longer term, it’s a struggle to get excited about buying this market with daily resistance seen in play at 0.7479. In addition to this, the incessant breaking of weekly demand at 0.7371-0.7442 lends little confidence.
Intraday, the green H4 zone marked between 0.75/0.7479 remains in focus. Given this will be the areas second visit, we’re expecting a push higher into the zone this time, or perhaps even a marginal fakeout above the top edge of the area. We all know psychological numbers (0.75) are prone to fakeouts!
To be on the safe side, waiting for a H4 reversal candle to form (full or near-full-bodied) is advised before pulling the trigger, as this will likely help avoid being taken out on a fakeout through 0.75. As usual, stops are best placed above the rejection candle’s wick. In regard to take-profit levels, the nearby H4 support at 0.7454 is a reasonable (initial) target. Ultimately, though, traders will want to see a push beyond here.
Today’s data points: Limited.
USD/JPY:
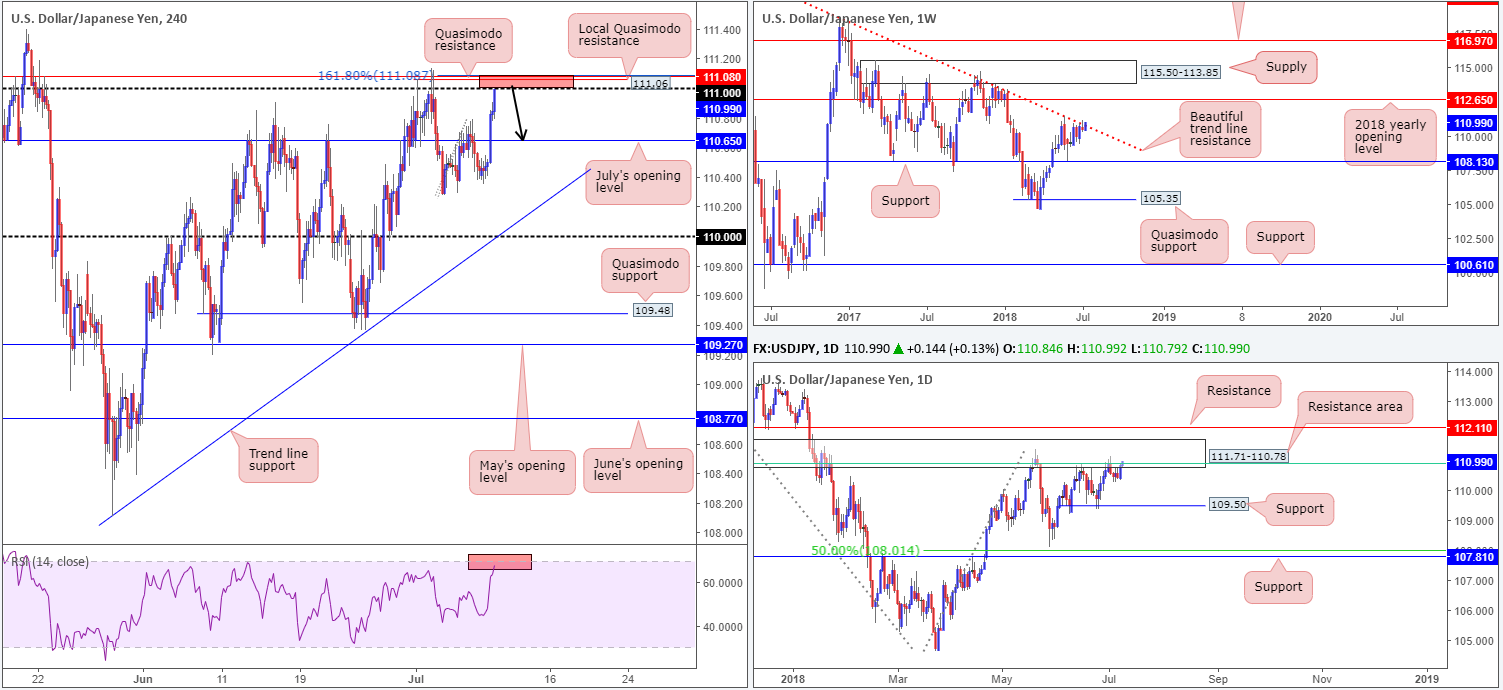
Amid a stronger US equity market and robust US Treasury yields, the USD/JPY enjoyed a relatively successful start to the week on Monday. Nudging its way through July’s opening level seen on the H4 timeframe at 110.65, traders have the 111 handle in view for a third time this month. Also on the radar this morning is the nearby H4 Quasimodo resistance levels at 111.06 and 111.08, along with a 161.8% H4 Fib ext. point at 111.08 (taken from the low 110.27), as well as the H4 RSI nearing overbought territory.
Aside from H4 structure, traders may also want to pencil in the long-term trend line resistance taken from the high 123.57 seen plotted on the weekly timeframe. Bolstering the weekly trend line resistance is a daily resistance area seen at 111.71-110.78, which happens to house a 61.8% daily Fib resistance value at 110.91 (green line – in play as we write) within its limits. Note that the next downside target on the daily scale does not come into view until we reach the 109.50ish mark.
Areas of consideration:
All three timeframes suggest further selling could be on the cards.
With that being so, the team has noted to watch for H4 price to challenge 111 (and its closely associated structures seen above – red zone) and chalk up a full or near-full-bodied bearish candle for a possible sell. Should this come to fruition, this market likely has sufficient gas to push for the 110.65 level (July’s opening base).
Today’s data points: Limited.
USD/CAD:
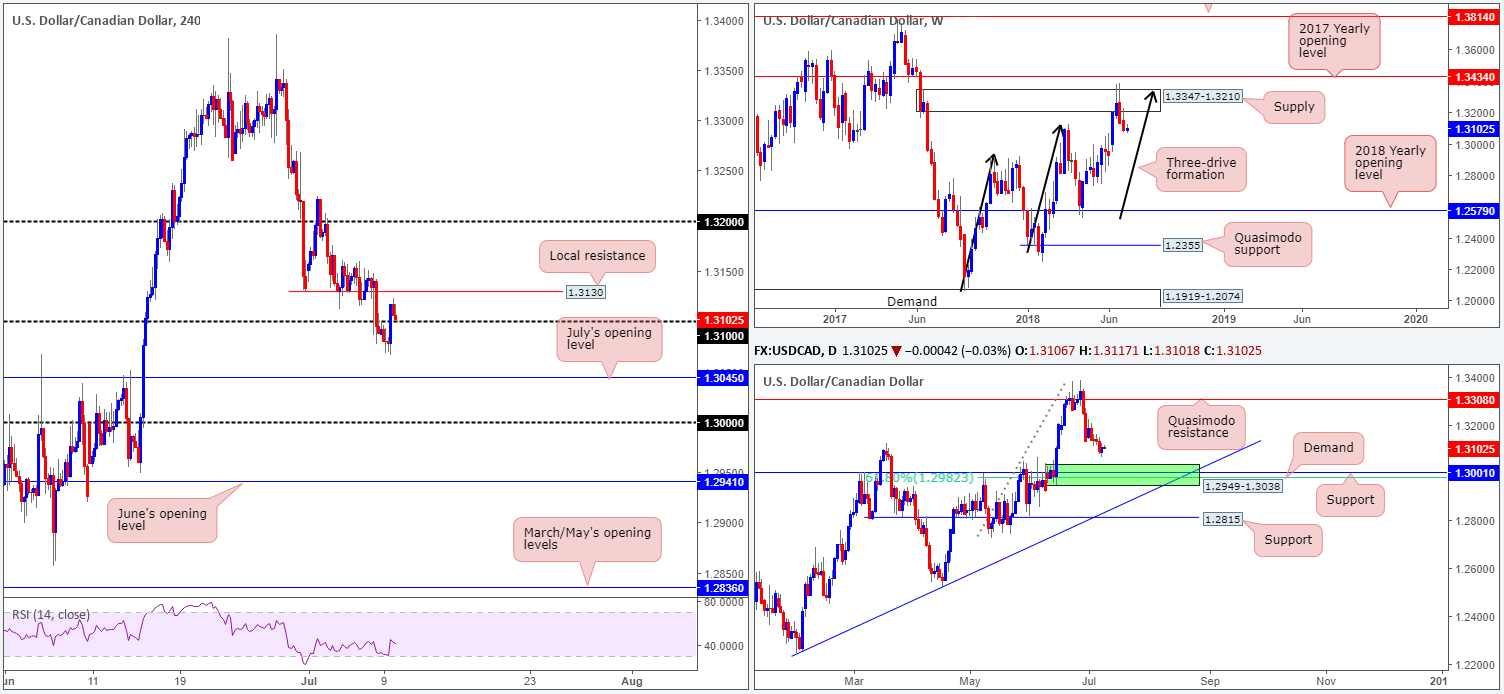
A sharp increase in US Treasury yields and a modestly bearish crude oil market allowed USD/CAD bulls to reclaim the 1.31 handle in recent trade. H4 structure shows overhead local resistance nearby at 1.3130, with a decisive push above here likely clearing the runway for a test of 1.32.
With the H4 picture in mind, let’s see where the market stands on the higher timeframes:
- Weekly price continues to air a bearish vibe, as far as we can see. After an aggressive bearish engulfing candle took shape two weeks back that whipsawed through the top edge of a supply area at 1.3347-1.3210 and completed a three-drive approach (see black arrows), we do not see much support in the firing range on this scale.
- A closer look at price action on the daily timeframe, however, reveals strong support standing at 1.3001 (history dating back to Sept 2016), followed closely by a 61.8% Fib support value at 1.2982. On top of this, we can also see demand painted in green at 1.2949-1.3038 converging with these levels! Collectively, these areas are likely to hinder downside movement this week.
Areas of consideration:
In light of where the market is trading on the bigger picture right now, the 1.31 handle on the H4 timeframe is likely to struggle as support. In fact, it would raise a few eyebrows here should H4 price notch a close above nearby resistance at 1.3130.
With that being the case, the team has, once again, noted to keep eyes on a break below 1.31. A H4 close beneath here followed up with a retest would, as far as we can see, be enough to consider shorts. July’s opening level at 1.3045 is considered the first port of call from here. A break of this level, nonetheless, will have us entering the jaws of the green daily demand highlighted above at 1.2949-1.3038. The ultimate target for shorts below 1.31, though, remains at the key 1.30 figure.
Today’s data points: Limited.
USD/CHF:
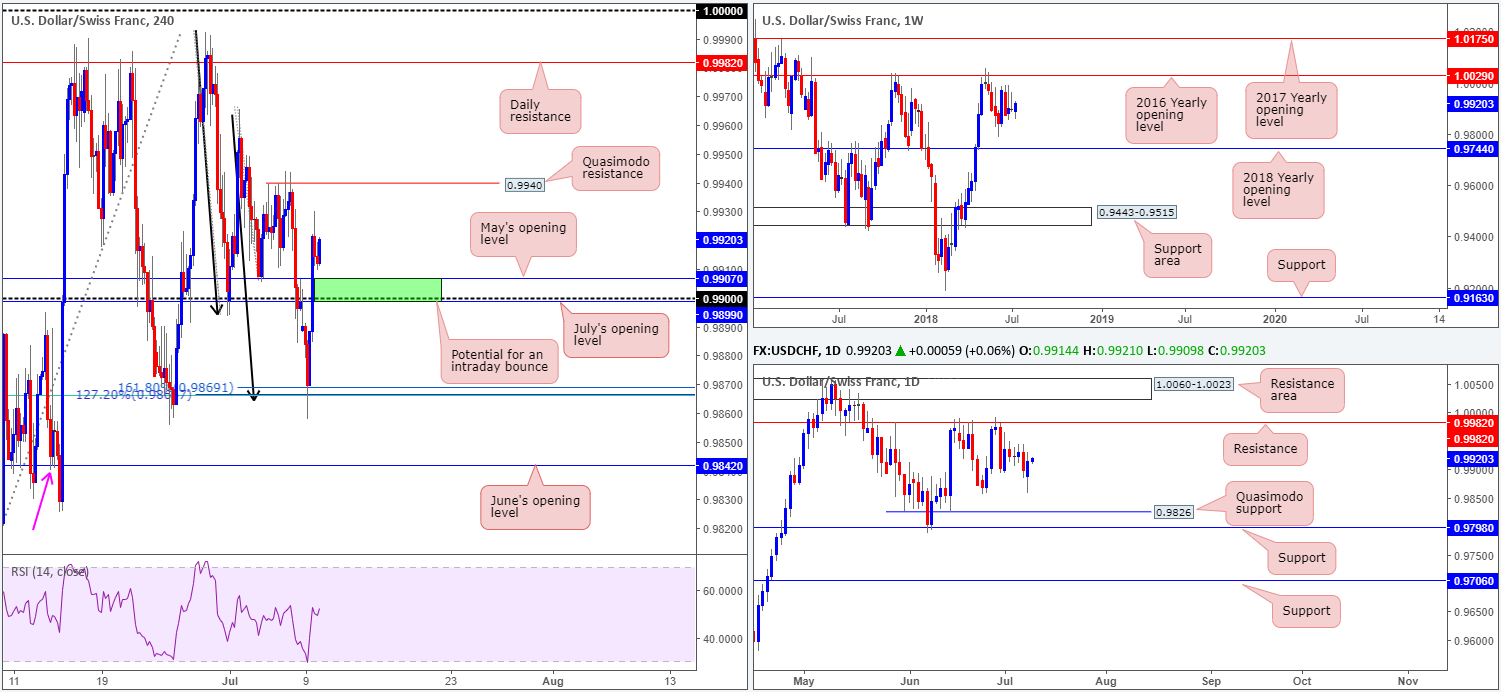
The week started on a bearish note, with H4 movement probing to lows of 0.9857. However, as highlighted in Monday’s briefing, a H4 AB=CD (black arrows) completion point was noted to come to life at around the 0.9868ish mark. We liked this price area due to the tight combination of Fibonacci levels also present here:
- 61.8% Fib support at 0.9866.
- 127.2% Fib ext. point at 0.9866.
- 161.8% Fib ext. point at 0.9869.
As you can see, price responded beautifully from this zone, with the unit going on to reclaim both the 0.99 handle and May’s opening level at 0.9907 from here.
Over on the bigger picture, weekly movement has been consolidating just south of the 2016 yearly opening level at 1.0029 for more than four weeks. To the downside, nonetheless, we have the 2018 yearly opening level at 0.9744 on the radar. Resistance at 0.9982 continues to play a key role on the daily timeframe, holding price lower on two occasions in June. In terms of supportive structure on this scale, the June 25 low at 0.9855, followed by Quasimodo support seen at 0.9826 are of interest.
Areas of consideration:
Initial thoughts are on longs from the green H4 zone between 0.9899/0.9907 (July’s opening level, 0.99 handle and May’s opening level). However, to take advantage of this area, a stop-loss size of no more than 20 pips is needed to accommodate reasonable risk/reward, as there’s a H4 Quasimodo resistance plotted nearby at 0.9940.
Aside from this, we do not see much else to hang our hat on at this time.
Today’s data points: Limited.
Dow Jones Industrial Average:
US equities began the week on solid ground, as traders/investors start pricing expectations of upbeat figures in the earnings season.
In terms of technical structure, H4 resistance at 24891 is seen just ahead of current price. Also of interest, directly above this level we see a daily resistance level plotted at 24988. A selloff from these levels could find support at either 24799 or 24649 on the H4 scale (black arrows), though attention is drawn to the H4 demand base drawn from 24529-24589 as the next downside target. The other key thing to note in this market is weekly price recently reclaimed the 2018 yearly opening level at 24660.
Areas of consideration:
The green zone marked on the H4 timeframe between 24988/24891 is an area of interest this morning. Comprised of daily and H4 resistance levels, this zone has the potential to hold price action lower, we believe. An ideal scenario – given weekly price recently crossed above the 2018 open level indicating possible bullish interest – would be for H4 price to carve out a full or near-full-bodied bearish candle from within the green zone. This, in our technical opinion, is enough to consider selling this market and targeting the H4 demand base located at 24529-24589, but keeping highs (possible support) marked with black arrows in view (24799/24649).
Today’s data points: Limited.

XAU/USD (Gold)
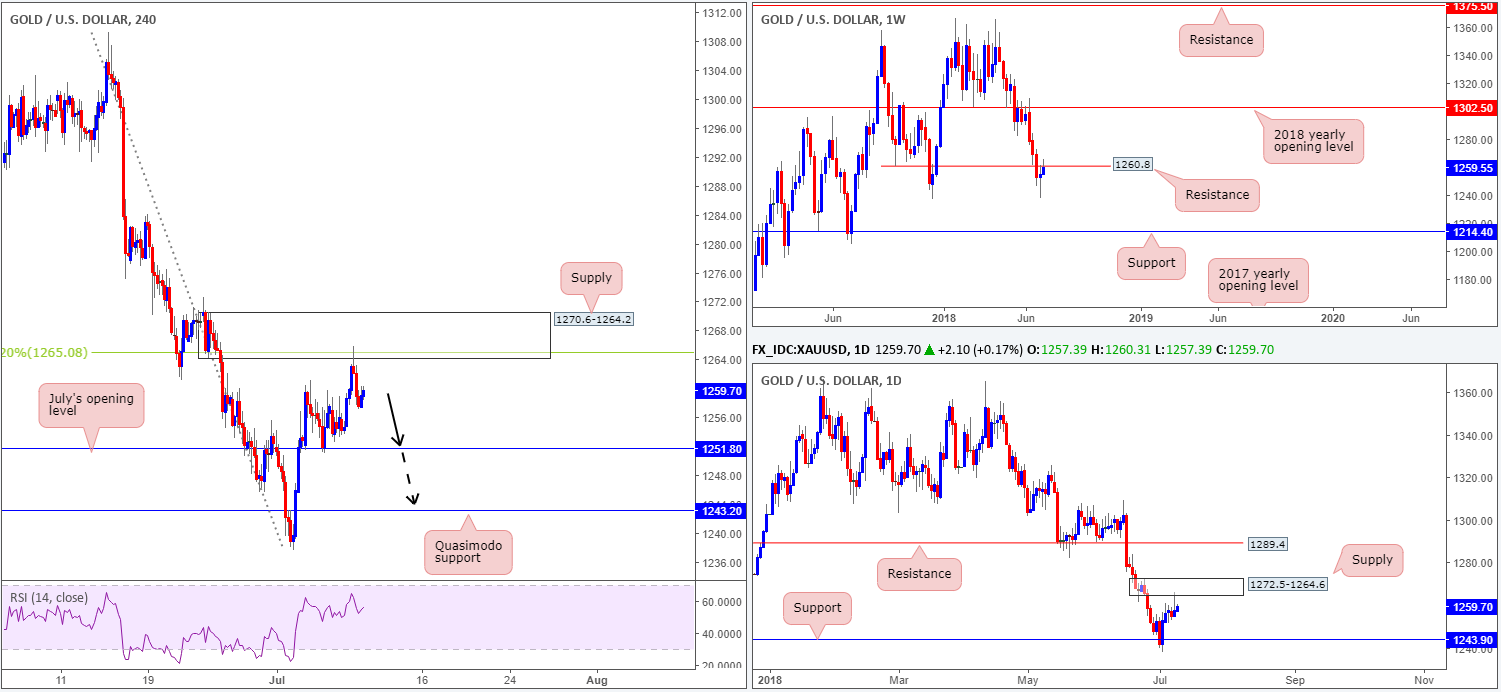
In recent sessions, the price of gold advanced against its US counterpart and crossed swords with the underside of H4 supply seen at 1270.6-1264.2. This zone was a noted base to keep eyes on in Monday’s report. We liked the area due to the following:
- Houses a 38.2% Fib resistance value at 1265.0.
- Encapsulated within daily supply at 1272.5-1264.6.
- Positioned close by a weekly resistance at 1260.8.
For those unsure of the area’s validity, additional confirmation in the form of a H4 bearish pin-bar formation was also seen. Well done to any of our readers who managed to take advantage of this move.
Areas of consideration:
According to our read, the sellers are likely going to remain in control until we shake hands with July’s opening level at 1251.8: an ideal initial take-profit target for those who are short from the aforementioned H4 supply. Beyond this level, all eyes will likely be on the H4 Quasimodo support at 1243.2 and daily support (seen just above the Quasimodo) at 1243.9.
As such, should you have missed the initial short at H4 supply, there may be a chance to get in on the action on a H4 close below and retest of 1251.8, targeting 1243.2ish.
The use of the site is agreement that the site is for informational and educational purposes only and does not constitute advice in any form in the furtherance of any trade or trading decisions.
The accuracy, completeness and timeliness of the information contained on this site cannot be guaranteed. IC Markets does not warranty, guarantee or make any representations, or assume any liability with regard to financial results based on the use of the information in the site.
News, views, opinions, recommendations and other information obtained from sources outside of www.icmarkets.com.au, used in this site are believed to be reliable, but we cannot guarantee their accuracy or completeness. All such information is subject to change at any time without notice. IC Markets assumes no responsibility for the content of any linked site. The fact that such links may exist does not indicate approval or endorsement of any material contained on any linked site.
IC Markets is not liable for any harm caused by the transmission, through accessing the services or information on this site, of a computer virus, or other computer code or programming device that might be used to access, delete, damage, disable, disrupt or otherwise impede in any manner, the operation of the site or of any user’s software, hardware, data or property.


