
Key risk events today:
UK GDP m/m; UK Manufacturing Production m/m; German ZEW Economic Sentiment.
EUR/USD:
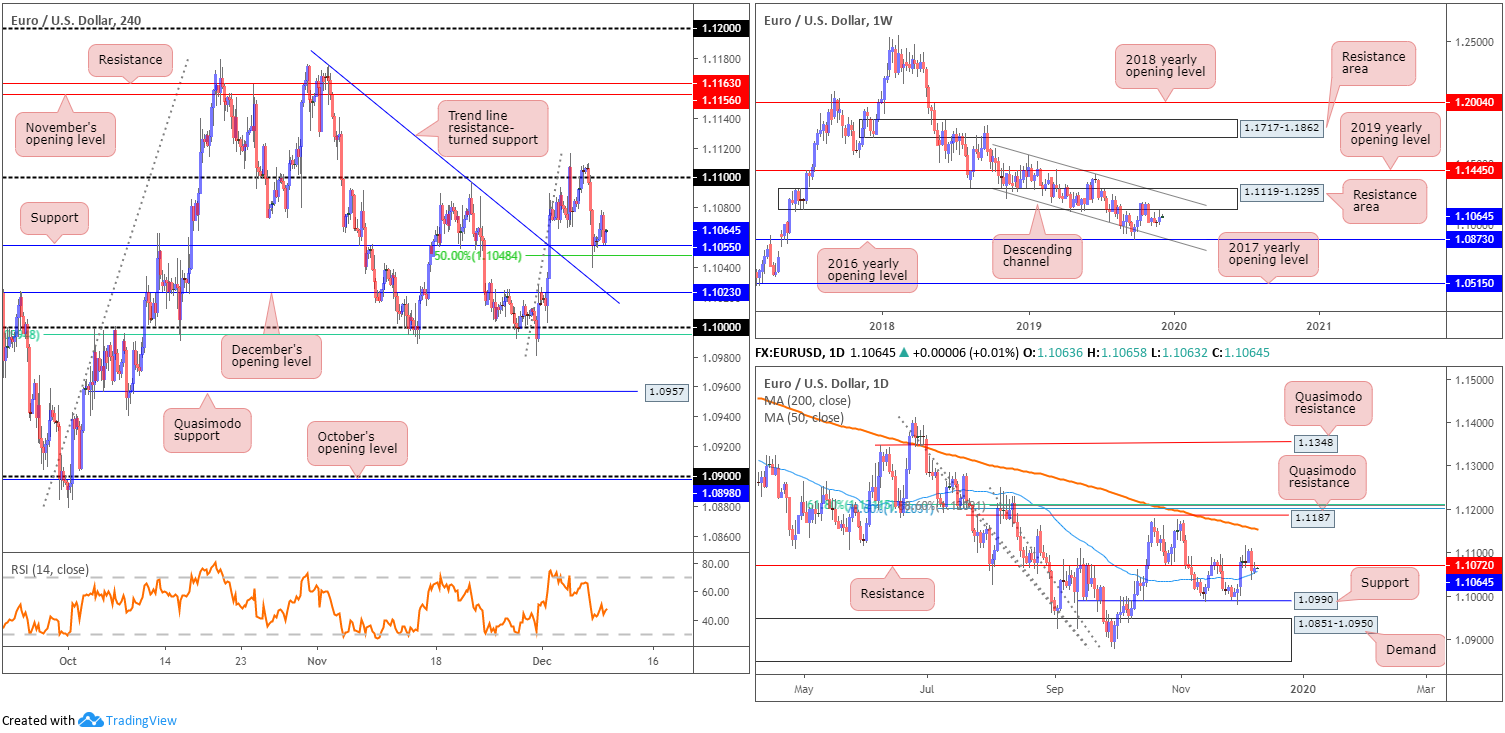
Europe’s shared currency concluded narrowly mixed against the buck Monday, underpinned by H4 support priced in at 1.1055 and a 50.0% retracement ratio at 1.1048. Beneath here, traders’ crosshairs are likely fixed on December’s opening value at 1.1023 that aligns closely with a trend line resistance-turned support, taken from the high 1.1173. To the upside, 1.11 is a visible resistance, with a break of here exposing November’s opening level plotted at 1.1156.
As highlighted in Monday’s technical briefing, weekly price remains languishing south of a long-standing resistance at 1.1119-1.1295. The beginning of November 2018 also saw the pair launch a descending channel, formed from a high set at 1.1569 and a low of 1.1109. Further selling has the lower boundary of the descending channel to target, which happens to unite closely with the 2016 yearly opening level at 1.0873. Concerning trend direction, the primary downtrend has been in motion since topping in early 2018 at 1.2555.
Regarding daily price, the unit is seen narrowly confined between resistance at 1.1072 and the 50-day SMA (blue – 1.1057). South of the aforementioned SMA, support at 1.0990 lies in wait, closely shadowed by a muscular demand at 1.0851-1.0950. A decisive push above 1.1072, on the other hand, may lead to an approach towards the 200-day SMA (1.1154), closely shadowed by Quasimodo resistance at 1.1187.
Areas of consideration:
Outlook unchanged due to lacklustre movement.
Further upside off H4 support at 1.1055 is possible, considering its alignment with the 50-day SMA, though faces daily resistance set at 1.1072. H4 support at 1.1023 (December’s opening level) faces the same predicament. However, lower-timeframe intraday long entries off 1.1023 may still offer reasonable risk/reward, as the first upside target falls in at 1.1055.
The 1.10 handle on the H4 is also potentially of interest this week as support, given its alignment with a 61.8% Fibonacci retracement ratio at 1.0994 and daily support at 1.0990. Similarly, however, resistance is found close by at 1.1023.
GBP/USD:
Sterling ended Monday unmoved vs. the greenback as the clock ticks down to Thursday’s General Election. Weekend polls had Prime Minister Boris Johnson’s Conservatives between 8-15 points ahead of opposition Labour.
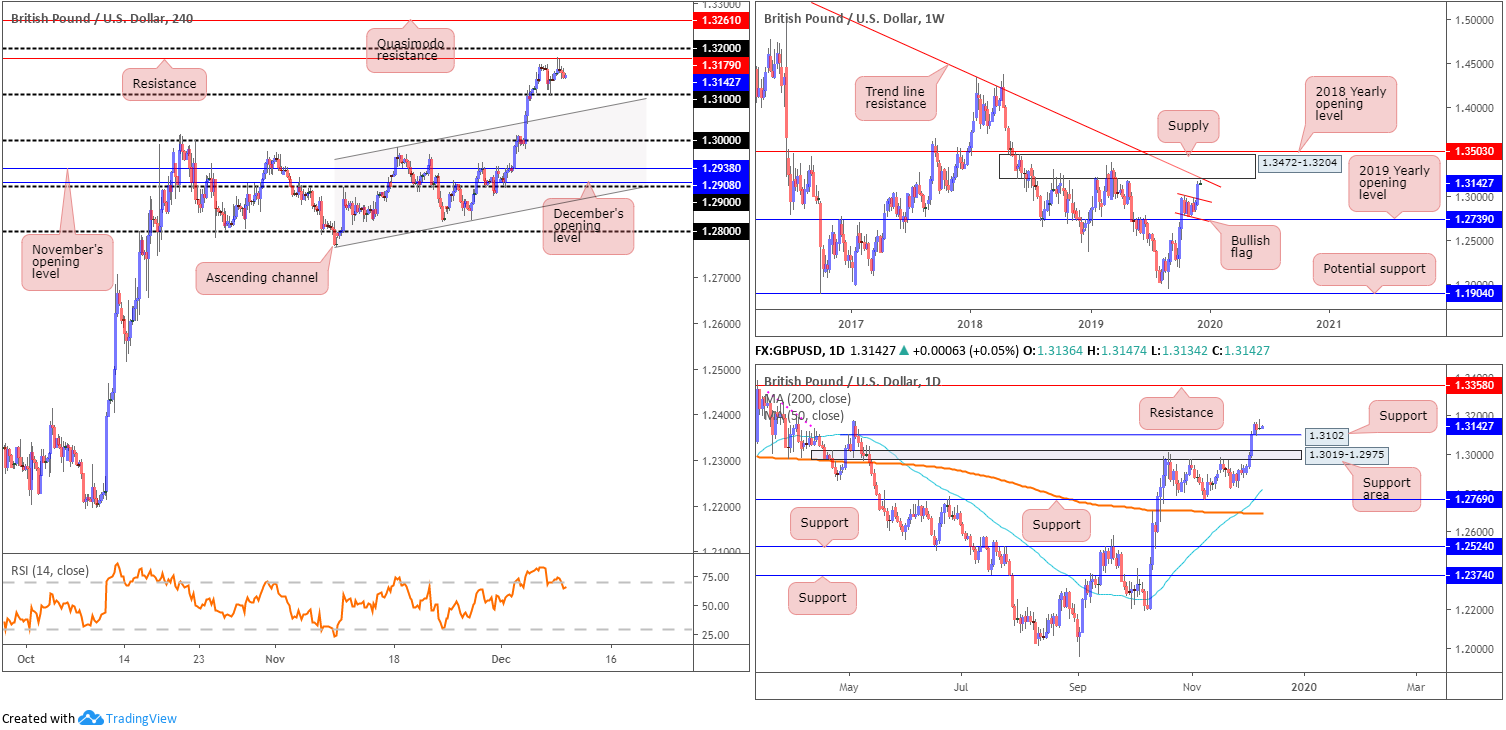
Technically, H4 movement scored a fresh multi-month peak at 1.3181 yesterday and shook hands with the underside of H4 resistance at 1.3179, closely shadowed by the 1.32 handle. Additional areas of interest fall in at the 1.31 handle and a channel resistance-turned support, extended from the high 1.2984. Indicator-based traders witnessed the relative strength index (RSI) score a value of 82.30 last week, though is, as of writing, nudging beneath the 70.00 overbought threshold and forming bearish divergence.
On a wider perspective, weekly activity soared through the top edge of a bullish flag last week – formed just north of the 2019 yearly opening level 1.2739 – and landed a few points ahead of supply at 1.3472-1.3204, and long-term trend line resistance, etched from the high 1.5930. Regarding the immediate trend, the market faces a downward trajectory from 1.4376, though a violation of the 1.3380 March 11 high shifts focus to the upside.
In view of GBP/USD bulls enhancing their position, the daily resistance area at 1.3019-1.2975 also yielded ground last week, as did Quasimodo resistance at 1.3102 (both now acting supports). Interestingly, Friday’s action retested 1.3102 and formed a mild end-of-week correction. Continued bidding from this point has resistance at 1.3358 in sight. Note limited supply is seen on this timeframe between 1.3102/1.3358. The pink line plotted to the left of price denotes what appears to be consumed supply. Traders, however, may also want to acknowledge yesterday’s candle action produced a clear-cut shooting star pattern (considered a bearish candlestick signal at peaks).
Areas of consideration:
Monday’s technical briefing highlighted the following piece:
The retest at 1.31 by way of a H4 hammer candlestick signal, coupled with daily support in motion at 1.3102 and weekly price displaying room to approach 1.3204 (the underside of weekly supply), highlights a buyers’ market today/early week.
An entry at current price is an option, with a protective stop-loss order plotted below 1.31. The initial upside target falls in at 1.3179, with 1.32 likely to uncover healthy selling, in view of its connection to weekly supply.
As evident from the H4 chart, 1.3179, the initial take-profit target, was achieved yesterday, which likely led to most traders reducing risk to breakeven and being stopped out.
An additional retest at 1.31 might be in order today/this week, as the number remains bolstered by daily support at 1.3102. Waiting for candlestick confirmation is certainly something worth exploring; round numbers are prone to fakeouts due to the number of orders that tend to collect around these barriers.
In addition to the above, keep eyes on 1.32. Given its connection with the underside of weekly supply, active sellers likely lie in wait.
AUD/USD:
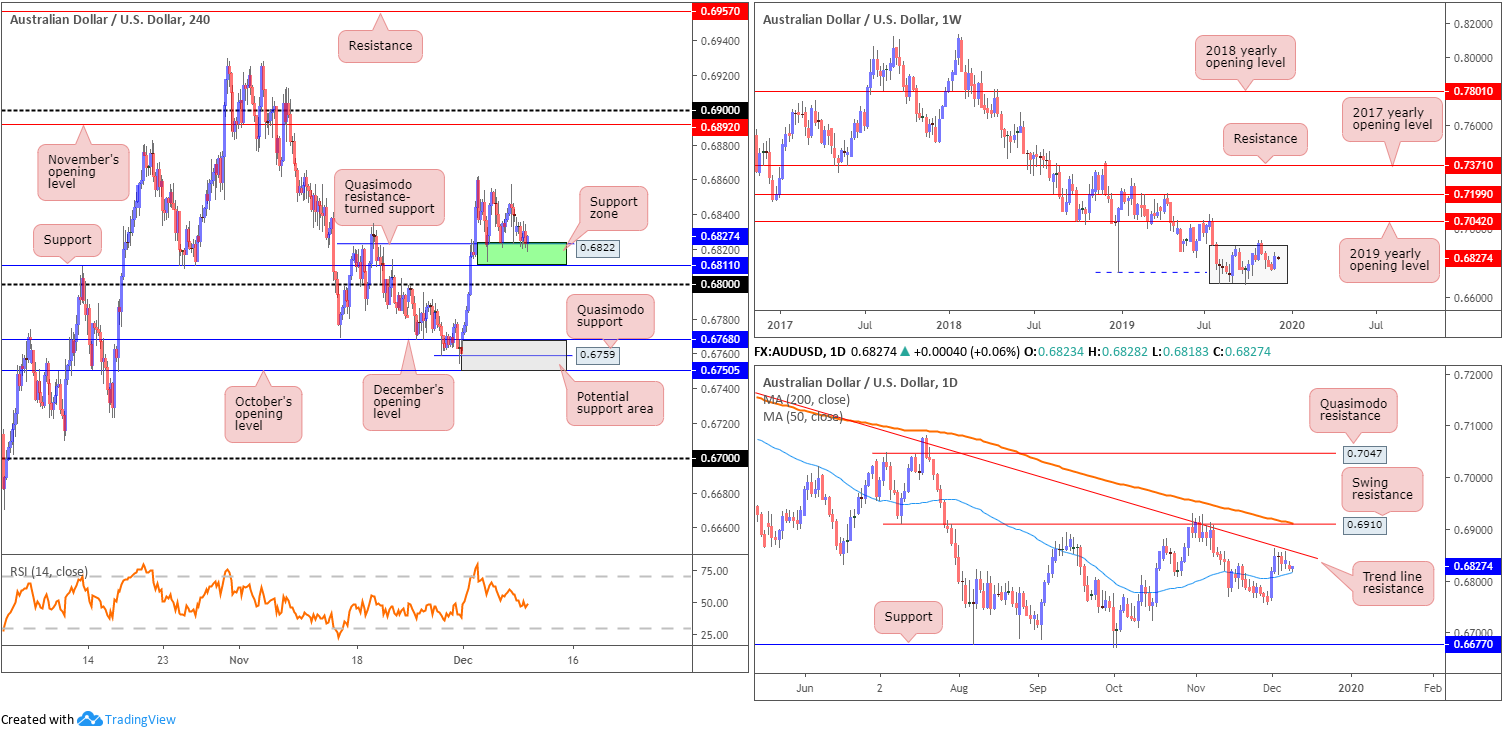
AUD/USD kicked off the week in negative territory, bearing the brunt of less-than-stellar Chinese trade surplus. Despite the downbeat tone, the pair remains reinforced by a H4 support area between 0.6811/0.6822 (green). 0.6853, however, is proving a troublesome ceiling to overcome on this timeframe, withstanding multiple upside attempts.
Beneath the aforementioned support zone, the 0.68 handle lies in wait, followed by another area of support at 0.6750/0.6768 (comprised of October’s opening level at 0.6750, Quasimodo support at 0.6759 and December’s opening level at 0.6768). It may also interest some traders to note the relative strength index (RSI) recently crossed beneath its 50.0 value (considered a bearish signal).
Higher-timeframe action continues to emphasise a ranging condition on the weekly timeframe between 0.6894/0.6677 (light grey). With the primary downtrend in play since early 2018, a breakout lower is favoured. Daily price, on the other hand, is narrowly confined between long-term trend line resistance, extended from the high 0.7393, and the 50-day SMA (blue – 0.6816). A break of the noted trend line exposes swing resistance at 0.6910, merging closely with the 200-day SMA (orange – 0.6911). A violation of the said 50-day SMA this week, nonetheless, highlights the 0.6754 November 29 low, and notable support coming in at 0.6677.
Areas of consideration:
The current H4 support area marked in green at 0.6811/0.6822 remains in motion, and boasts additional support from the 50-day SMA. However, the lack of enthusiasm to explore higher ground over the past week may lead to price testing 0.68. Entering long from 0.68 faces possible resistance from the current support, therefore trade with caution.
0.6750/0.6768 is another area of H4 support worthy of the watchlist for a potential bounce higher. Owing to its lack of higher-timeframe confluence, nevertheless, traders are urged to consider waiting for additional bullish confirmation before pulling the trigger. This could be something as simple as a bullish candlestick configuration.
USD/JPY:
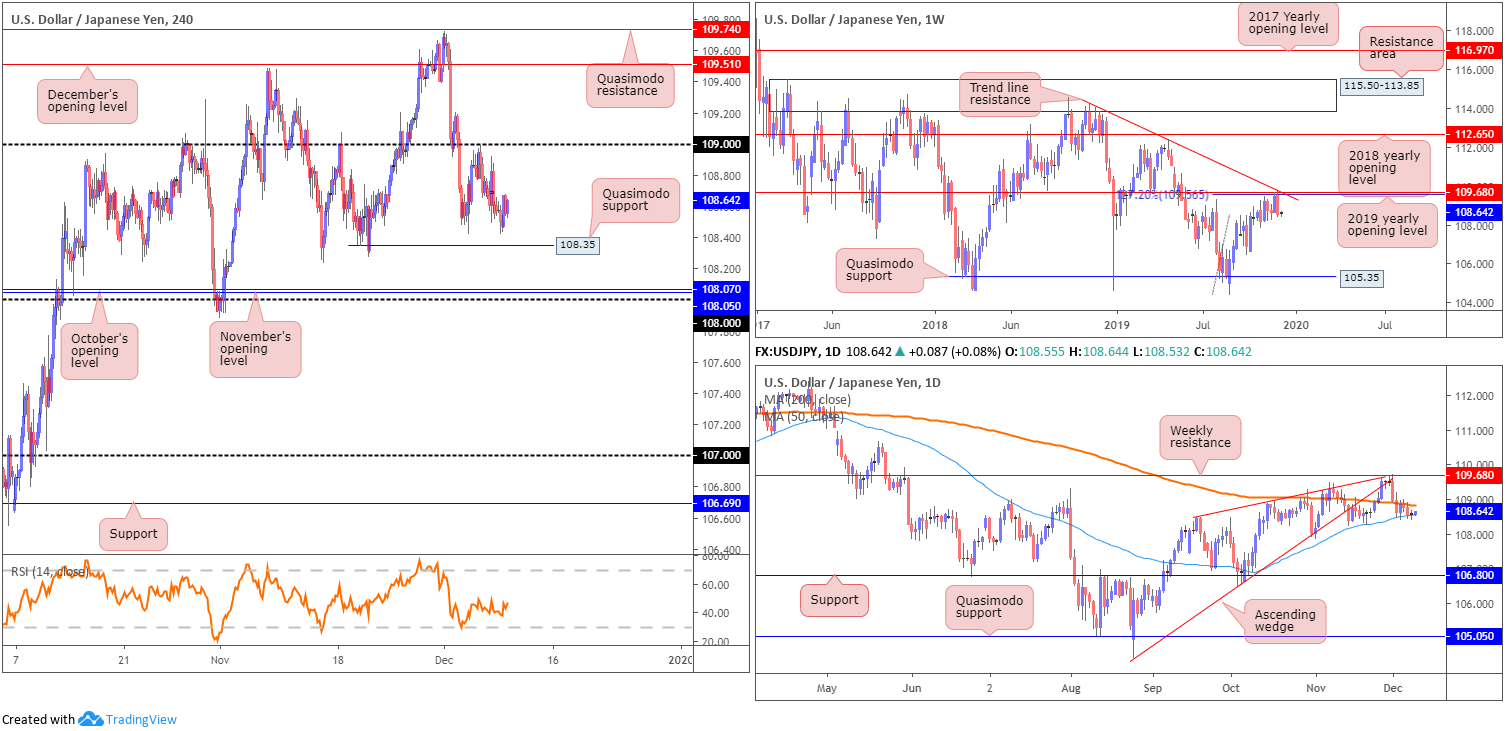
Monday’s are notoriously quiet sessions, particularly on days sporting limited fundamental drivers. USD/JPY, therefore, wrapped up recent movement unchanged, underscoring a range of no more than 25 points.
Holding south of the 109 handle on the H4 timeframe, Quasimodo support at 108.35 rests close by, shadowed by the 108 handle and November and October’s opening levels at 108.05 and 108.07, respectively. A move through 109, on the other hand, has December’s opening level in view at 109.51, as well as Quasimodo resistance at 109.74.
Meanwhile, the weekly timeframe reveals a bearish engulfing pattern formed last week, based off a collection of notable resistances: a 127.2% Fibonacci ext. point at 109.56 (taken from the low 104.44), resistance formed at 109.68, the 2019 yearly opening level and trend line resistance, extended from the high 114.23. Aside from the 106.48 September 30 swing low, limited support is evident on the weekly timeframe until shaking hands with Quasimodo support at 105.35.
Following the strong move lower from the aforementioned weekly resistances last week, trade penetrated the 200-day SMA (orange – 108.82) and remains capped beneath this value. Support is close by in the form of the 50-day SMA (blue – 108.55). Areas outside of this range can be seen around weekly resistance mentioned above at 109.68, and daily support coming in from 106.80.
Areas of consideration:
Outlook unchanged due to lacklustre movement.
Although weekly price suggests further losses could be on the cards, entering short in this market while daily price is in a phase of consolidation between the two said SMAs is likely to deter many traders. Once, or indeed if, a daily close south of the 50-day SMA occurs, technical selling will likely weigh on market movement. This could potentially be actionable this week.
H4 traders, however, may opt to wait until 108 gives way, as limited support is evident south of this barrier until shaking hands with 107. This also leaves ample room to reduce risk to breakeven and collect favourable risk/reward.
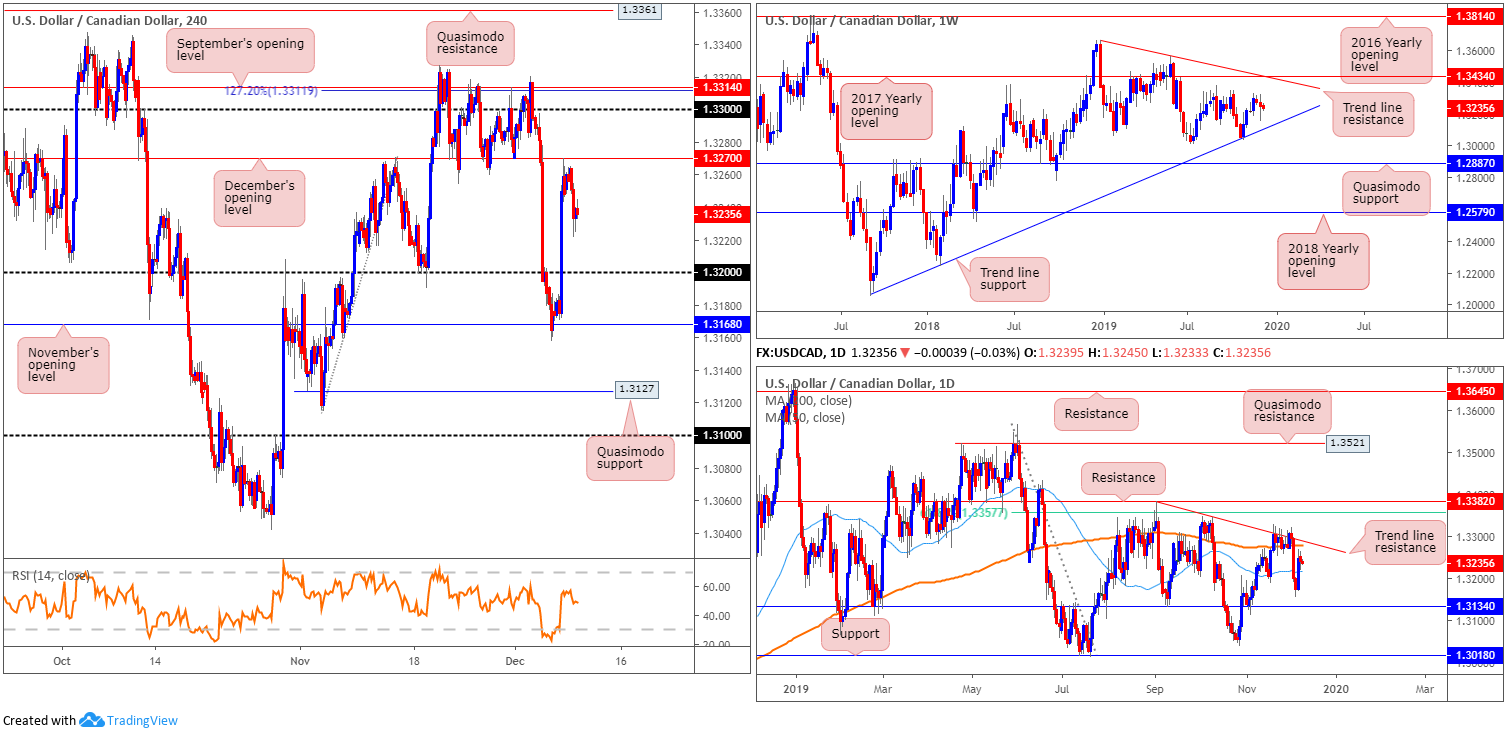
USD/CAD:
Following Friday’s to-the-point test of December’s opening level at 1.3270 based on the H4 timeframe, USD/CAD, bolstered by a rebound seen in WTI prices, navigated lower ground Monday.
For traders who read Monday’s technical briefing you may recall the following piece (italics):
The key technical observation on the weekly timeframe consists of a trend line support, extended from the low 1.2061, tops around 1.3342, the 2017 yearly opening level at 1.3434 and a trend line resistance, taken from the peak at 1.3661. Overall, the immediate trend faces north since bottoming in September 2017, though this move could also be considered a deep pullback in a larger downtrend from the 1.4689 peak in early January 2016.
A closer reading of the daily timeframe has the unit stationed below a local trend line resistance, extended from the high 1.3382. Interestingly, the 200-day SMA (orange – 1.3278) is also seen converging closely with the descending line. A few points south of price, we have the 50-SMA (blue – 1.3215) that may offer support this week, closely followed by another layer of support at 1.3134. At the same time, a break north could lead to an approach towards a 61.8% Fibonacci retracement value at 1.3357, followed by resistance at 1.3382.
Although H4 structure exhibits scope to press lower until reaching 1.32, daily price, as stressed above, has the 50-day SMA circling around 1.3215.
Areas of consideration:
Monday’s report went on to state that based on Friday’s to-the-point reaction off December’s opening level at 1.3270, which formed a reasonably notable H4 bearish candle, short sellers will likely be attempting to sell this market.
Those who went short based on current structure, therefore, ended Monday in profit. As stated above, the 50-day SMA is considered the initial downside target for sellers, followed by the 1.32 handle.
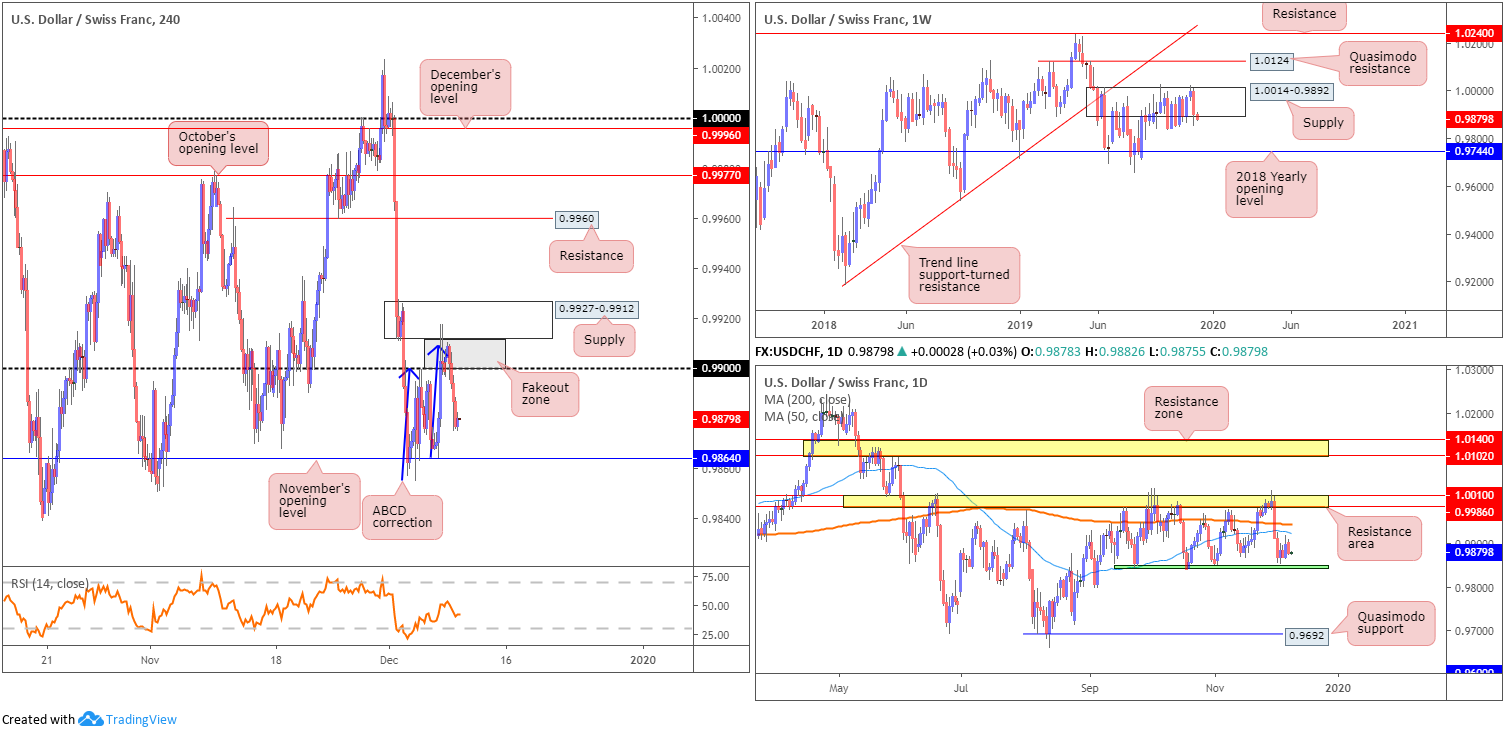
USD/CHF:
Traders who read recent technical reports on USD/CHF may recall the following piece (Italics):
A H4 fakeout zone is present between the round number 0.99 and H4 supply at 0.9927-0.9912. It is common knowledge stop-loss orders congregate around psychological levels. Therefore, a break through 0.99 will trip buy stops from not only sellers attempting to fade 0.99, but also those attempting to catch the breakout. This provides liquidity for bigger players to sell into from the noted supply and bring price lower. As such, the current supply area remains a worthy contender for any technician’s watchlist.
Well done to any readers who managed to take advantage of the reaction out of H4 supply at 0.9927-0.9912. Friday concluded marginally south of 0.99, which could prompt a continuation to the downside today, targeting November’s opening level at 0.9864. What also occurred, and likely added to the move from supply, was the completion of a H4 ABCD drive (blue arrows) at 0.9908.
Monday witnessed additional selling materialise, drawing the H4 candles to 0.9877. Traders short this market have likely reduced risk to breakeven and potentially liquidated a portion of their position, though most will be watching for a test of 0.9864 before banking profits.
Against the backdrop of higher-timeframe flow, weekly action remains consolidating within the walls of a supply zone at 1.0014-0.9892. A move higher from here has Quasimodo resistance at 1.0124 in sight, followed by resistance at 1.0240 and trend line support-turned resistance, extended from the low 0.9187. To the downside, nevertheless, the 2018 yearly opening level awaits at 0.9744.
Since mid-September, daily price has also been busy carving out a consolidation between support around the 0.9845ish region (green) and a resistance area at 1.0010/0.9986. Last week saw the unit settle nearby the lower end of the said range.
Areas of consideration:
Well done to any readers who managed to take advantage of the reaction out of H4 supply at 0.9927-0.9912. Beyond 0.9864, traders will likely have their crosshairs fixed on the lower edge of the daily range at 0.9845 as the next support target.
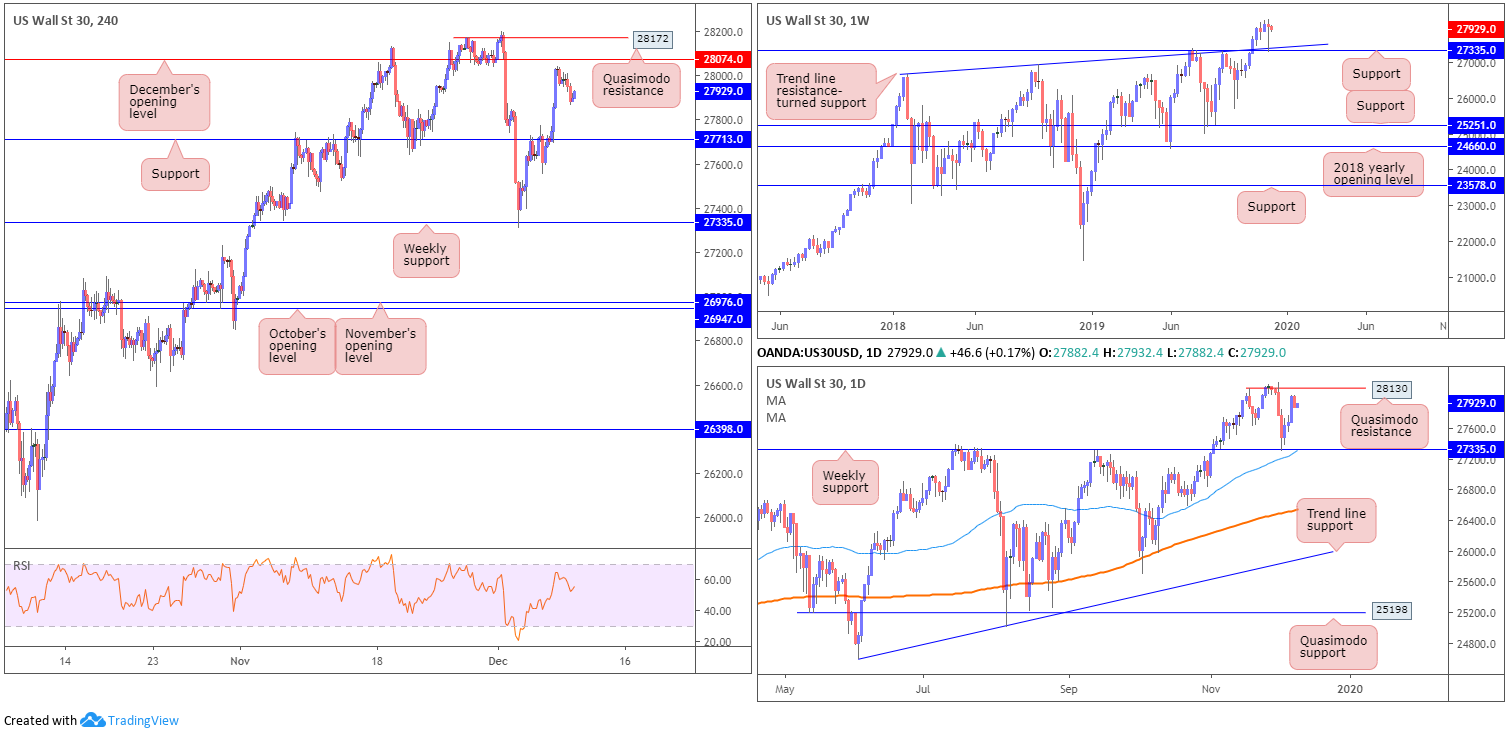
Dow Jones Industrial Average:
US equities finished lower Monday, consequently snapping a three-day bullish phase, as investors kept a close eye on trade negotiations. The Dow Jones Industrial Average erased 105.46 points, or 0.38%; the S&P 500 declined 9.95 points, or 0.32% and the tech-heavy Nasdaq 100 dropped 34.62 points, or 0.41%.
Recent selling came about ahead of December’s opening level at 28074, based on the H4 timeframe. This could result in the H4 candles revisiting support coming in at 27713, which, as you can see, has boasted reasonably significant history since the beginning of November. Beyond 28074, we have Quasimodo resistance in sight at 28172, while below 27713, weekly support may re-enter the fold at 27335.
From the weekly timeframe, traders are left with a strong weekly hammer candlestick formation (considered a strong buy signal at troughs), formed at the retest of support drawn from 27335, along with trend line support etched from the high 26670. Lower on the curve, daily price shows Quasimodo resistance rests nearby at 28130.
Areas of consideration:
A retest at H4 support 27713 is certainly a plausible scenario today, which if holds in the form of a H4 bullish candlestick signal, will likely entice buyers into the market. Entry/risk levels can be determined according to the candlestick’s parameters, with upside targets set at December’s opening level at 28074, daily Quasimodo resistance at 28130 and H4 Quasimodo resistance at 28172.
In the event the index breaks H4 Quasimodo resistance at 28172, an attack at the all-time high 28199 is likely in store. A H4 close north of this figure opens bullish scenarios, particularly on any retest seen at 28130/28182.
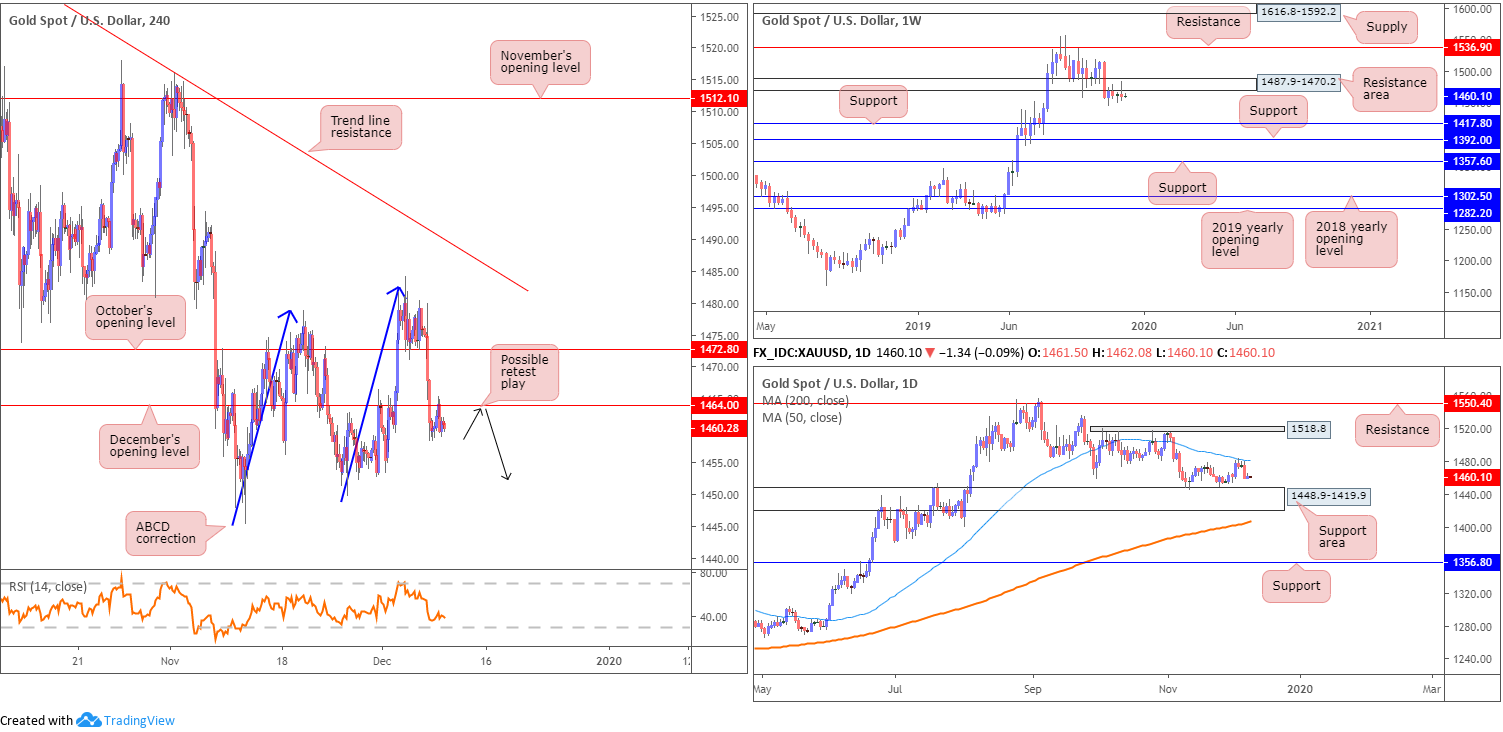
XAU/USD (GOLD):
Bullion mildly firmed against the buck Monday amid US/China trade uncertainty. Intraday bidding drew H4 price to the underside of December’s opening level at 1464.0, which held ground. For traders who read Monday’s technical briefing you may recall the piece highlighted 1464.0 as a potential resistance.
The reason behind favouring a retest at 1464.0 came down to the unit’s position on the bigger picture (see bold).
From the weekly timeframe:
After scoring a fresh weekly high at 1484.1, XAU/USD spot rotated southbound and finished last week marginally in negative terrain. As evident from the weekly timeframe, price action maintains a position south of the resistance area at 1487.9-1470.2. Further rejection off the underside of this base potentially sets the long-term stage for a move towards two layers of support at 1392.0 and 1417.8, whereas a break north could approach resistance at 1536.9. Overall, the primary trend has faced a northerly trajectory since bottoming in early December 2015.
Daily movement reveals price tested the underside of a 50-day SMA (blue – 1480.8) mid-week and explored lower ground last Friday. This follows a rebound from nearby support area coming in at 1448.9-1419.9, which may hinder downside this week.
Areas of consideration:
With room to navigate lower ground on the weekly timeframe, and daily price showing a small pocket of free movement to the support area at 1448.9-1419.9, the H4 retest at the underside of December’s opening level at 1464.0 is likely to hold and guide prices lower today, targeting the top edge of the daily support area at 1448.9 as the initial take-profit zone.
Well done to any readers who managed to secure a short position off 1464.0.
The accuracy, completeness and timeliness of the information contained on this site cannot be guaranteed. IC Markets does not warranty, guarantee or make any representations, or assume any liability regarding financial results based on the use of the information in the site.
News, views, opinions, recommendations and other information obtained from sources outside of www.icmarkets.com.au, used in this site are believed to be reliable, but we cannot guarantee their accuracy or completeness. All such information is subject to change at any time without notice. IC Markets assumes no responsibility for the content of any linked site.
The fact that such links may exist does not indicate approval or endorsement of any material contained on any linked site. IC Markets is not liable for any harm caused by the transmission, through accessing the services or information on this site, of a computer virus, or other computer code or programming device that might be used to access, delete, damage, disable, disrupt or otherwise impede in any manner, the operation of the site or of any user’s software, hardware, data or property.


