DXY:
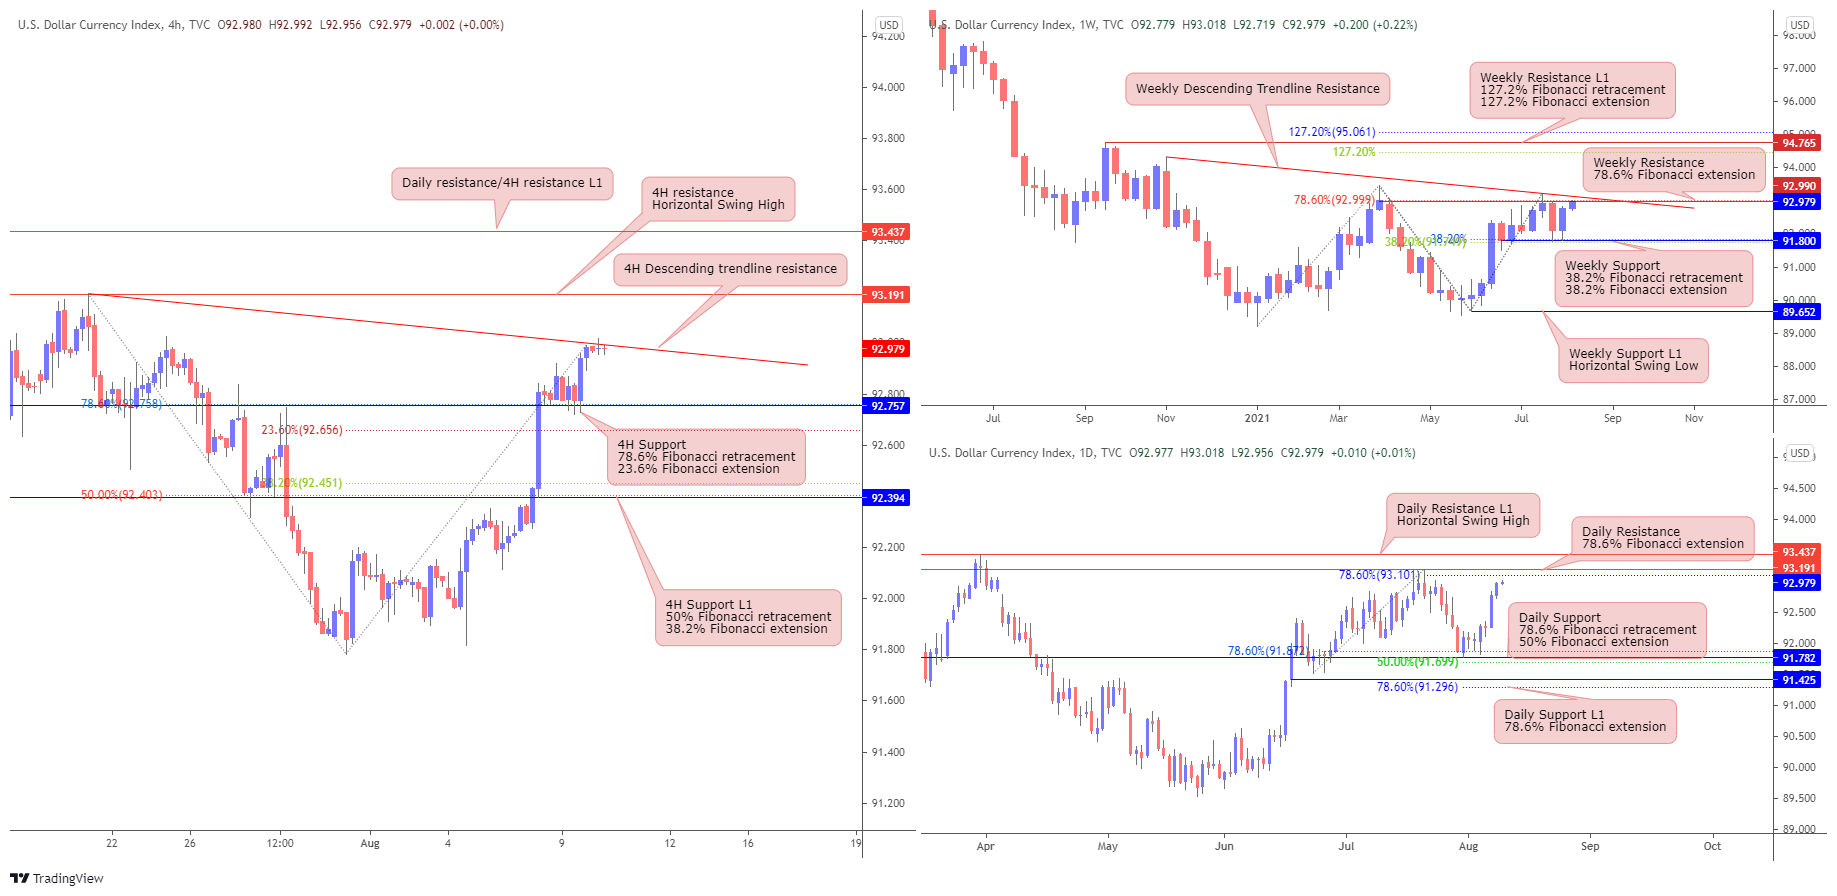
Looking at the Weekly chart price is just below weekly descending trendline resistance and retest the weekly resistance at 92.990 at 78.6% Fibonacci extension and move bullish towards the weekly resistance L1 at 94.765 in line with 127.2% Fibonacci retracement and 127,2% Fibonacci extension. Otherwise price may bearish towards weekly support at 91.8 in line with 38.2% Fibonacci retracement and 38.2% Fibonacci extension.
On the Daily timeframe, prices may surpass the daily resistance at 93.191 in line with 78.6% Fibonacci extension towards the daily resistance L1 at 93.437 in line with horizontal swing high. On the other hand price may bearish towards daily support at 91.782 near 78.6% Fibonacci retracement and 50% Fibonacci extension.
On the H4 timeframe, price is near the 4H descending trendline resistance and may bullish towards the 4H resistance at 93.191 in line with horizontal swing high. Alternatively, price may fall to 4H support at 92.757 in line with 78.6% Fibonacci retracement and 23.6% Fibonacci extension.
Areas of consideration:
- 4H resistance of 93.191
- 4H support of 92.757
XAU/USD (GOLD):
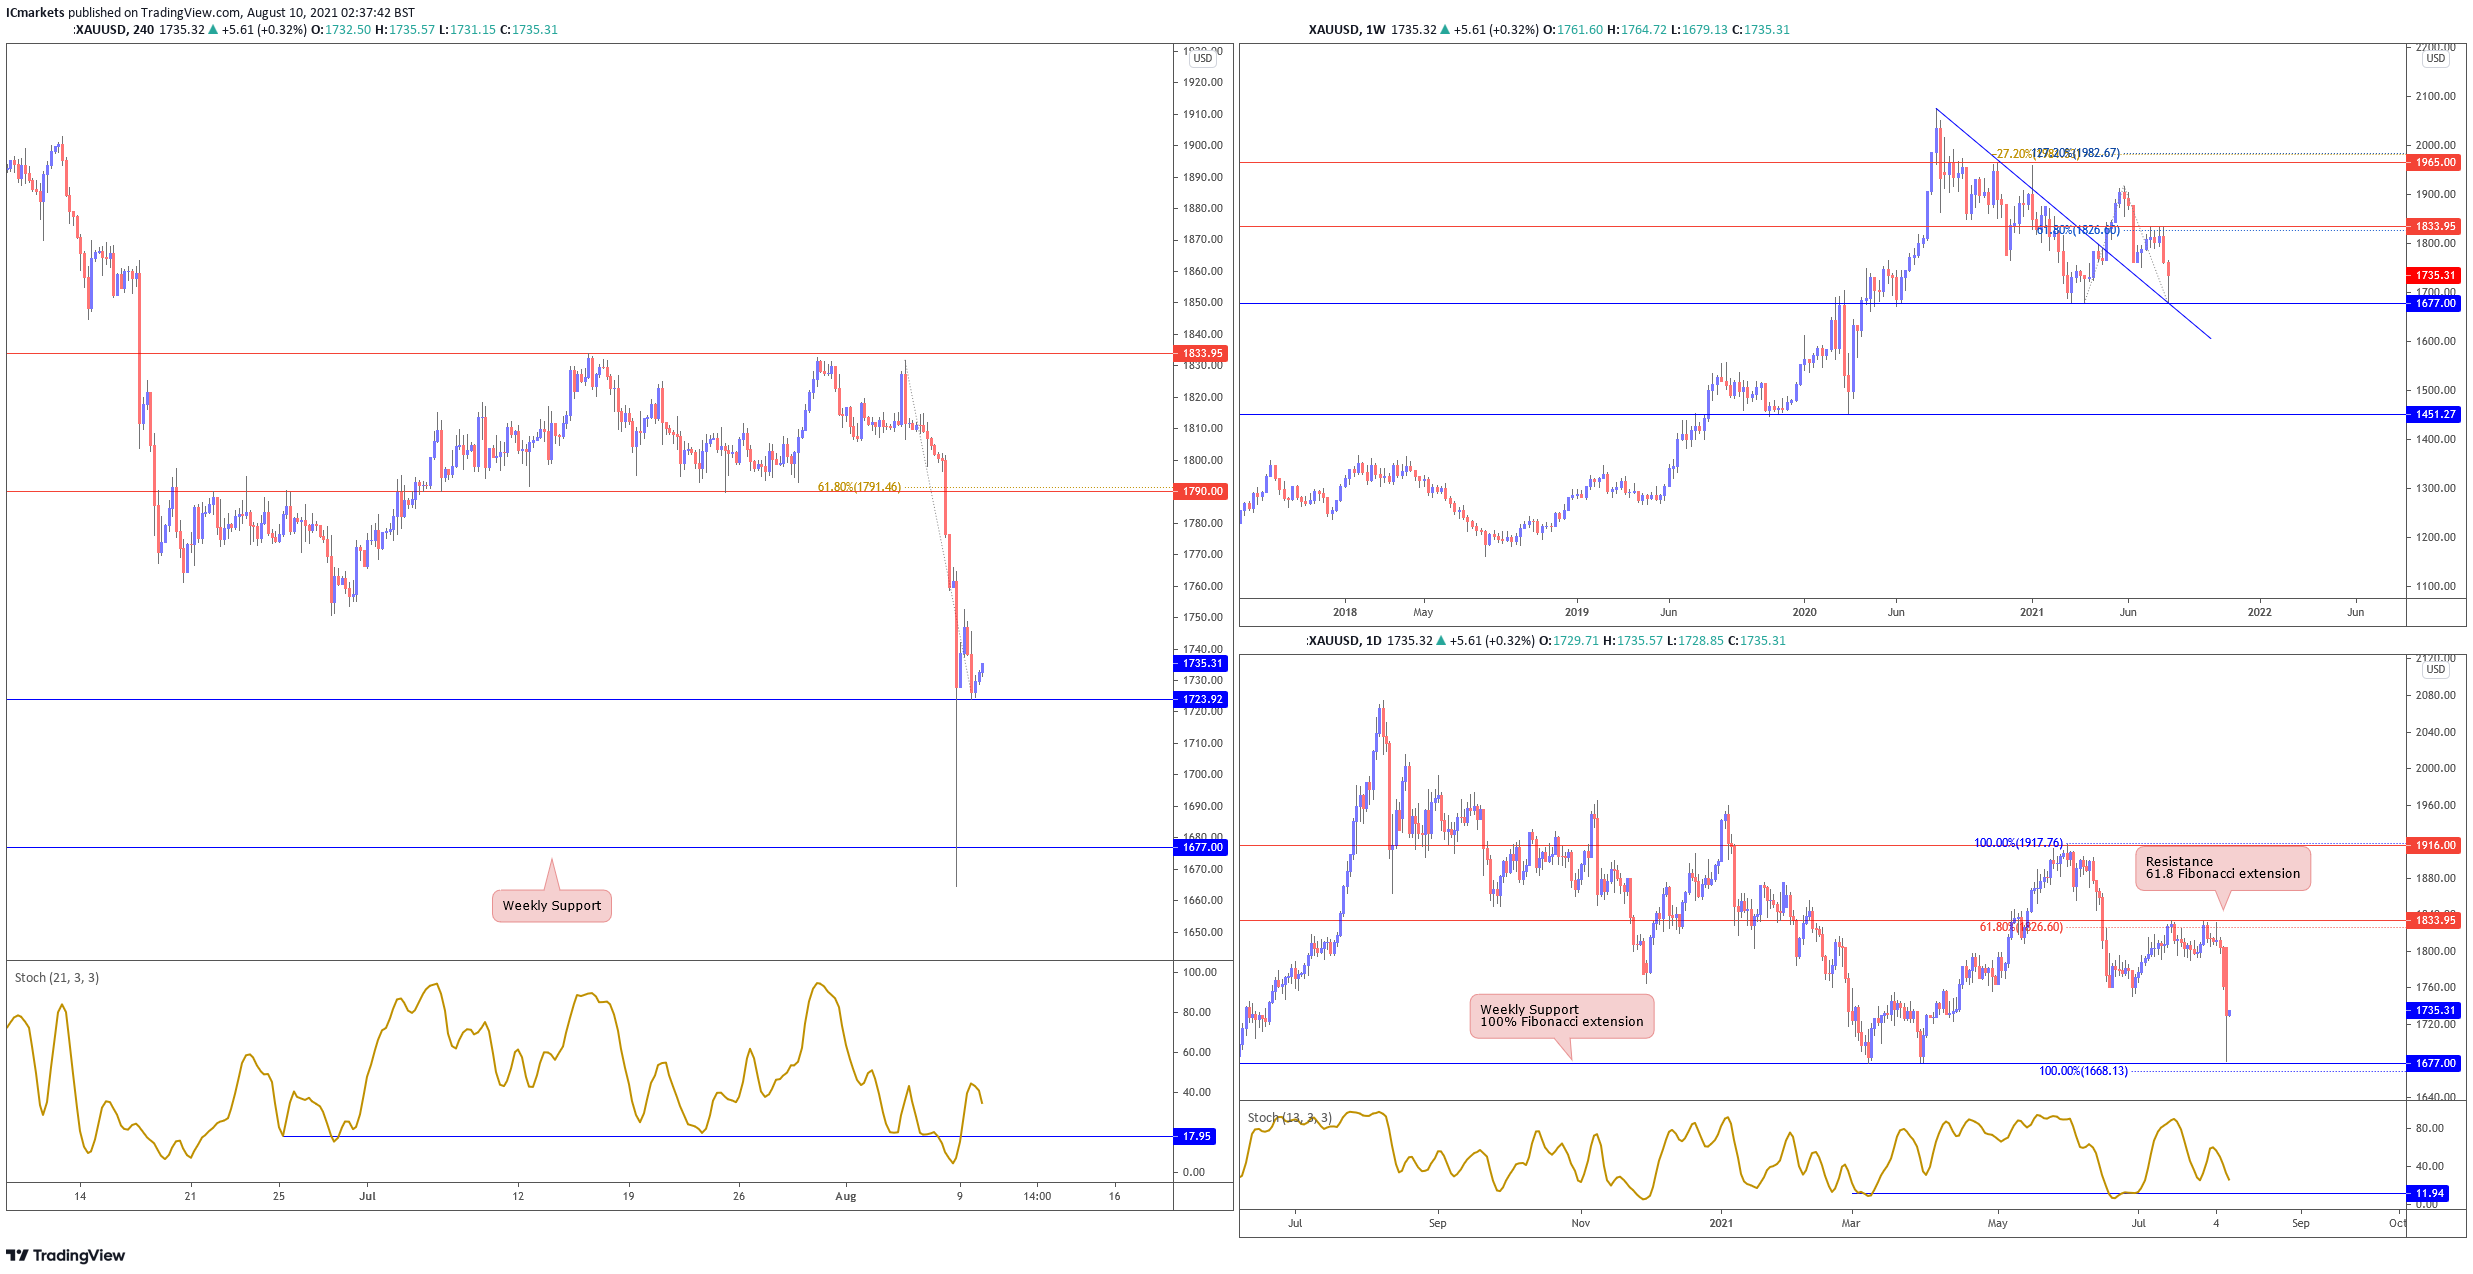
On the weekly timeframe, price dropped lower and tested descending trendline support at 1677. Price is now holding between 1833 resistance and 1677 support. These two levels would be of key interest to long term traders. A break of either of this levels should see price push higher towards next resistance at 1965 or next support at 1451. On the daily, price reacted sharply on weekly support at 1677. With stochastics reacting above support, we see a low probability bullish scenario where price may bounce towards 1833 resistance. Otherwise, breaking below 1677 will see the price drop much lower.
On the H4, price is holding above intraday support at 1723. With stochastics also holding above support where price bounced in the past, we could see a short term intraday push higher towards key graphical overlap resistance at 1790. Otherwise, failure to hold above 1723 support will see price drop towards next support at 1677 instead.
Areas of consideration:
- 1723 H4 support is level to watch for bounce
EUR/USD:
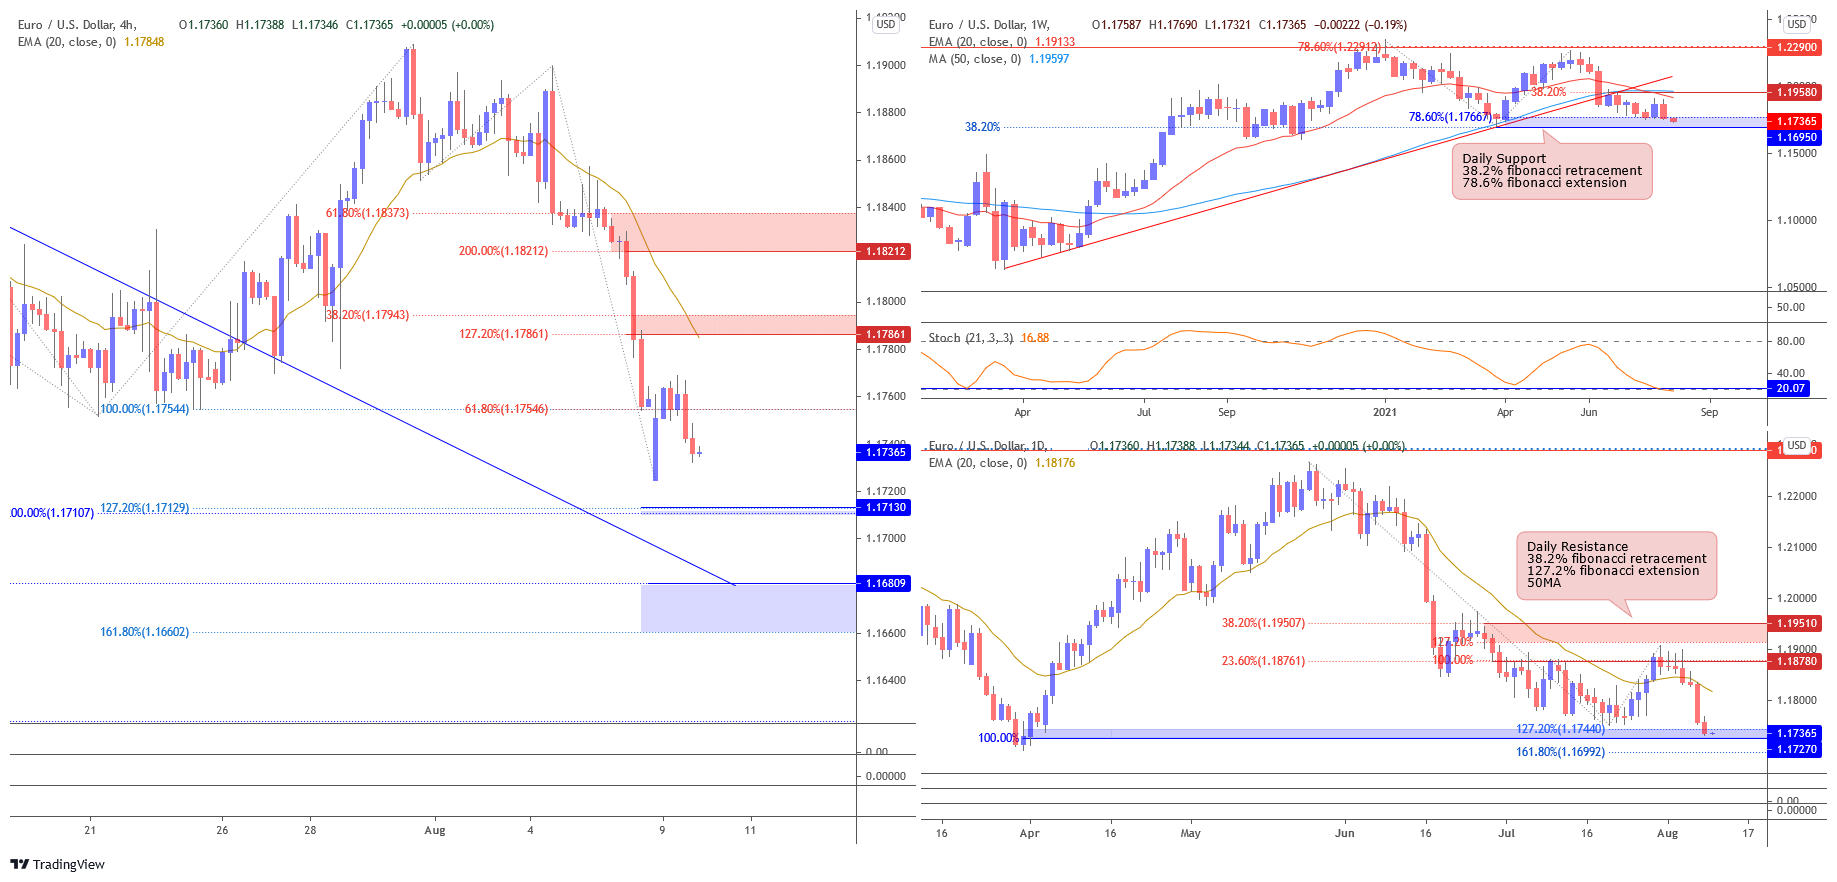
Looking at the weekly chart we can see that price has come back to test support at 1.16950, in-line with 38.2% Fibonacci retracement and 78.6% Fibonacci extension. Price is at a major support level where there could potentially be a short-term bounce. Stochastic is also at support where previous bounces occurred. On the daily chart, price faced bearish pressure and dropped to support at 1.17270, in-line with 100% and 127.2% Fibonacci extension.
On the H4 timeframe, prices are facing strong bearish pressure from 20EMA. We could potentially see the price continue to drop to support at 1.17130, in-line with 127.2% and 200% Fibonacci extension before seeing any bounces. The next support could potentially be at 1.16809, in-line with 161.8% Fibonacci retracement and 127.2% Fibonacci extension.
If price bounces, it could potentially swing towards resistance at 1.17861, in-line with 38.2% Fibonacci retracement and 127.2% Fibonacci extension. If prices bounces above 1.17861, it could potentially swing towards resistance at 1.18212, in-line with 61.8% Fibonacci retracement and 200% Fibonacci extension.
Areas of consideration:
- H4 time frame, support level at 1.17130 and 1.16800
- H4 time frame, resistance level at 1.17861 and 1.18212
USD/CHF:
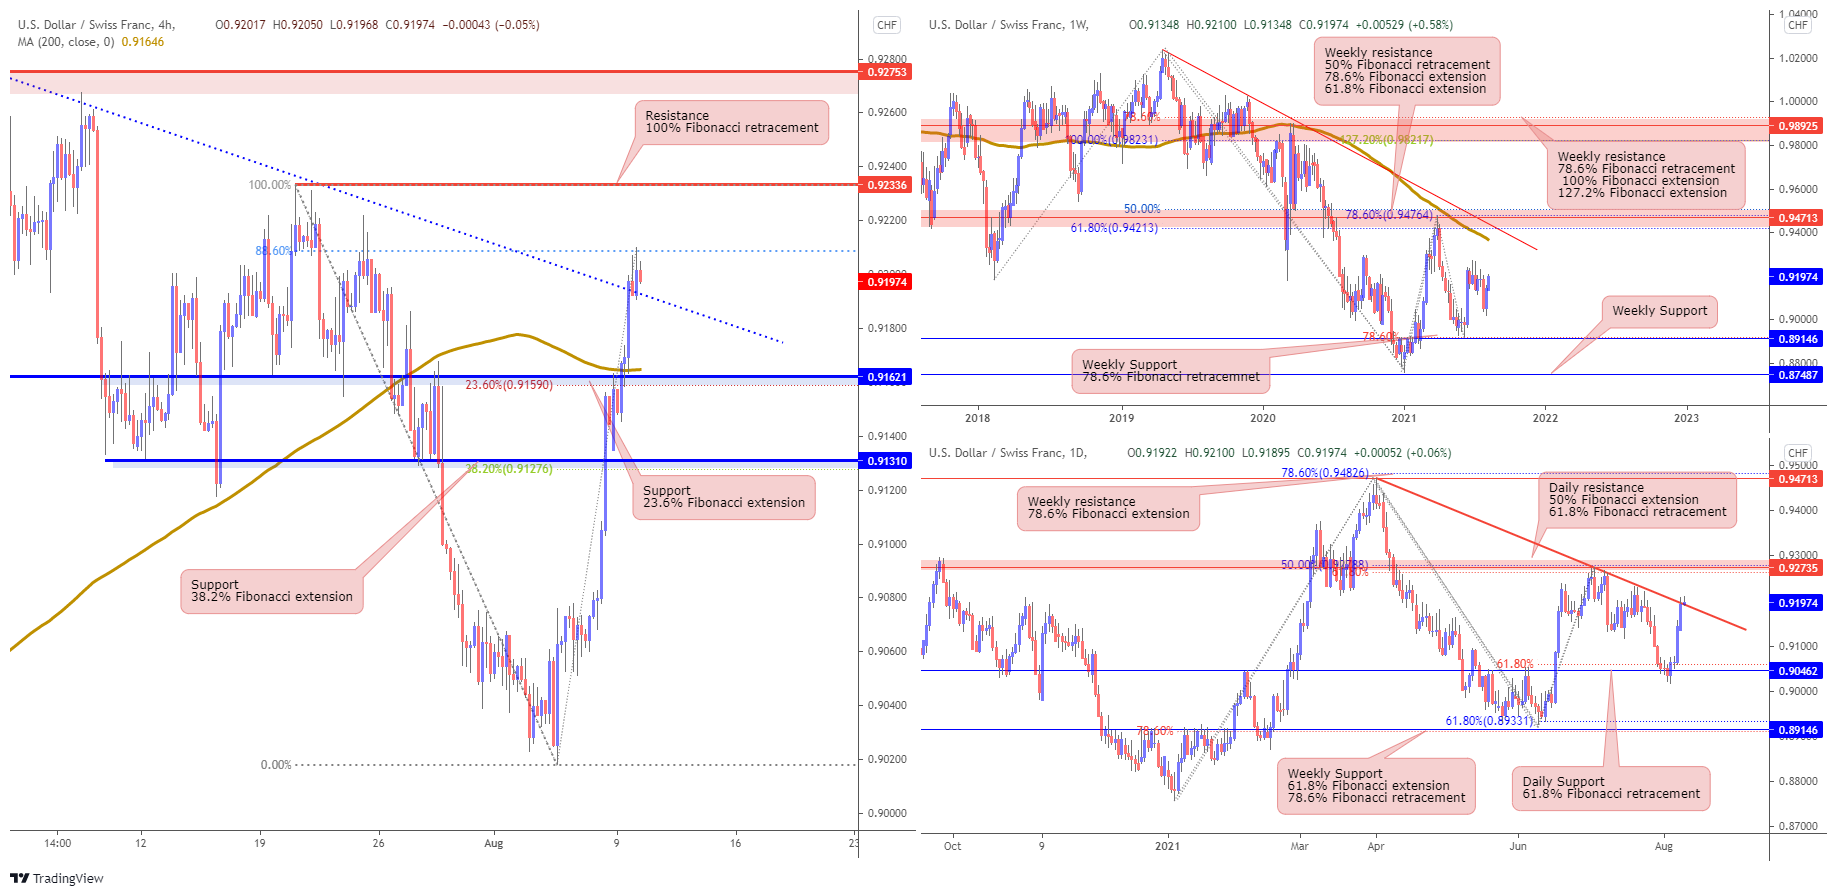
USD/CHF has shown a strong bounce from the weekly 0.89146 support, in line with 78.6% Fibonacci retracement, and price is now holding below the descending trendline resistance. The daily chart has shown a strong bounce from the daily support at 0.90462 in line with the 61.8% Fibonacci retracement level.
On the H4 chart, the price has broken out of the descending trendline showing a bullish momentum . We can expect the price to rise further and reach the price level of 0.92089 corresponding to the 88% Fibonacci retracement level. Our bullish bias is further supported by how the price is holding above the 200 moving average.
Areas of consideration:
- Price could face bearish pressure after hitting the area of 88% Fibonacci retracement.
- H4 time frame resistance 0.92336.
GBP/USD:
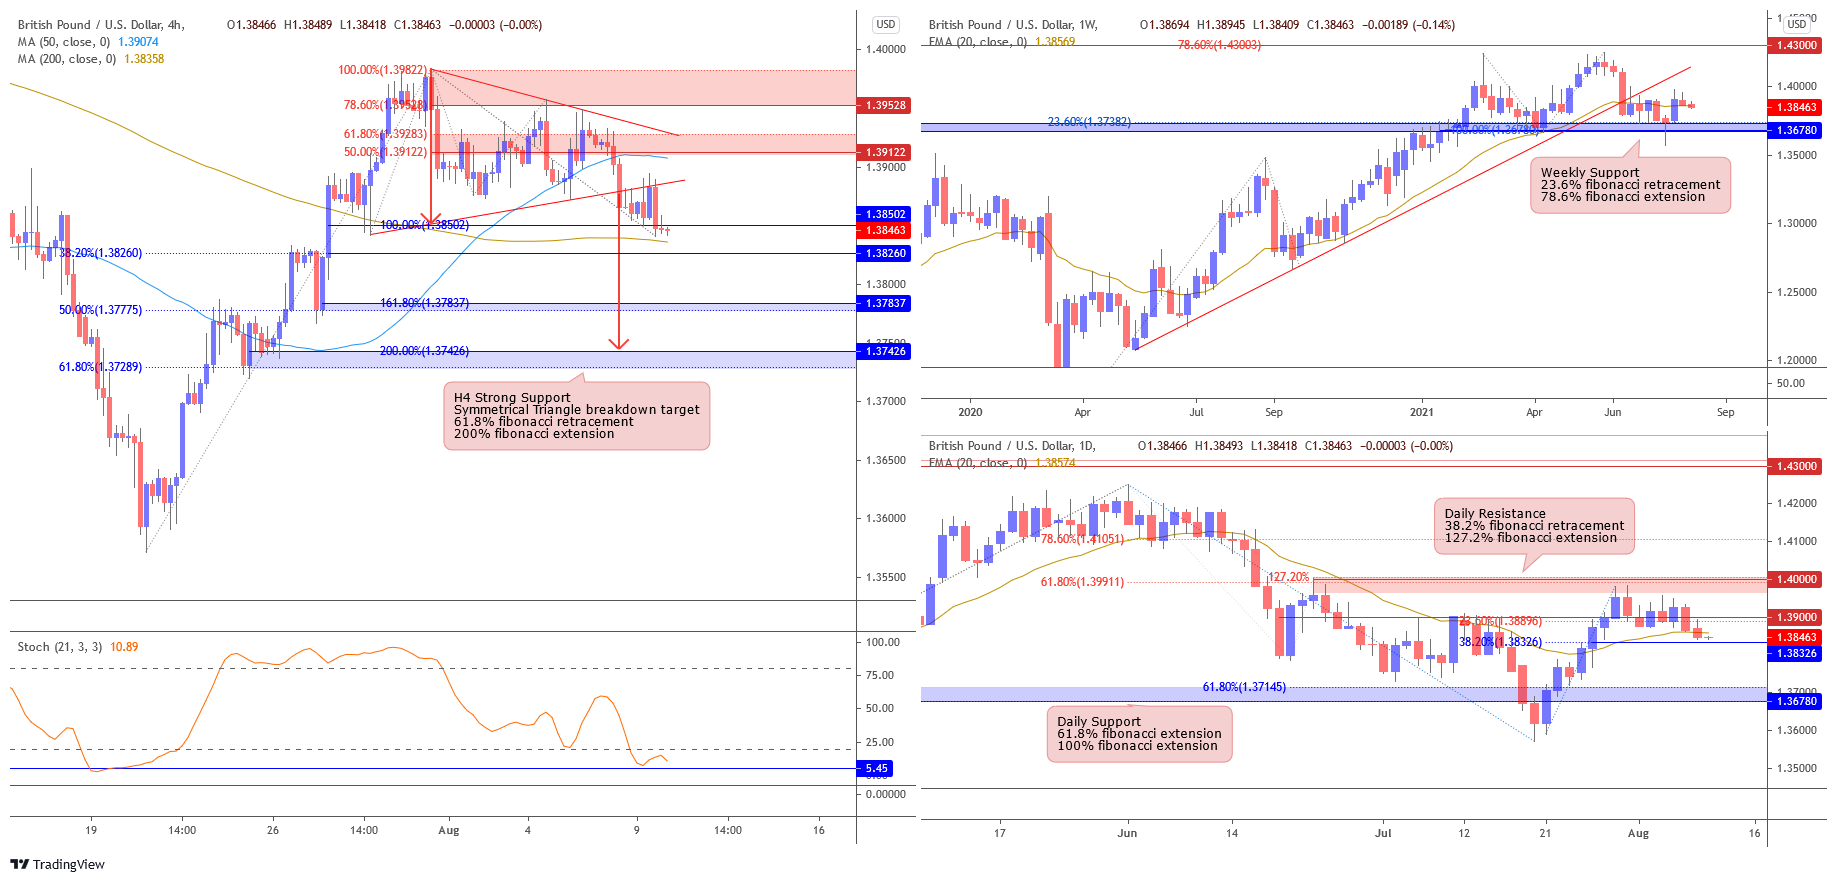
Looking at the weekly chart, prices could potentially be forming bearish flag consolidation after breaking down from ascending trendline support-turned-resistance to retest support at 1.36780, in-line with 23.6% Fibonacci retracement and 78.6% Fibonacci extension. On the daily time frame, price have broken below 20EMA and found support at 1.38326, in-line with 38.2% Fibonacci retracement.
On the H4 timeframe, prices broke down from the triangle pattern to support at 1.38502, in-line with 100% Fibonacci extension and 200MA. There could potentially be a short-term bounce before continuing to go lower to 38.2% Fibonacci retracement at 1.38260. Stochastic is also at support where previous bounces occurred. If price closes below 1.38260, it could potentially swing towards support at 1.37837, in-line with 50% Fibonacci retracement and 161.8% Fibonacci extension. The next support could potentially be at 1.37426, in-line with 61.8% Fibonacci retracement, 200% Fibonacci extension and Symmetrical Triangle breakdown target.
If the price bounces from current level, it could potentially swing towards resistance at 1.39122, in-line with 50% Fibonacci retracement and 61.8% Fibonacci extension. The next resistance could potentially be at 1.39528, in-line with 78.6% Fibonacci retracement and 100% Fibonacci extension.
Areas of consideration:
- H4 time frame, 38260 , 1.37837 and 37426 support level
- H4 time frame, 1.39122 and 1.39528 resistance level
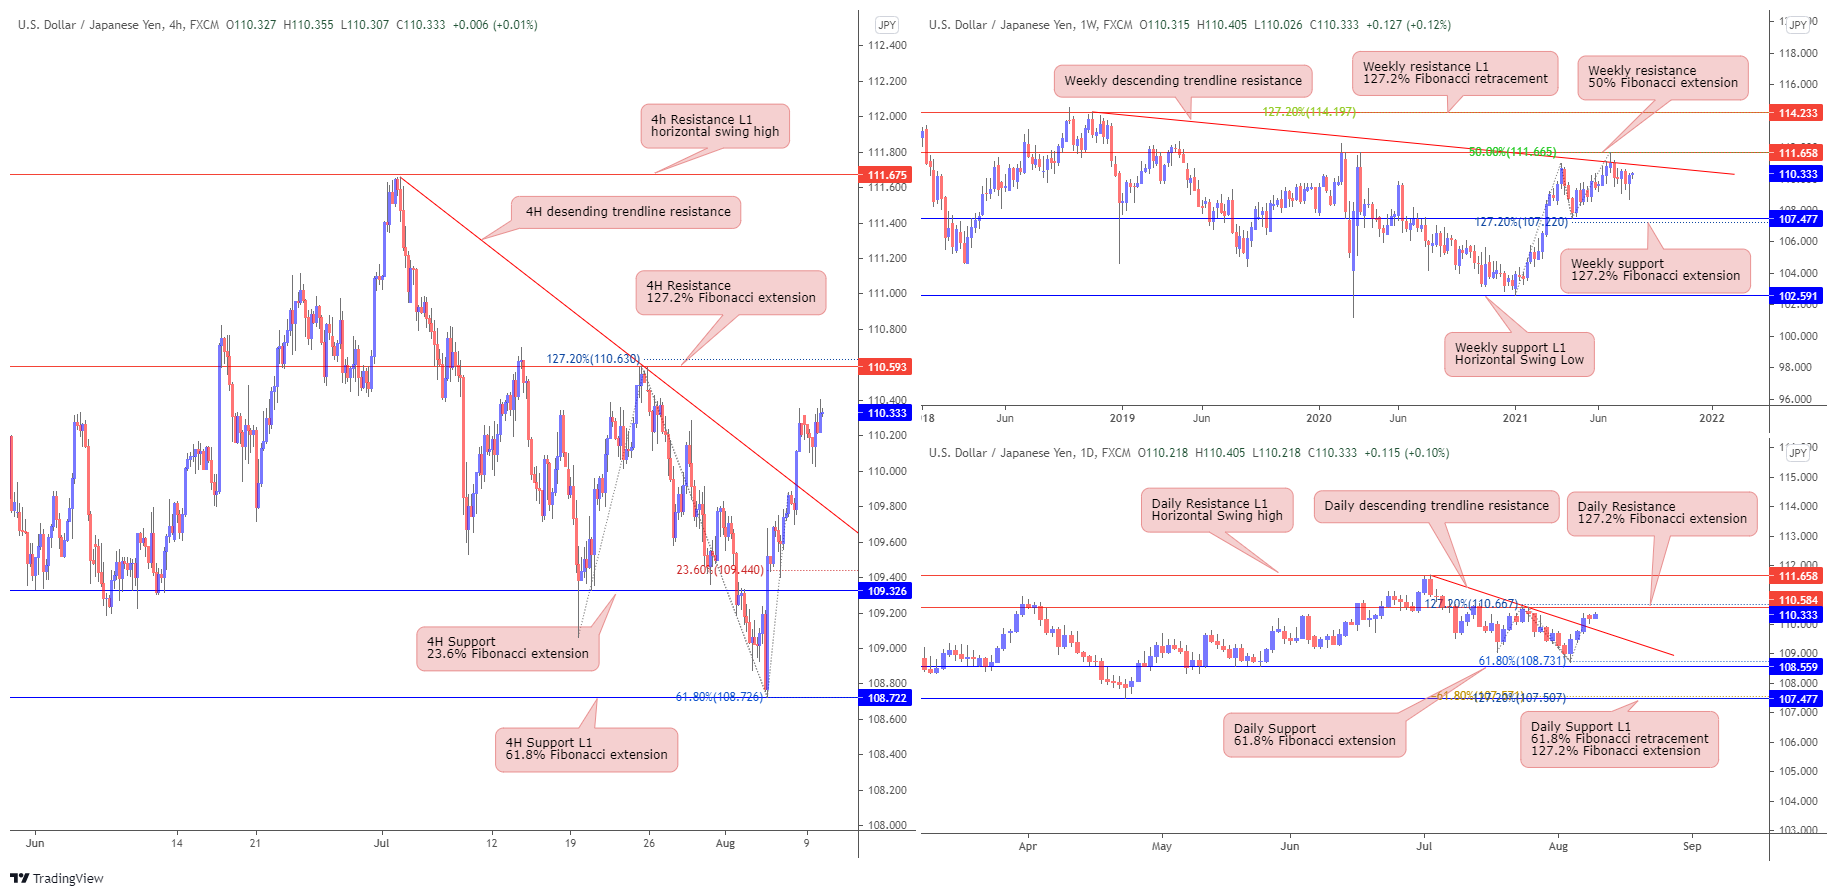
USD/JPY
From the weekly timeframe, price is below the descending trendline resistance, and may bullish to weekly resistance L1 at 114.233 in line with 127.2% Fibonacci retracement
On the other hand, price might reverse below the weekly descending trendline resistance and may bearish towards the weekly support at 107.477 in line with 127.2% Fibonacci extension.
On the Daily timeframe, price has broken above Daily descending trendline resistance might move towards the Daily resistance L1 line with horizontal swing high at 111.658. On the other hand, price might reverse near Daily resistance at 110.584 in line with 127.2% Fibonacci extension and move to retest the daily support at 108.722 in line with 61.8% Fibonacci extension.
On the 4H timeframe, price has broken above the 4H descending trendline resistance and is moving towards the 4H resistance at 110.584 in line with 127.2% Fibonacci extension. Alternatively, price may bearish towards 4H support at 109.326 in line with 23.6% Fibonacci extension.
Areas of consideration:
- 593 resistance level on the 4H timeframe
- 326 support level on the 4H timeframe
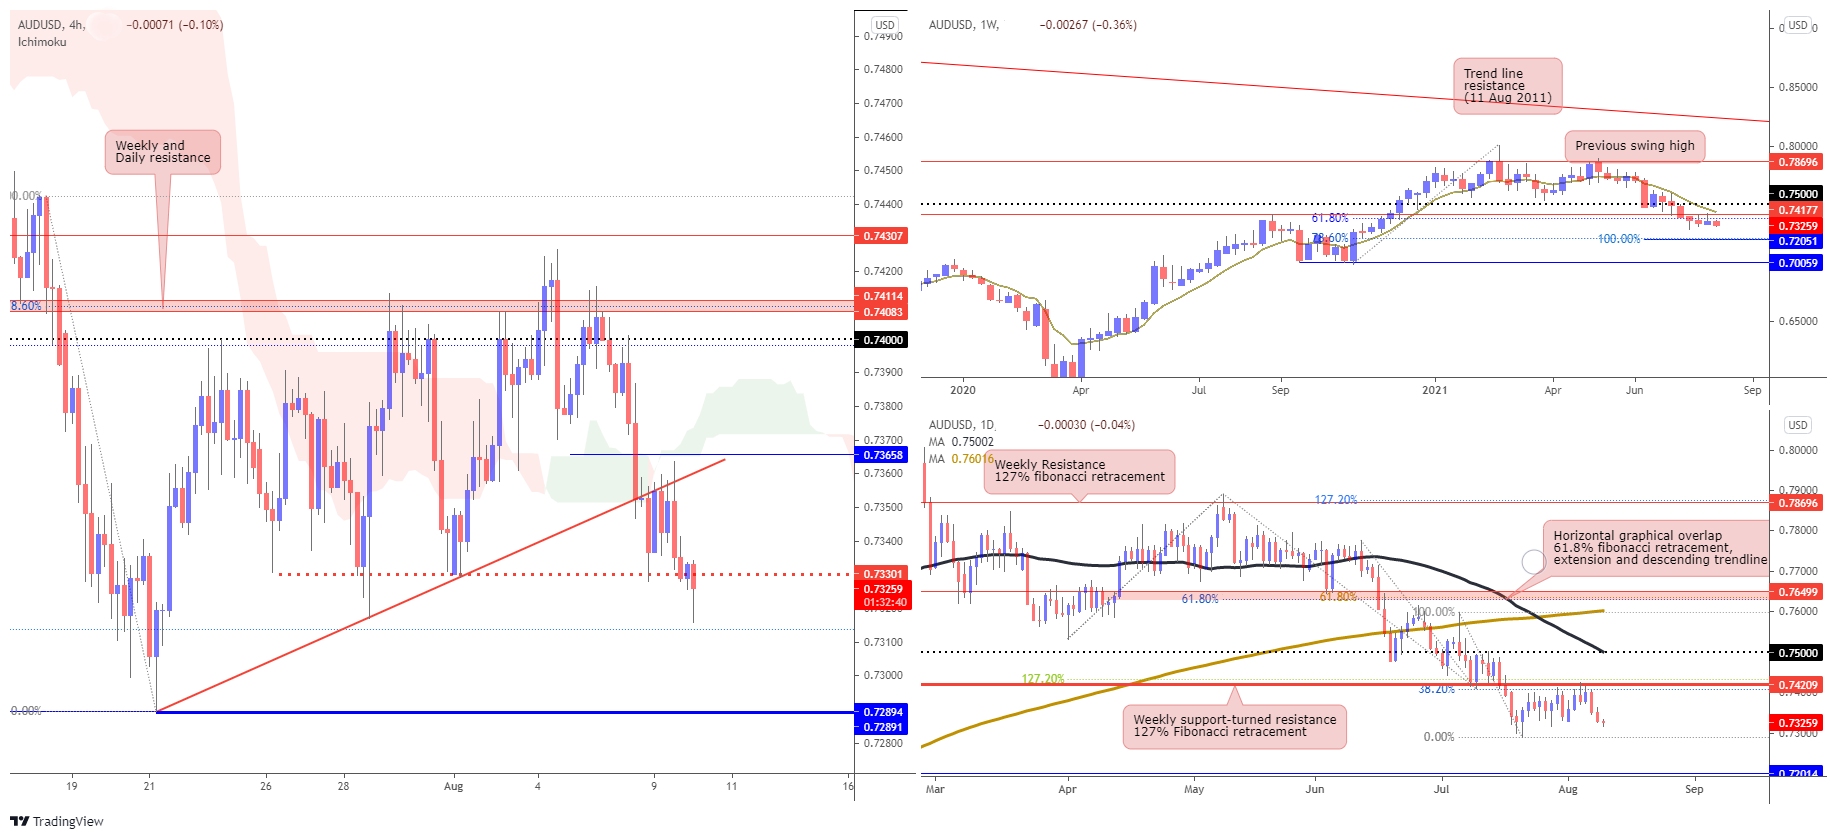
AUD/USD:
Looking at the weekly chart, price has broken beneath the 0.74177 support-turned-resistance level in line with 61.8% fibonacci retracement, where we saw price retesting this area before price pushes down further. This is supported by price trending under the moving average. On the Daily timeframe, we are seeing a similar picture where price is testing the Weekly resistance in line with 127.2% and 38.2% fibonacci retracement level before pushing further down. The bearish momentum is further supported by the death cross of the 50 moving average and the 200 moving average.
Lastly, on the H4 timeframe, we see price drop further down from the reverse 0.74083, cutting downwards below our ascending trendline, potentially approaching our previous swing low level at 0.72894 in line with our new support level. Our bearish bias is further supported by how the price is holding below the Ichimoku cloud.
Areas of consideration:
- H4 time frame showing bearish momentum.
- Daily and Weekly showing bearish momentum.
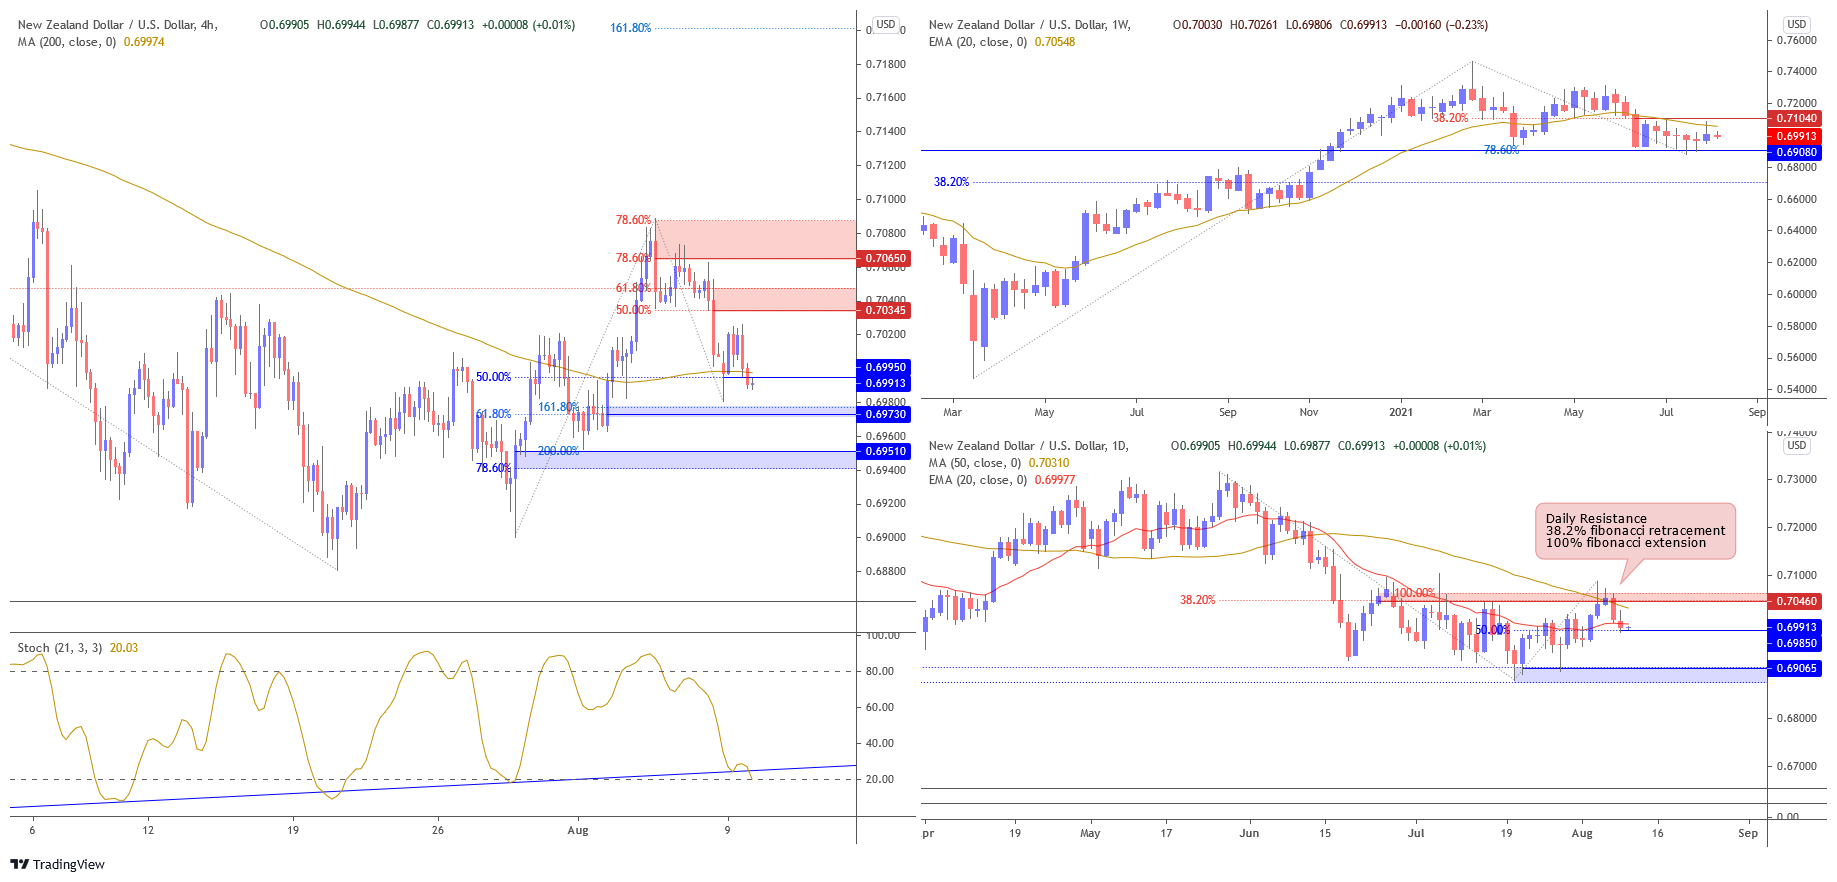
NZD/USD:
Looking at the weekly chart we could see that prices are consolidating within resistance at 0.71040 and support at 0.69080. On the daily chart, price faced bearish pressure and closed below 20EMA at 0.69850, in-line with 50% Fibonacci retracement. There could potentially be further downside.
On the H4 timeframe price action invalidated previous potential inverse head and shoulder pattern by closing below support at 0.69950, in-line with 50% Fibonacci retracement and 200MA. Price is at support where it could potentially have a short-term bounce towards resistance at 0.70345, in-line with 50%, 61.8% Fibonacci retracement and horizontal overlap support. Stochastic is also at ascending trendline support where previous bounces occurred. The next resistance could potentially be at 0.70650, in-line with 78.6% Fibonacci retracement and 78.6% Fibonacci extension.
If price drops, it could potentially swing towards support at 0.69730, in-line with 61.8% Fibonacci retracement and 161.8% Fibonacci extension. The next support could potentially be at 0.69510, in-line with 78.6% Fibonacci retracement and 200% Fibonacci extension.
Areas of consideration:
- H4 time frame, support level at 0.69730 and 69510
- H4 time frame, resistance level at 70345 and 0.70650
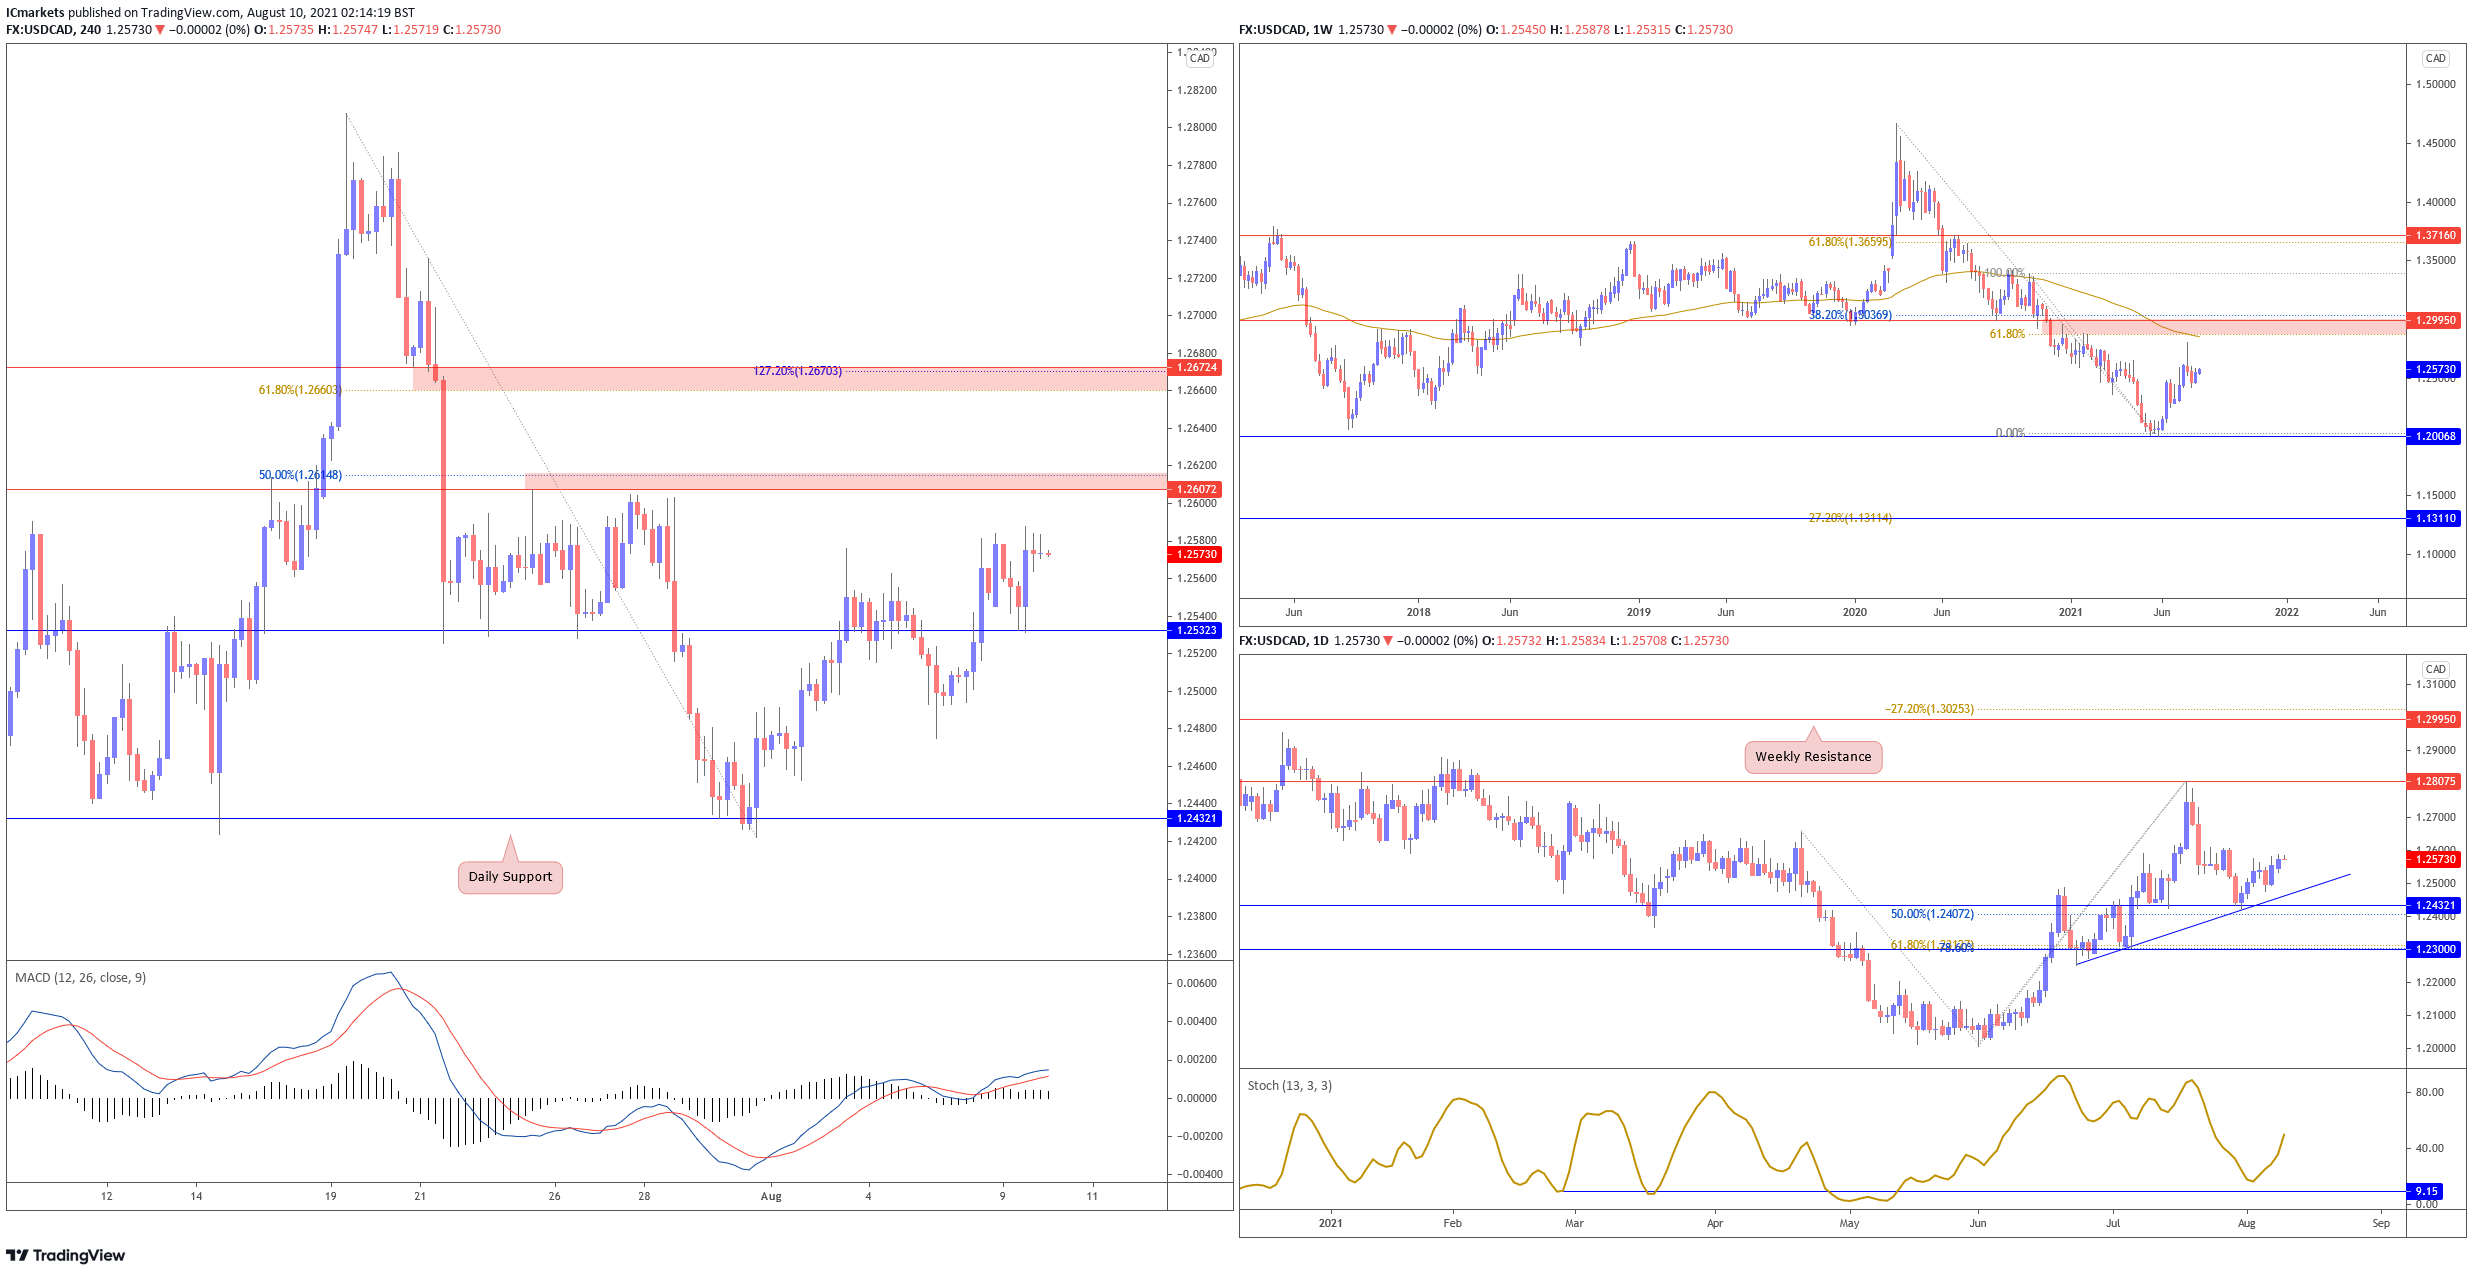
USD/CAD:
On the Weekly timeframe, price is holding below long term moving average and also both 38.2% and 61.8% Fibonacci retracement level at 1.29950. As long as the price is holding below this level, we see price facing further bearish pressure in the long term. On the Daily, price recently bounced from the ascending trendline support and may find resistance at the graphical swing high resistance level at 1.28075. Otherwise, breaking below ascending trendline support, we may see a push down towards the first support at 1.23 major level, in line with 61.8% fibonacci retracement and 78.6% fibonacci extension.
On the H4, price is drifting higher, holding above 1.25323 support. With MACD indicator still in a bullish environment, it is possible to see limited upside pressure towards 1.26072 resistance. Otherwise, only a break below 1.25323 support will see the sellers enter and push price lower towards daily support at 1.24321 instead.
Areas of consideration:
- Daily and H4 timeframes show room for further bullish pressure
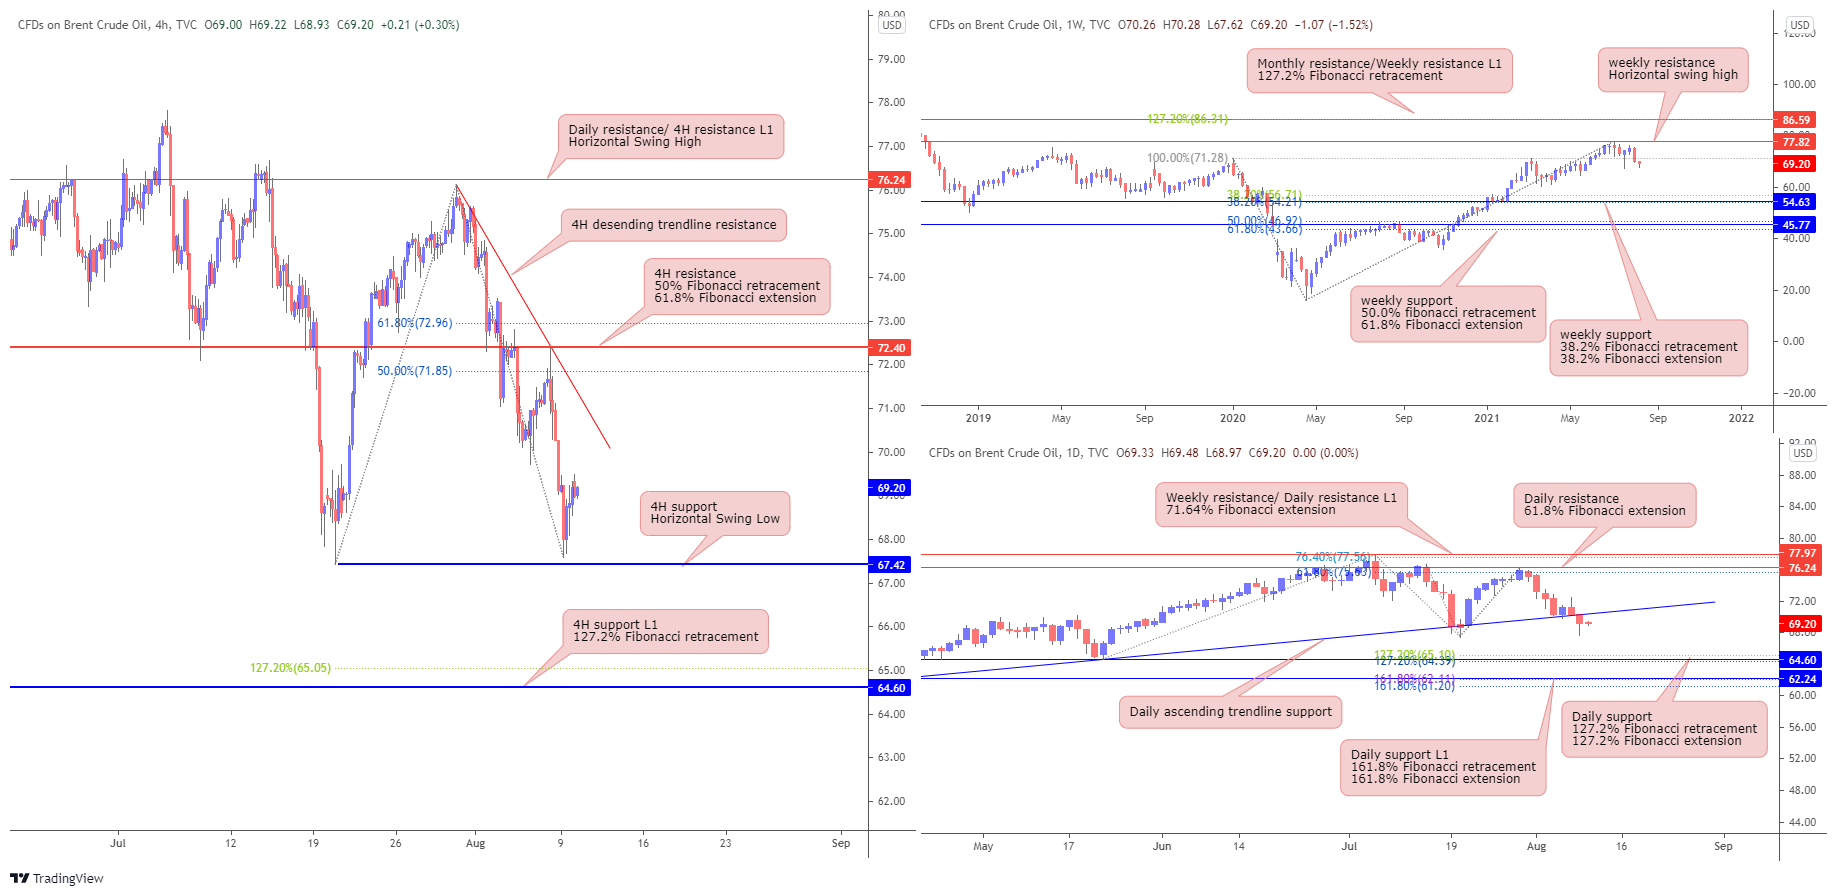
OIL:
On Weekly timeframe, we can see price has reversed from weekly resistance from horizontal swing high at 77.82, price may continue its bearish momentum, it may find support at 54.63 weekly support in line with 38.2% Fibonacci retracement and 38.2 Fibonacci extension. However, if price breaks above 77.82 which is weekly resistance at horizontal swing high, it may swing up towards the Weekly resistance L1 at 86.59 in line with 127.2% Fibonacci retracement.
On the Daily timeframe, we are seeing a similar bearish pressure as price has broken through the ascending trendline support and may find Daily support at 64.6 which is in line with 127.2% Fibonacci retracement and 127.2% Fibonacci extension.
Lastly, on the 4H, price is showing bearish heading towards the 4H support at 67.42 in line with horizontal swing low and may continue to its bearish momentum towards the 4H support L1 at 64.6 in line with 127.2 Fibonacci retracement
Areas of consideration:
- 4 resistance level on the 4H timeframe
- 6 support level on the 4H timeframe
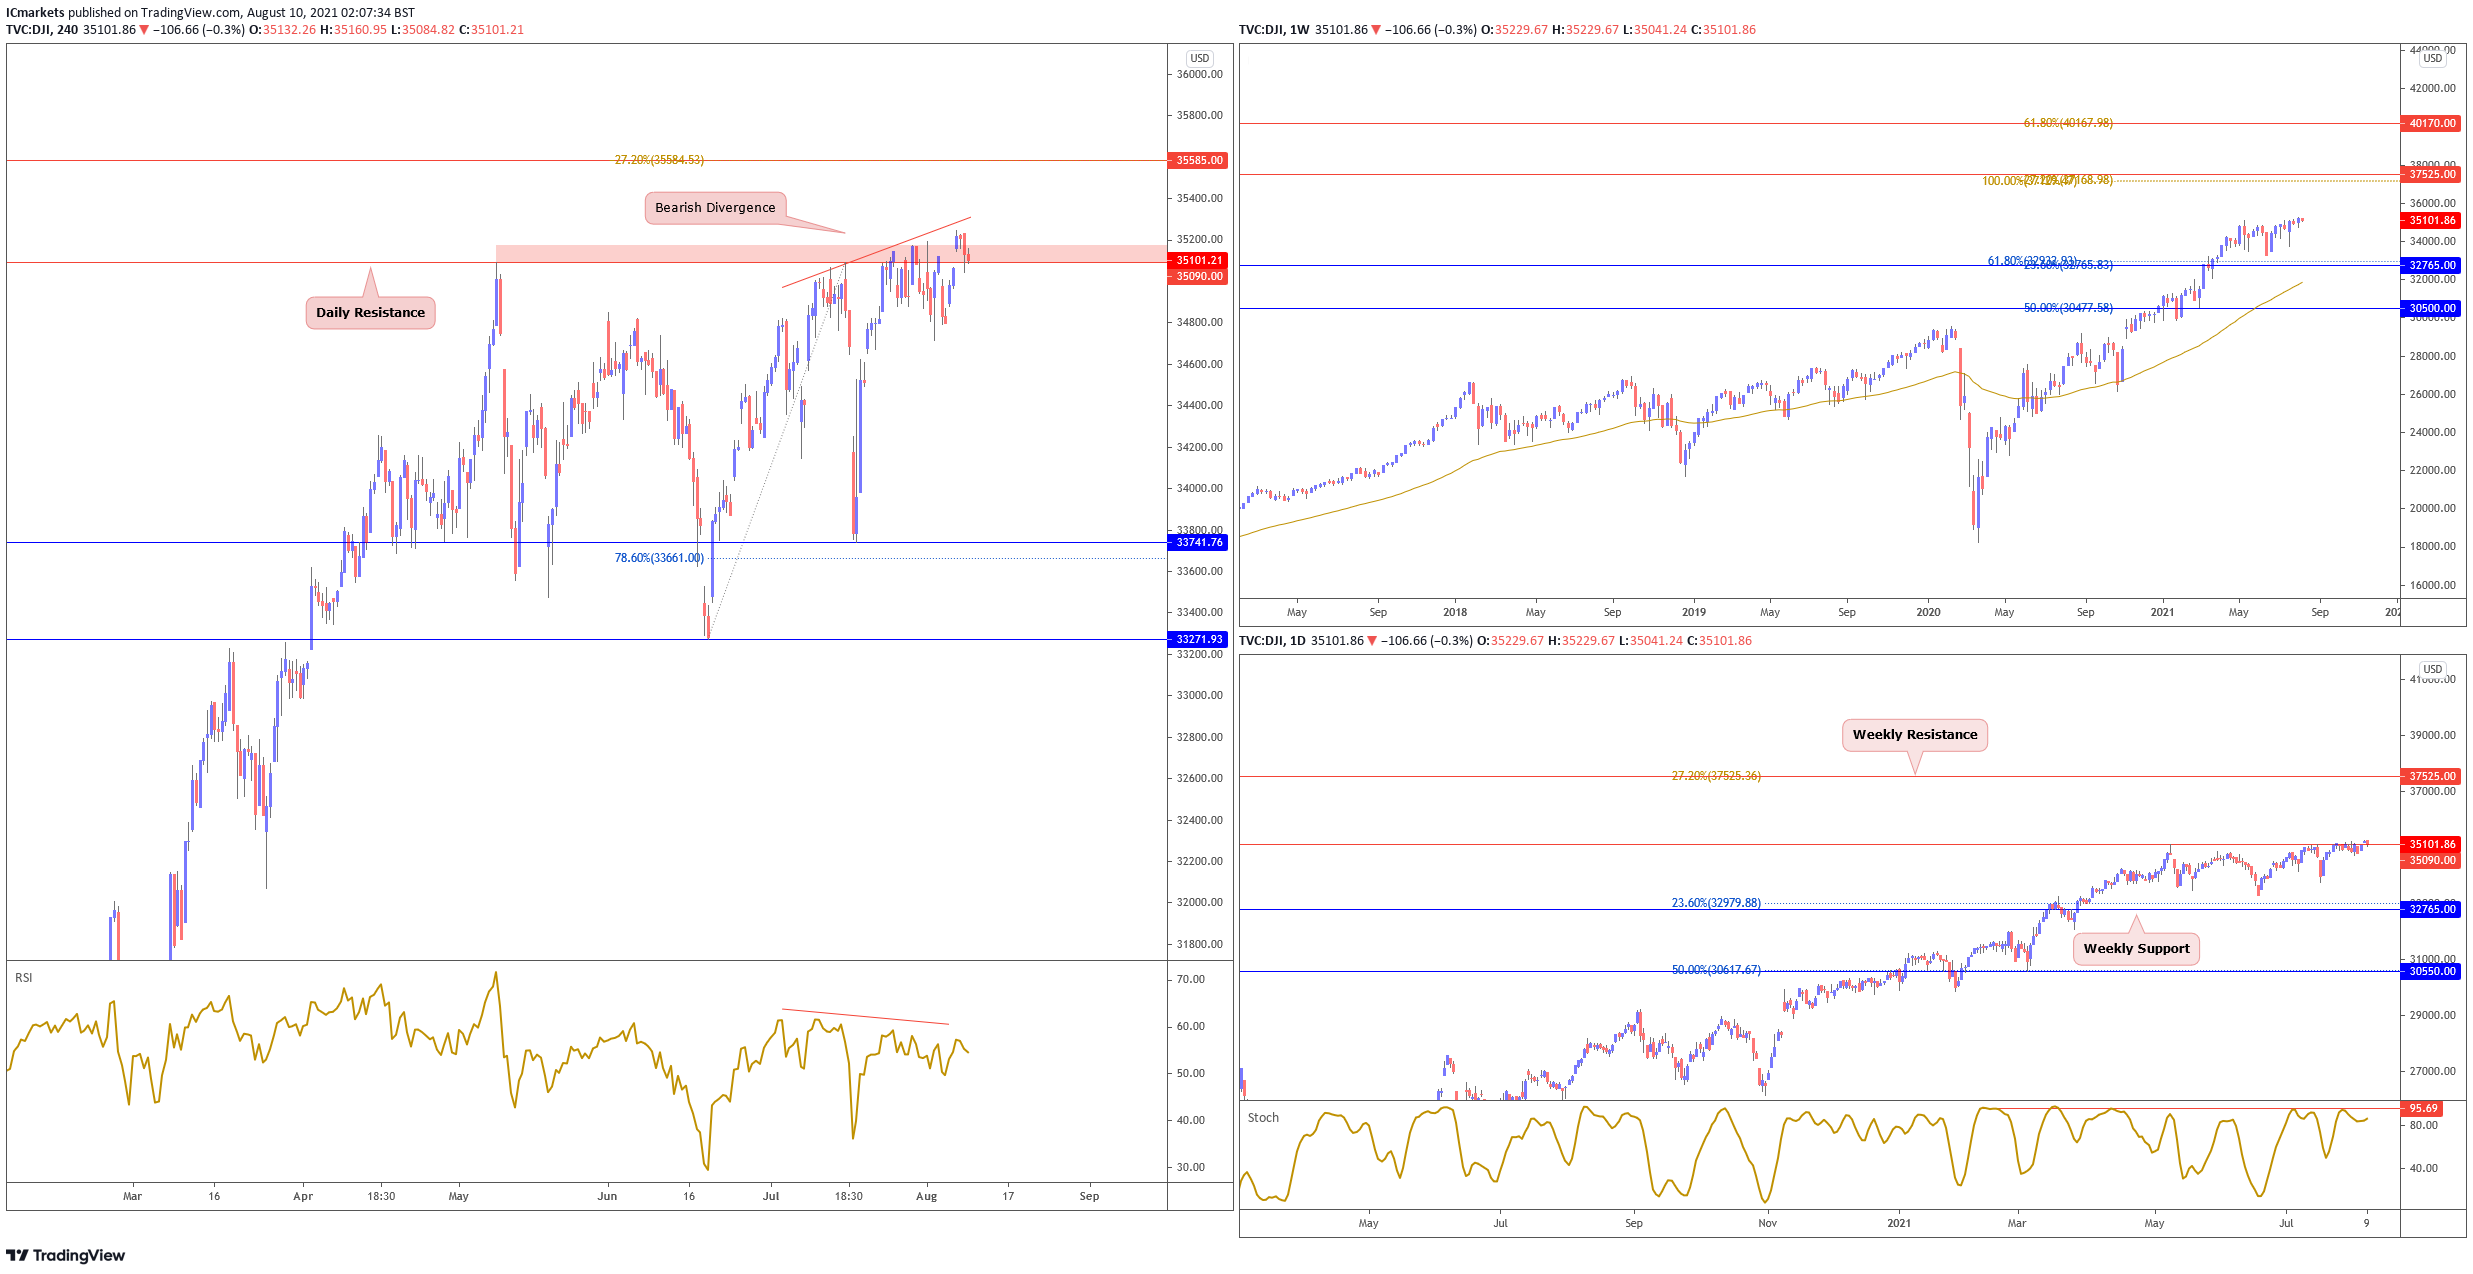
Dow Jones Industrial Average:
On the weekly chart, price is trading sideways holding between 32765 support and 37525 resistance. With price holding above long term moving average, we see a possibility of price facing further bullish pressure. On the daily chart, price is currently trading sideways, still testing and holding below resistance at 35100. With stochastic still holding below resistance where price dropped in the past, we see price facing possible bearish pressure.
On the H4, price continues to test horizontal swing high resistance at the 35100 price level and is likely to plunge and take support at the 33741 price level in line with the 78.6% FIbonacci retracement level. Bearish divergence still remains valid on RSI indicator. There is a chance that price might push towards the 33741 support. Otherwise failure to hold below 35100 resistance should see price swing the other way towards 35585 resistance instead.
Areas of consideration:
- 35100 daily resistance is key level to watch
- Bearish divergence on H4 still valid
The accuracy, completeness and timeliness of the information contained on this site cannot be guaranteed. IC Markets does not warranty, guarantee or make any representations, or assume any liability regarding financial results based on the use of the information in the site.
News, views, opinions, recommendations and other information obtained from sources outside of www.icmarkets.com.au, used in this site are believed to be reliable, but we cannot guarantee their accuracy or completeness. All such information is subject to change at any time without notice. IC Markets assumes no responsibility for the content of any linked site.
The fact that such links may exist does not indicate approval or endorsement of any material contained on any linked site. IC Markets is not liable for any harm caused by the transmission, through accessing the services or information on this site, of a computer virus, or other computer code or programming device that might be used to access, delete, damage, disable, disrupt or otherwise impede in any manner, the operation of the site or of any user’s software, hardware, data or property.


