Many of the best traders began their careers on a frustrating note, experiencing the same difficulties most of us go through.
Trading is a process that can take years to master. Much of the learning consists of governing one’s psychological state and deciphering between high and low-probability situations.
Any trader worth their salt will tell you a trading edge is essential to function in the foreign exchange (forex) market, or any financial market for that matter.
A trading edge is a set of conditions – a junction of key levels (or areas) binding together – collectively forming high-probability trade confluence.
Technical Analysis and Fundamental Analysis
Despite countless theories attempting to explain currency movements, technical and fundamental analysis are widely accepted modes of study to forecast potential direction.
Technical analysis helps determine where and when to trade a market, often on a shorter-term perspective (day trading and scalping). Fundamental analysis, however, helps answer the question why a market is moving in a particular direction, and tends to help define the quality of long-term position trades.
Combining both methods is common. By way of an example, say the underlying fundamentals point to a rally in the dollar, though technical studies on the lower timeframes show price action trading at the underside of strong resistance (a level in the market price had trouble breaking beyond). Once/if the resistance is engulfed, a long could be taken as both technical and fundamental cues now merge.
Although both mediums of analysis can work together, traders tend to favour a technical-based approach, particularly when dealing with lower-timeframe movement, and, therefore, is the main focus going forward in this piece.
Confluence Trading: Technical Analysis
Individual pattern recognition has its merits, though with additional technical tools lining up with the pattern the odds the trade will move favourably increases.
With a wide array of technical variables available and different ways of using them, trading confluence, as you can imagine, takes on a number of different shapes. Below are three possible trading strategies showing areas of confluence coming together:
Trading confluence using price action:
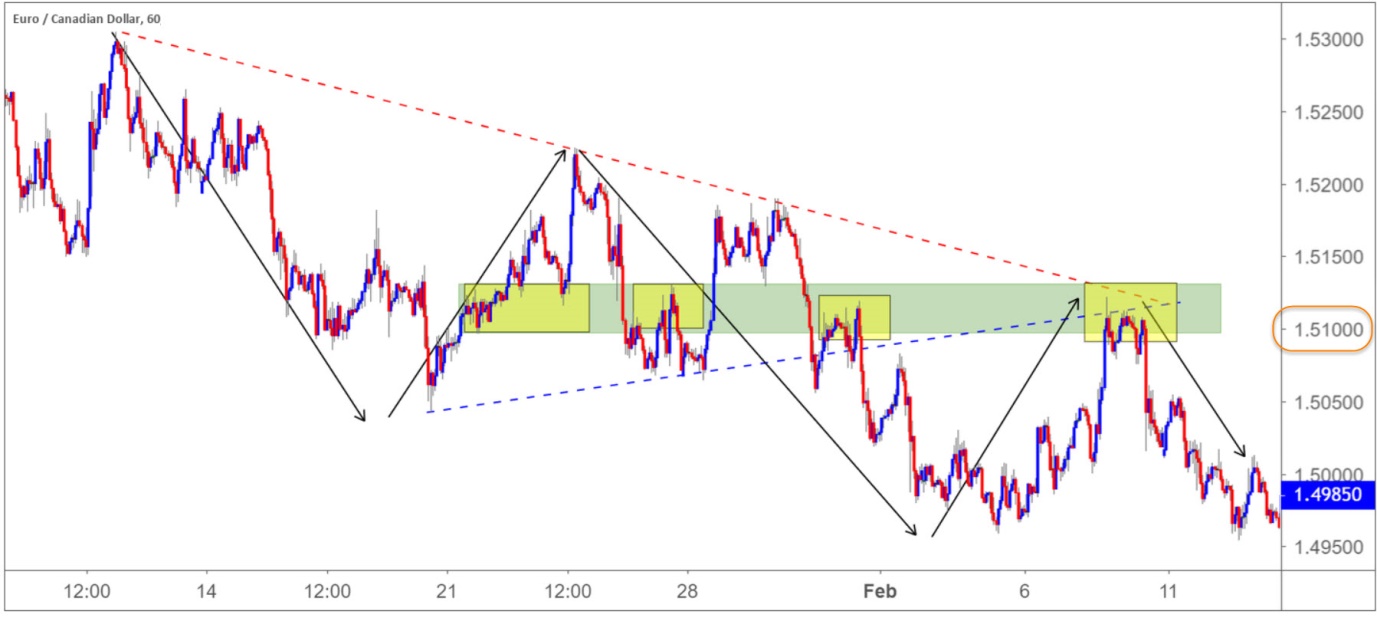
The EUR/CAD H1 chart (figure 1.1) demonstrates a market entrenched within a downtrend, chalking up clear lower lows and lower highs (black arrows). Trend traders draw to this type of price movement, as it provides high-probability trades.
Selling a pullback in-line with the current trend is one thing, selling a pullback that’s bolstered by two trend line resistances (red and blue), a support and resistance area (a support level and a resistance level combined – green) and a psychological level (round number – orange) is another thing entirely. It adds a wealth of confluence to the trade, enhancing the chances of a favourable move.
Traders looking to add additional confirmation to the mix can wait for a candlestick signal to form before pulling the trigger. Several bearish candle rotations took shape on the chart below prior to price action selling off, though traders can enter on any number of bearish candlestick signals: a pin-bar pattern, an engulfing pattern etc.

(FIGURE 1.1)
 Trading confluence using technical indicators:
The GBP/JPY H1 (figure 1.2) chart houses Bollinger bands, an exponential moving average (EMA – black) 50 and an RSI (Relative Strength Index) indicator.
Bollinger Bands are envelopes plotted at a standard deviation level above and below a simple moving average (SMA), usually set to a period of 20 days (approximately the number of trading days in a month). Because the distance of the bands is based on standard deviation, they adjust to volatility in the underlying price.
Moving averages are a way of smoothing out price data over time. The exponential moving average, although similar to the simple moving average (SMA), houses a subtle difference: more weight is given to the latest data in the calculation.
The RSI remains a prominent momentum oscillator – momentum is the rate of the rise or fall in price. The RSI calculates momentum as a ratio of higher price closes over lower closes. Markets experiencing more upside momentum naturally have a higher RSI reading.
Trading setups using the noted indicators:
- Trade the outer limit of the Bollinger bands when merging with the EMA 50. Two opportunities are seen on the chart below, one a short, the other a long (green).
- An alternative to the above is, again, trading the outer limits of the Bollinger bands, though only when the RSI indicator is either testing overbought/oversold territory, and/or producing a divergence reading (yellow)

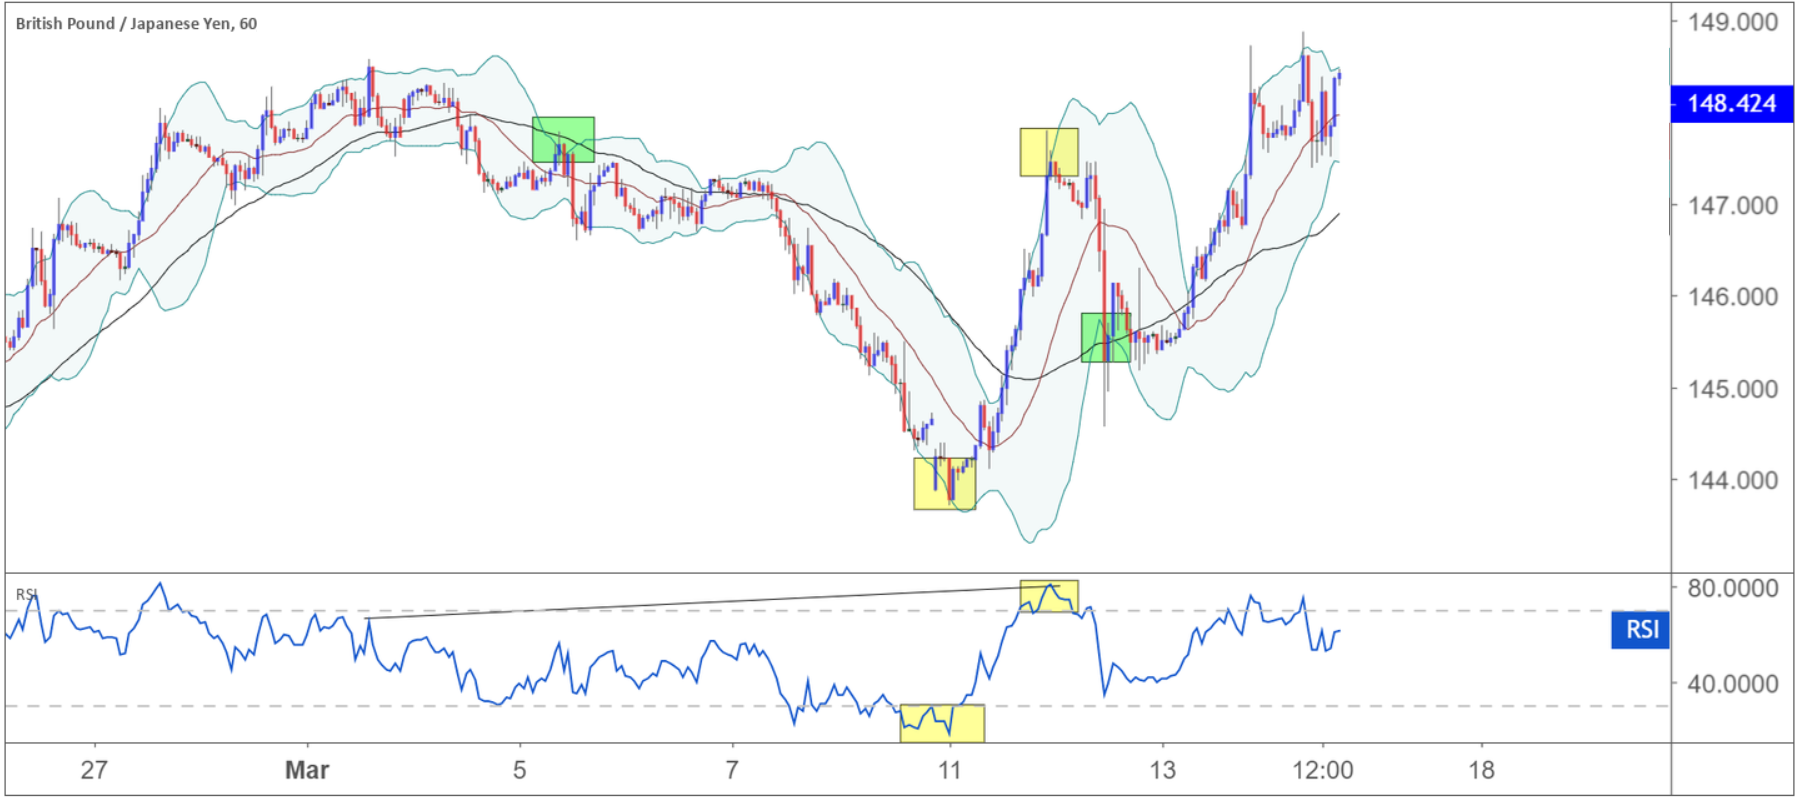
(FIGURE 1.2)
Trading confluence using a combination of technical indicators and price action:
An alternative is to combine indicators and price action to form confluence. This is a popular approach.
Using the same GBP/JPY chart (figure 1.3), applied to the canvas is a trend line resistance (black), an EMA 50 (blue), a 38.2% Fibonacci retracement level (green) and the RSI indicator presenting a mild divergence reading (red). The orange zone is a point all of the aforementioned indicators unite, forming a tight area of confluence to sell, which, in this case, provided enormous risk/reward.
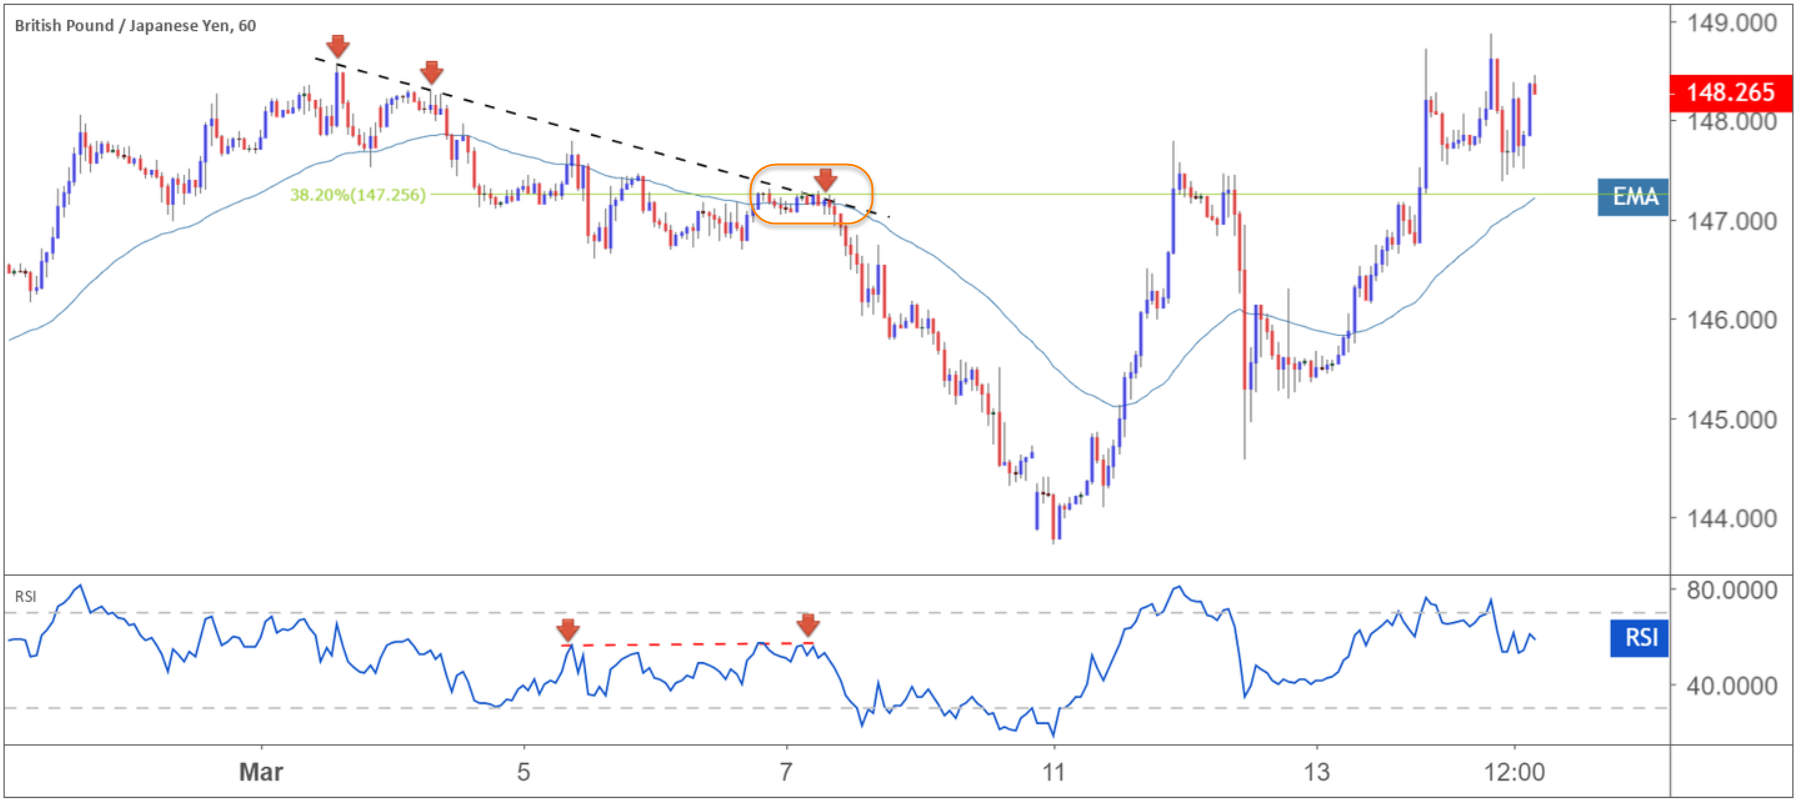
(FIGURE 1.3)
How Much Trading Confluence is Enough?
Are two variables sufficient to offer a trading edge? How about three, four or even five?
One way a trader answers the question is to back test (or forward test using a simulated trading account).
Don’t, however, make the fatal mistake thinking more variables applied to the charts will somehow offer the holy grail of trading. It won’t.
A back test demonstrates how many variables a trading strategy requires to operate consistently. How long should a trader back test for is down to the individual trader. If you’re scalping on the lower timeframes, a year or two back testing results should suffice. Swing traders may opt to test over a longer timescale of five to ten years. This offers a large enough sample size to work with and make any alterations needed to operate with a high-probability trading strategy.
Trading areas of confluence offers an incredibly strong edge. Without this, currency trading successfully is difficult. Take your time testing which parameters work best and ultimately suit your personality and trading style.