Nowadays, modern trading platforms offer a rich diversity of technical indicators – you could say you’re almost spoilt for choice. The Metatrader 4 platform (MT4), for example, comes fully loaded with 30 built-in indicators and 2000+ custom indicators. Unfortunately, this often draws newer traders into unchartered terrain.
Understanding the subtle nuances and testing each indicator can take months, or even years. To help shorten this curve, the research team at IC Markets have joined forces and compiled three of the most prominent well-rounded indicators available today to get you started.
The Relative Strength Index (RSI)
Developed by J. Welles Wilder in June 1978, the Relative Strength Index, or RSI, is a momentum oscillator. Wilder noted a change in momentum is often (but not always) a precursor to a change in direction – momentum is the rate of change in price movement.
The RSI is a popular leading indicator among market technicians, and comes as standard on MT4 and MT5 platforms offering a 14-period setting. The RSI measures the strength of a market against its historical price change by comparing ‘up and down’ days.
The indicator ranges from 0 to 100, and, like many momentum oscillators, offers several defining features to generate actionable signals.
A primary use is identifying overbought and oversold conditions. Traditionally, an RSI value outside 70 indicates an overbought reading, signifying the possibility of a fading market. An RSI value below 30, however, proposes an oversold/potentially strengthening environment (see figure 1.1).
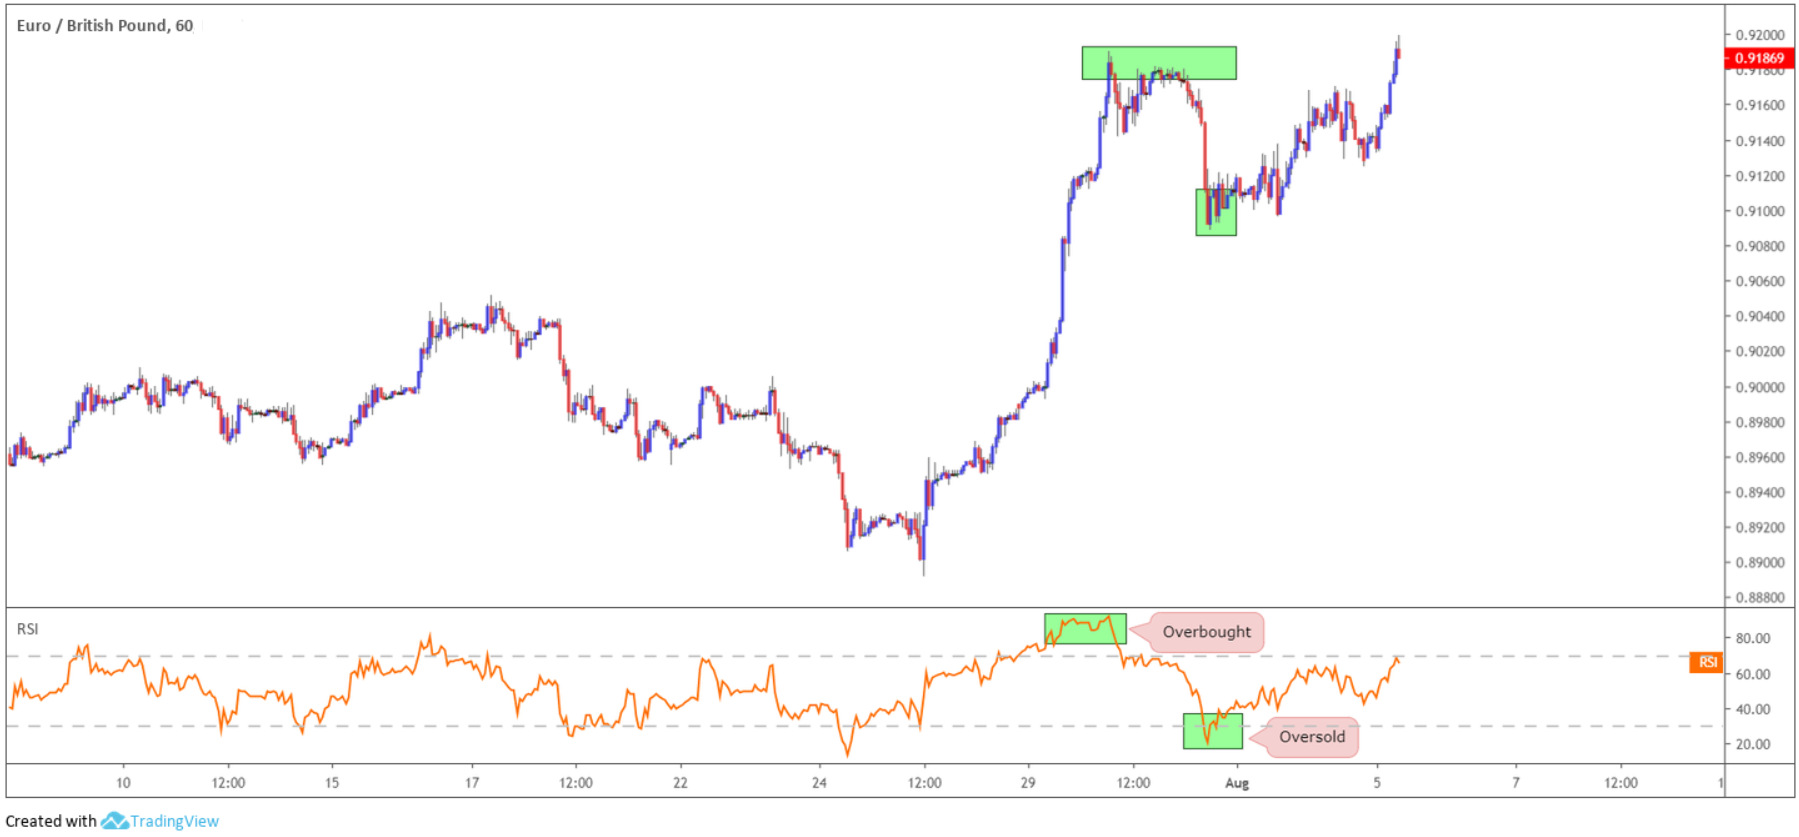
(Figure 1.1)
Because the RSI is prone to false signals, analysts often adjust standard levels based on underlying market conditions. Some opt to use 75 and 25 as overbought and oversold extremes, while others use 80-20 as illustrated in figure 1.2.
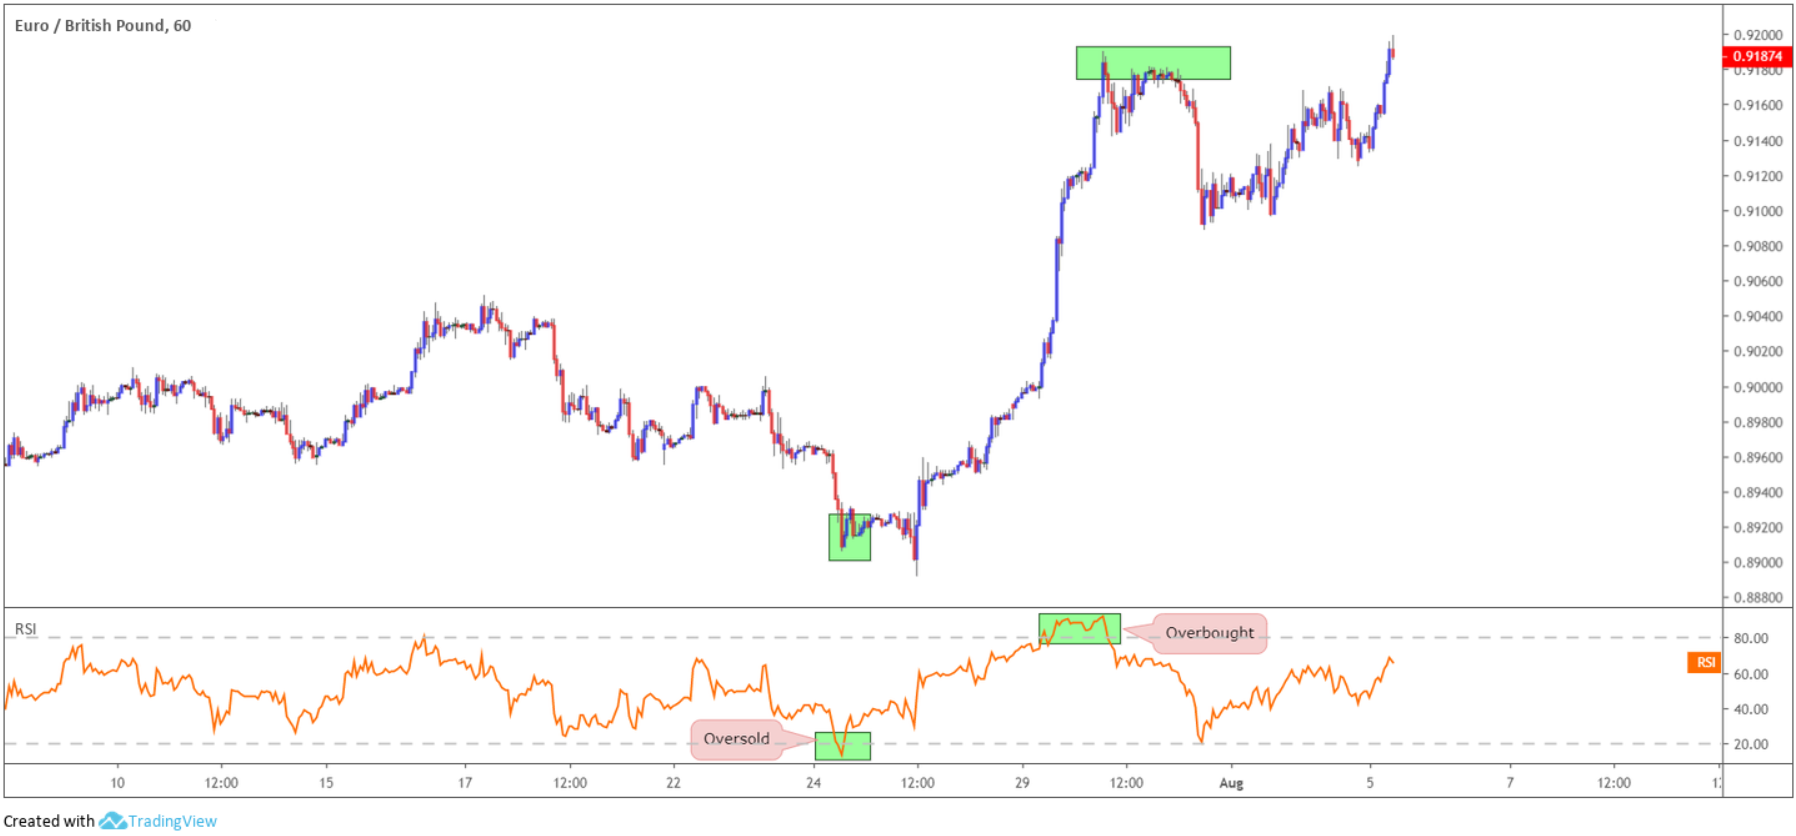
(Figure 1.2)
Throughout strong trends, the RSI can also remain overbought or oversold for extended periods of time. This is important to recognise as it leads to false signals, as shown in figure 1.3. As you can see, the losses soon mount.
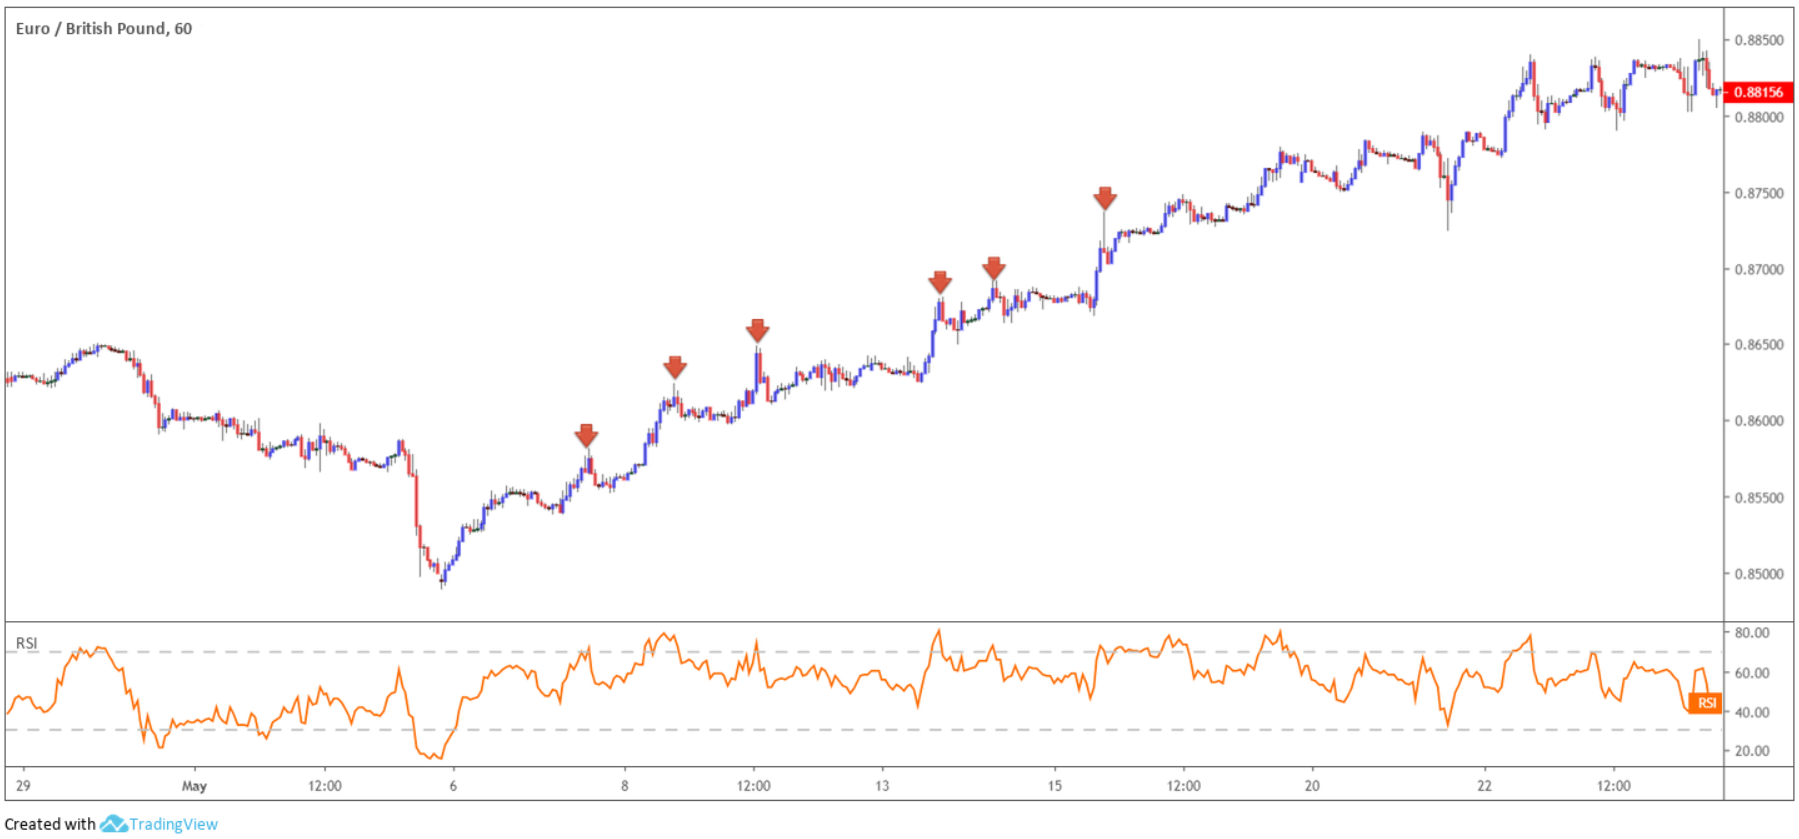
(Figure 1.3)
Similar to other momentum oscillators, divergences with price action often provide warning of a trend reversal.
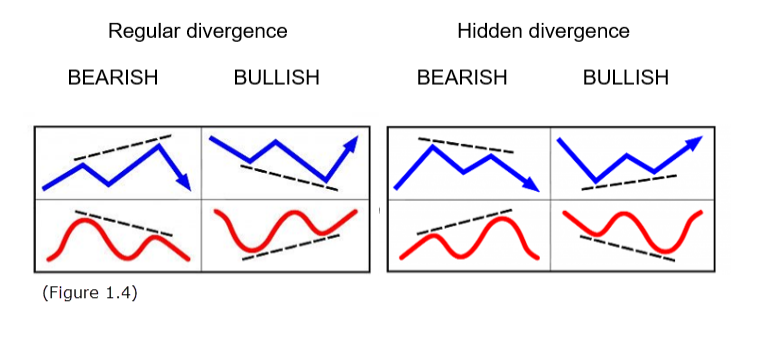
Divergence occurs when the underlying price prints a new high/low that is not confirmed by the RSI indicator.
Figure 1.4 shows two examples of divergences seen regularly in the market. Blue signifies price action and red represents RSI movement.
Divergence signals offers an effective edge on the price chart, enabling traders to spot a potentially weakening/strengthening market. Divergences are visible across all timeframes, but for the best results divergence observed on higher timeframes tends to suggest higher-probability signals.
Figure 1.5 shows regular bullish divergence in motion (blue lines):
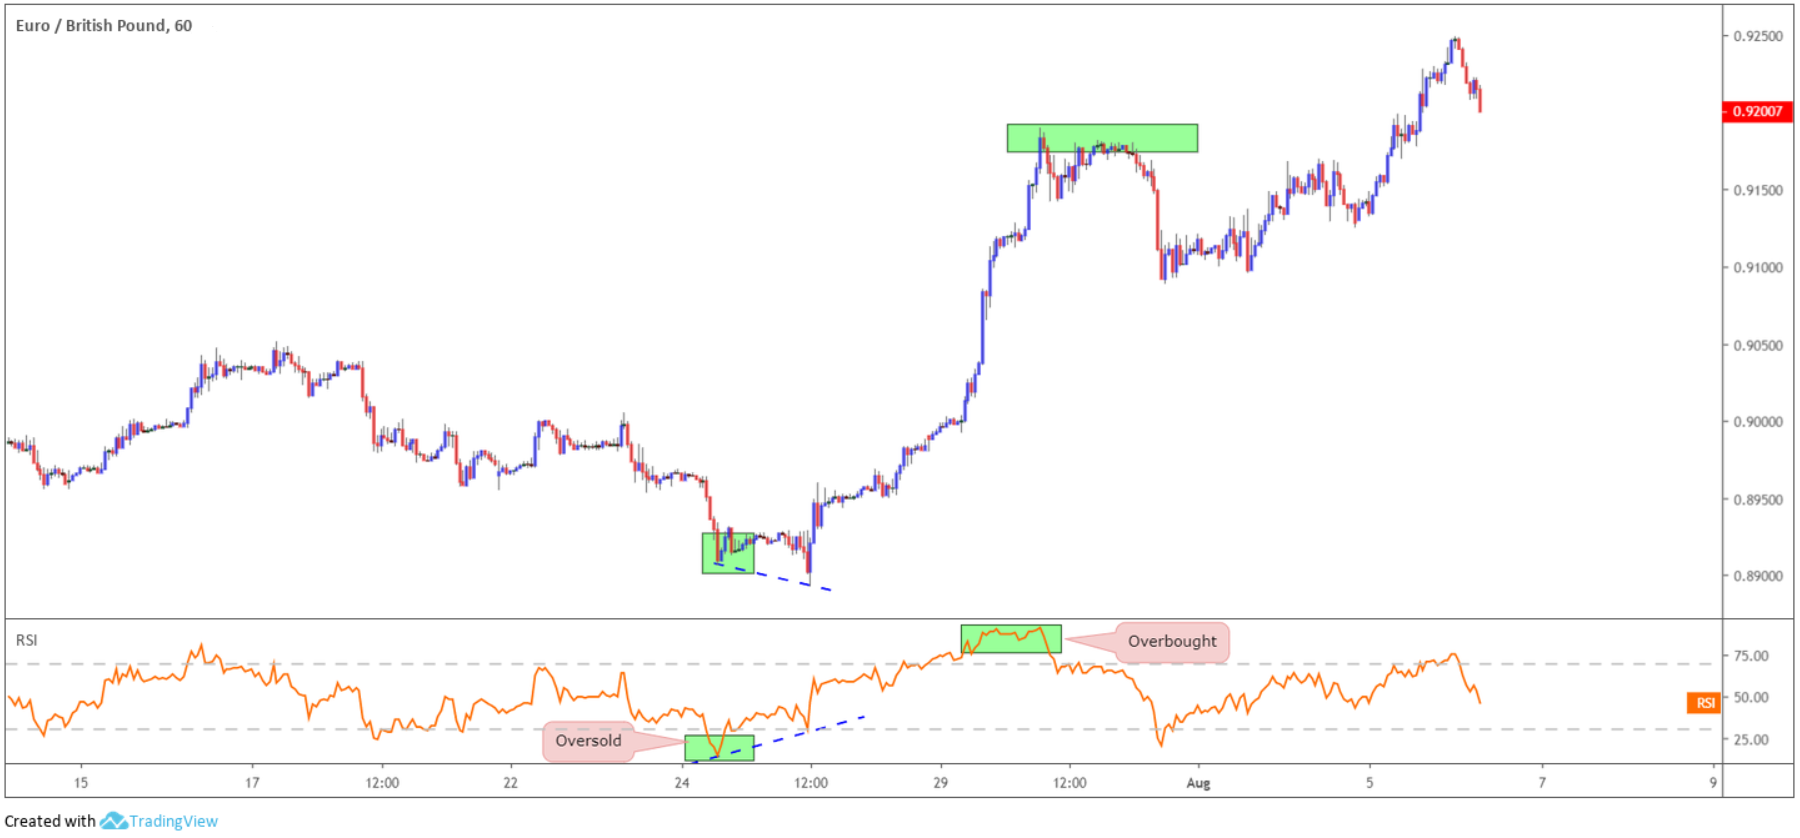
(Figure 1.5)
The RSI moving average also formulates patterns that precede price action. Trend lines, support and resistance, double bottoms and tops, triangles, flags and even head and shoulder patterns are some of the examples regularly observed.
A basic example can be found in figure 1.6, whereby the RSI trend line break preceded a move lower in price:
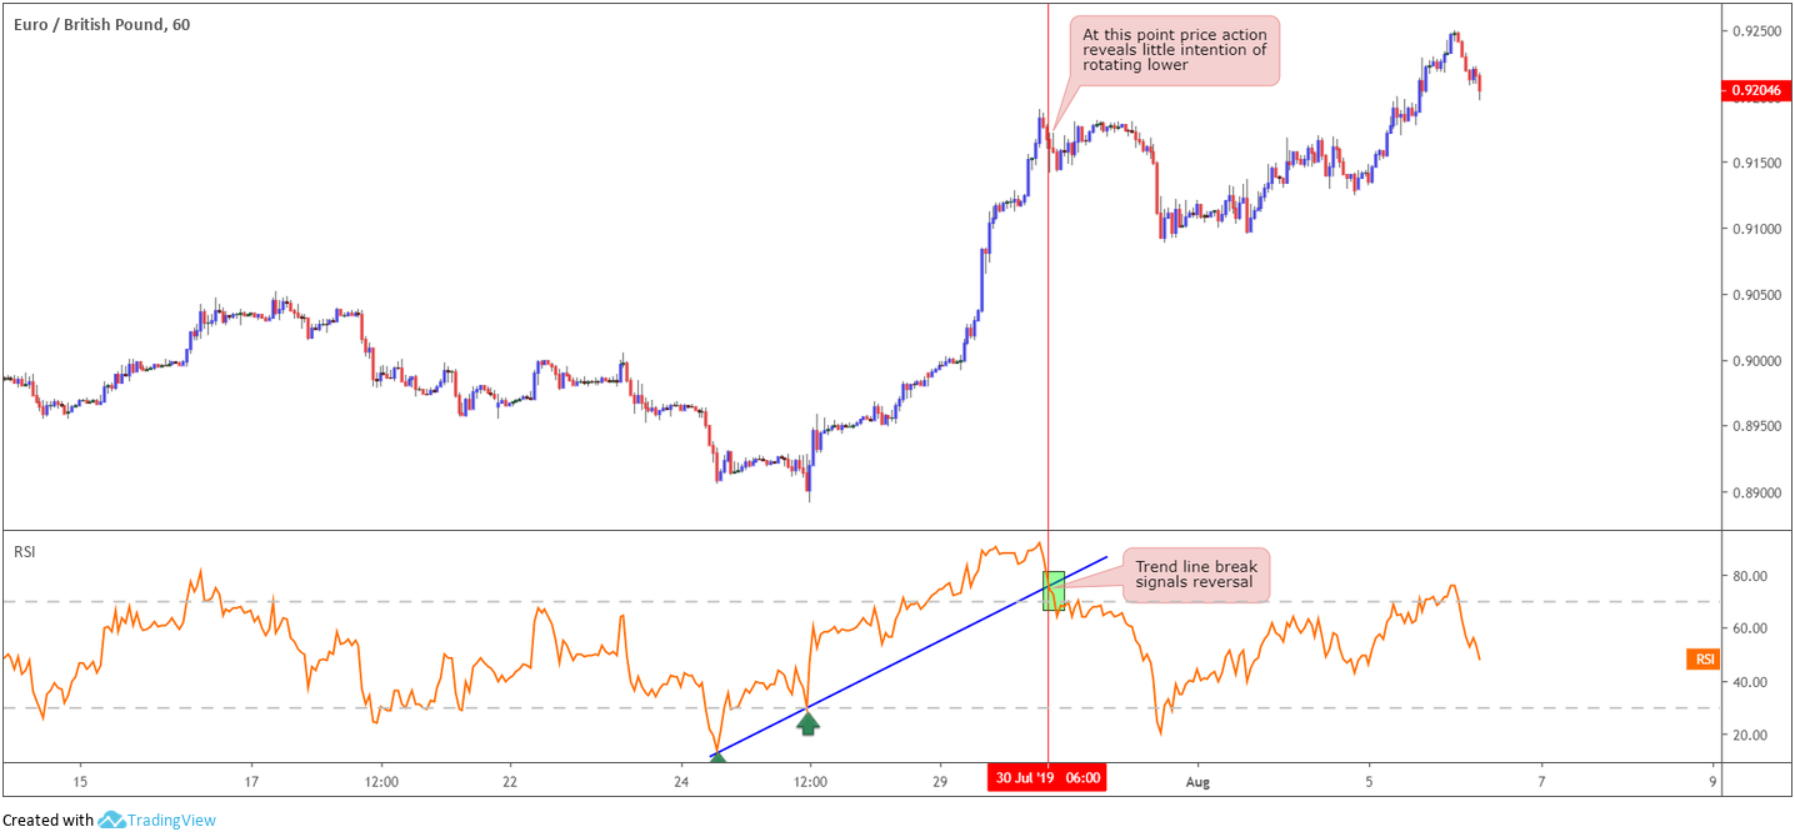
(Figure 1.6)
The Average True Range (ATR)
Welles Wilder also created the Average True Range (ATR) and featured it in his book: New Concepts in Technical Trading Systems. Published in 1978, the book featured several classic indicators, such as the Relative Strength Index presented above.
Like the RSI, the ATR is a leading indicator and comes as standard on MT4 and MT5 platforms, heading a default setting of 14. The setting communicates the number of periods calculated.
The ATR is a volatility indicator that shows how much a market moves, on average, over a given time frame. A new ATR reading is calculated as each time period passes.
As illustrated in figure 1.7, the ATR window displays the daily ATR value, currently testing waters beneath the 60-point mark. The ATR appears on the chart in the shape of a moving average and measures the average range of a pre-determined number of sessions, in the case of the chart below, 14 days. What this does is give you a probable range of 60 points to work with going forward.
When the ATR line rises in value, this signals an increase in volatility. What the ATR does not do is signify which direction the market is headed.
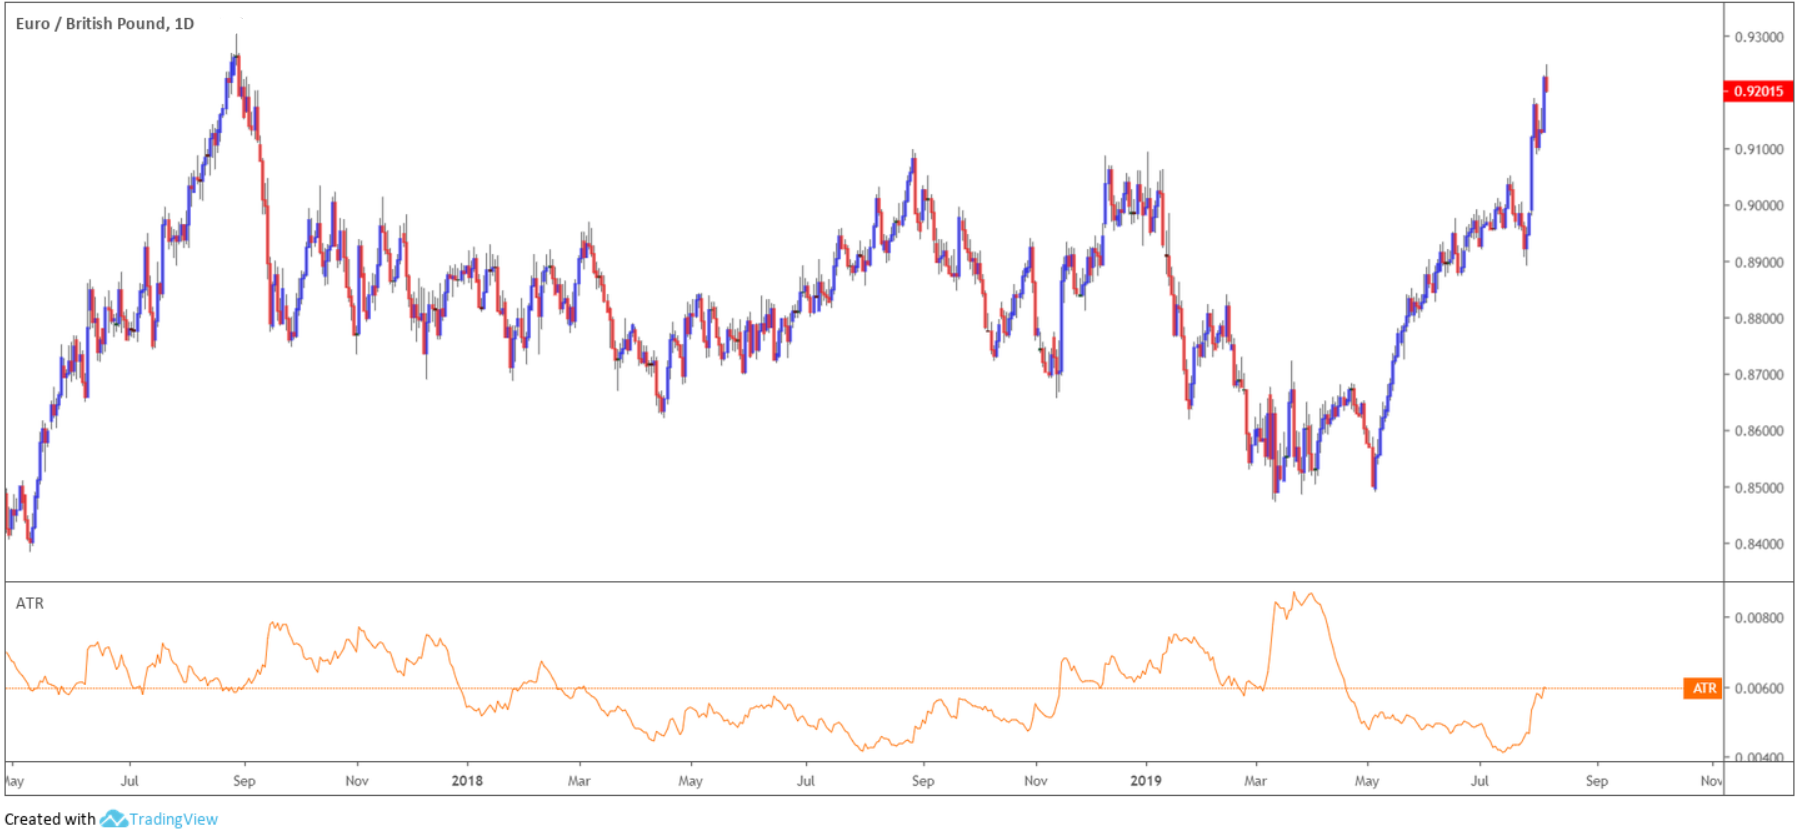
(Figure 1.7)
To understand the indicator better (see figure 1.8), here’s its calculation. Finding the average first requires finding the true range (TR). The TR is the greatest of the following:
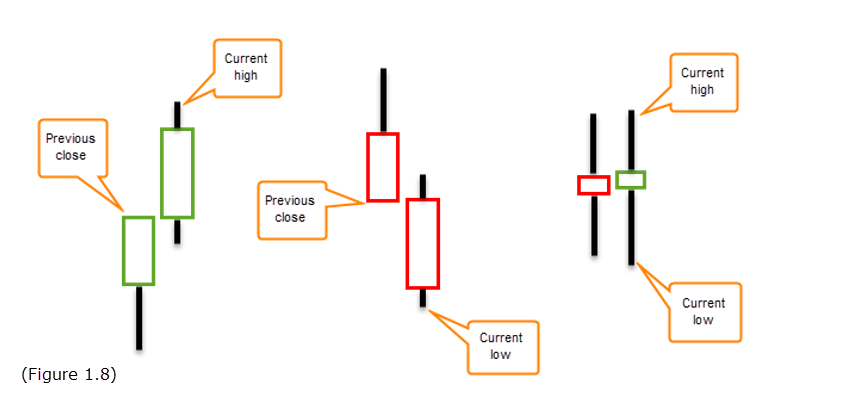
- The difference between the current bar high and low.
- The absolute value of the difference between the prior bar close and the current bar high.
- The absolute value of the difference between the prior bar close and the current bar low.
There are several ways one can use this indicator to their advantage. A key use is determining how much a pair is likely to move going forward. For example, knowing the unit is likely to move at least 60 points, stop-loss placement can be adjusted according to this value. Another method of incorporating the ATR is as a price filter for confirmation of a breakout, as the ATR expands and contracts over time as volatility fluctuates.
Moving averages
Moving averages (MA) are lagging indicators and come as standard on MT4 and MT5 platforms. A moving average is calculated for each successive period interval. The result displays a smooth line representing the successive, average prices, essentially dampening the effects of short-term oscillations.
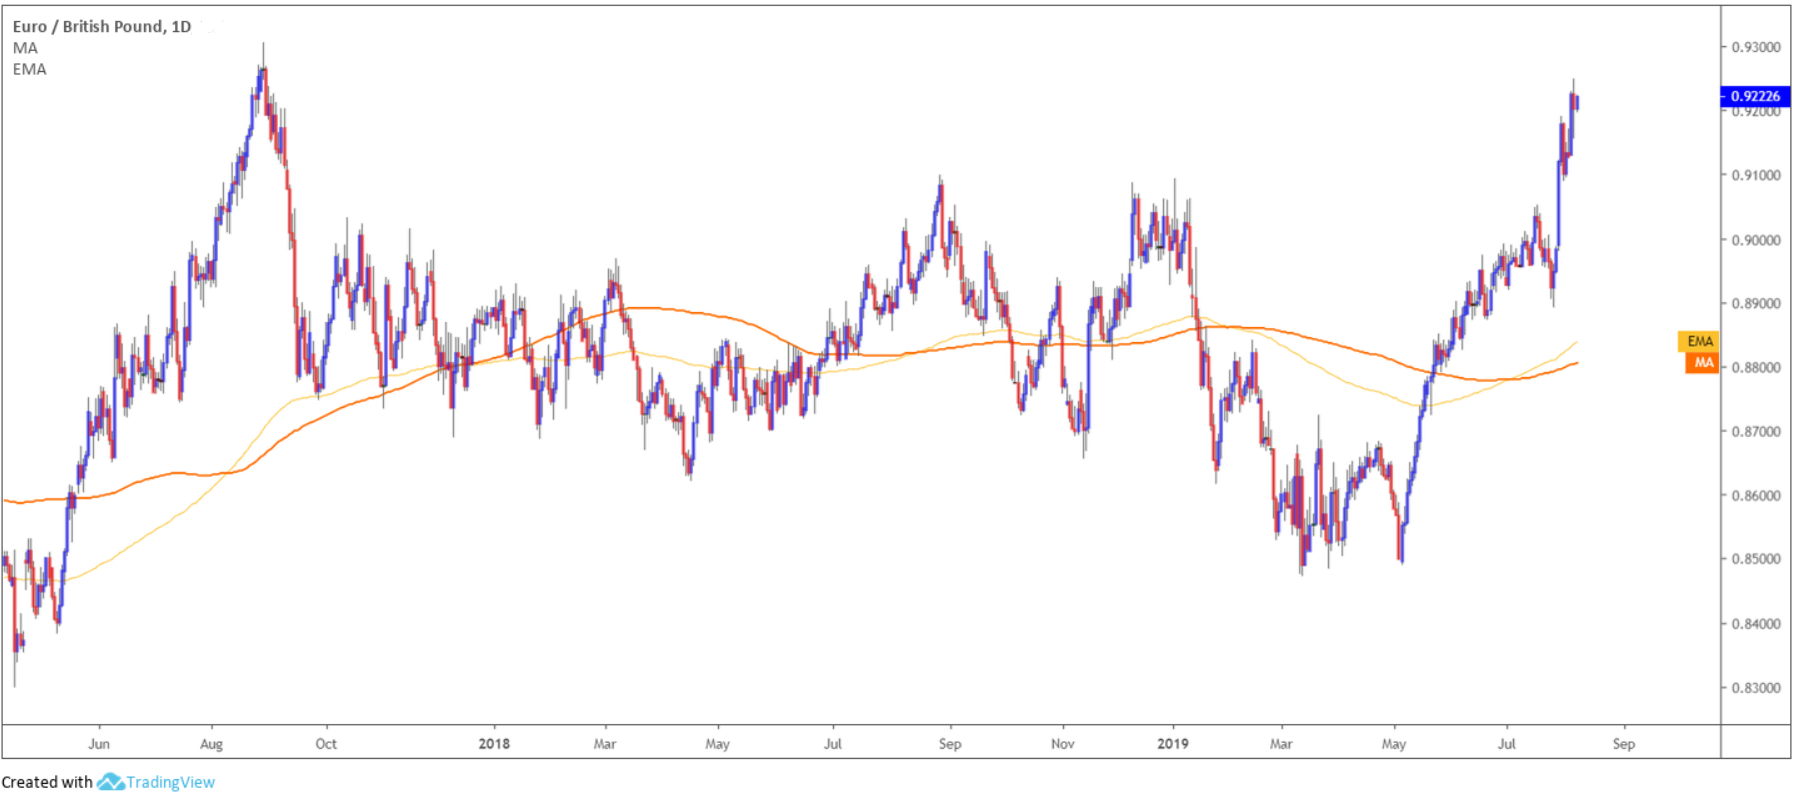
Although several moving average variations are available, the following focuses on two of the most popular and widely used: the simple (SMA) and exponential (EMA) moving averages, as shown in figure 1.9 calculated using 200 days – a conventional indicator that traders and the media often highlight. The slower the moving average, the smoother it’ll appear on the chart as it’s calculated over a longer period. The 200-day moving averages are relatively slow – notice that despite the ebbs and flows of surrounding price action, the lines remained reasonably content.
(Figure 1.9)
The 200-day moving average is perceived to be the dividing line between a currency pair that is technically healthy and one that is not. Many traders also use moving averages to determine profitable entry and exit points.
What’s the difference between the SMA and EMAs? The only difference is the sensitivity between the two calculations. The EMA applies a higher weighting to recent prices, whereas the SMA assigns equal weighting to all values.
Plotting a faster moving average, such as the 14-day EMA (see figure 1.10) you’ll notice it hugs price action on the daily timeframe far more than the 200-day EMA (blue).
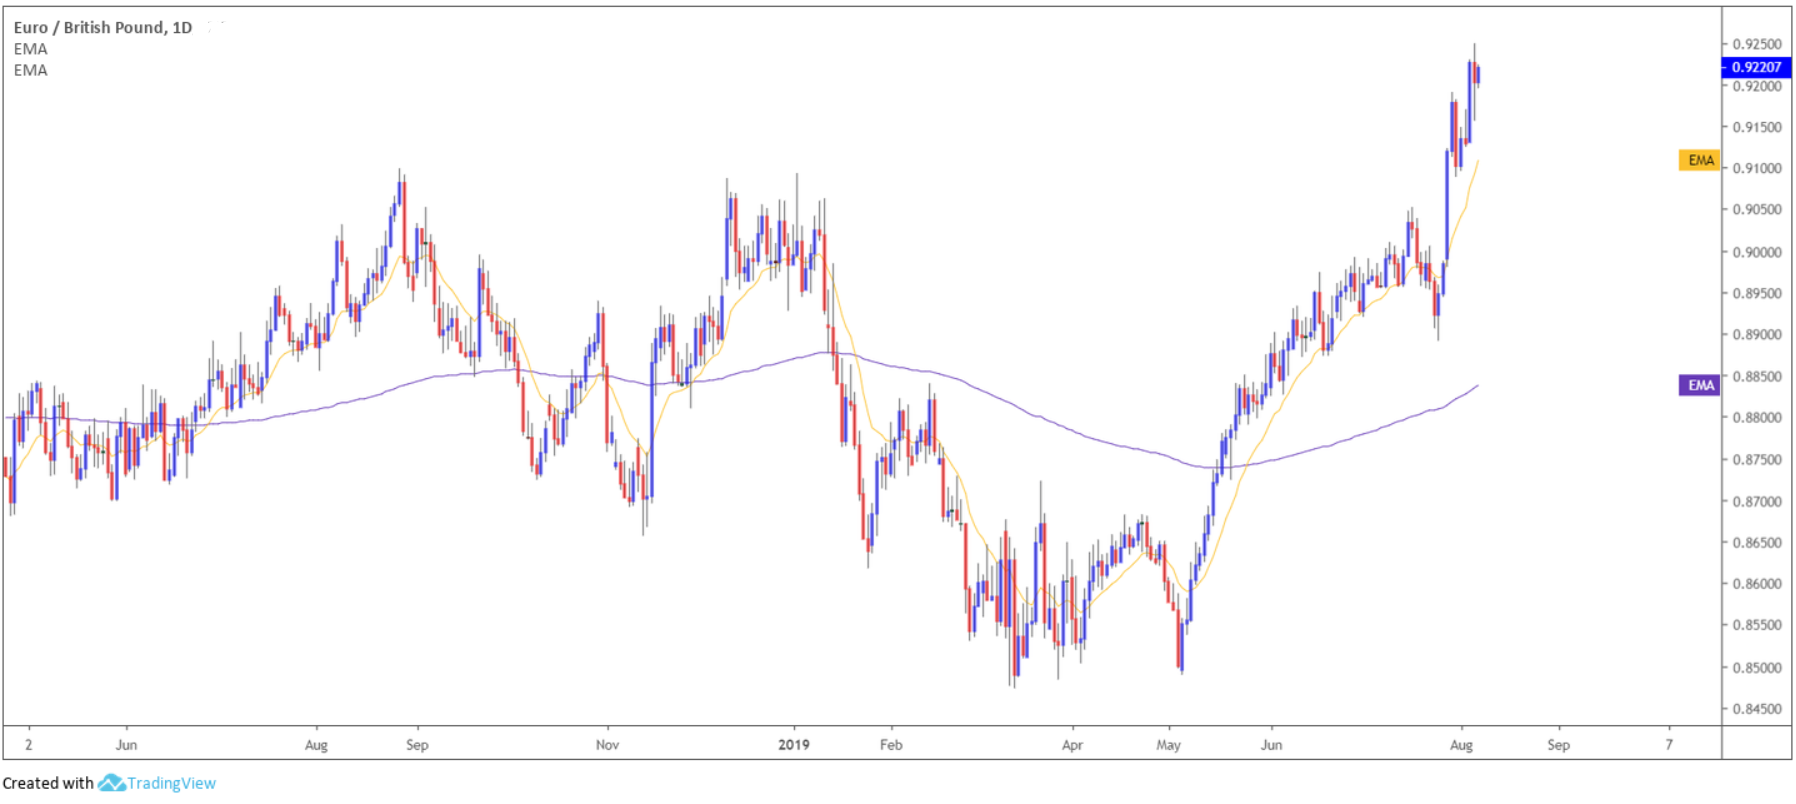
(Figure 1.10)
In order to calculate the simple moving average, you simply divide the number of price closing points by the total number in the series. The EMA would put more weight on recent prices: days 3, 4 and 5 would therefore be slightly more sensitive. All platforms perform this calculation for you automatically within seconds.
Using moving averages:
One well-known technique is moving averages help identify trend. If price action remains above the moving average, the uptrend is considered intact and weakening upon moving below the moving average. Using figure 1.10, we can see the uptrend remains unbroken on both the shorter and longer-term moving averages.
Another popular technique is the moving average crossover whereby a short-term MA crosses a longer-term MA. This is used as either part of an entry method, or to indicate a potential trend change. Using the 50 and 20-day EMA calculations, figure 1.11 reveals a number of potential entry points where the 20-day EMA crossed the 50-day EMA (black arrows).
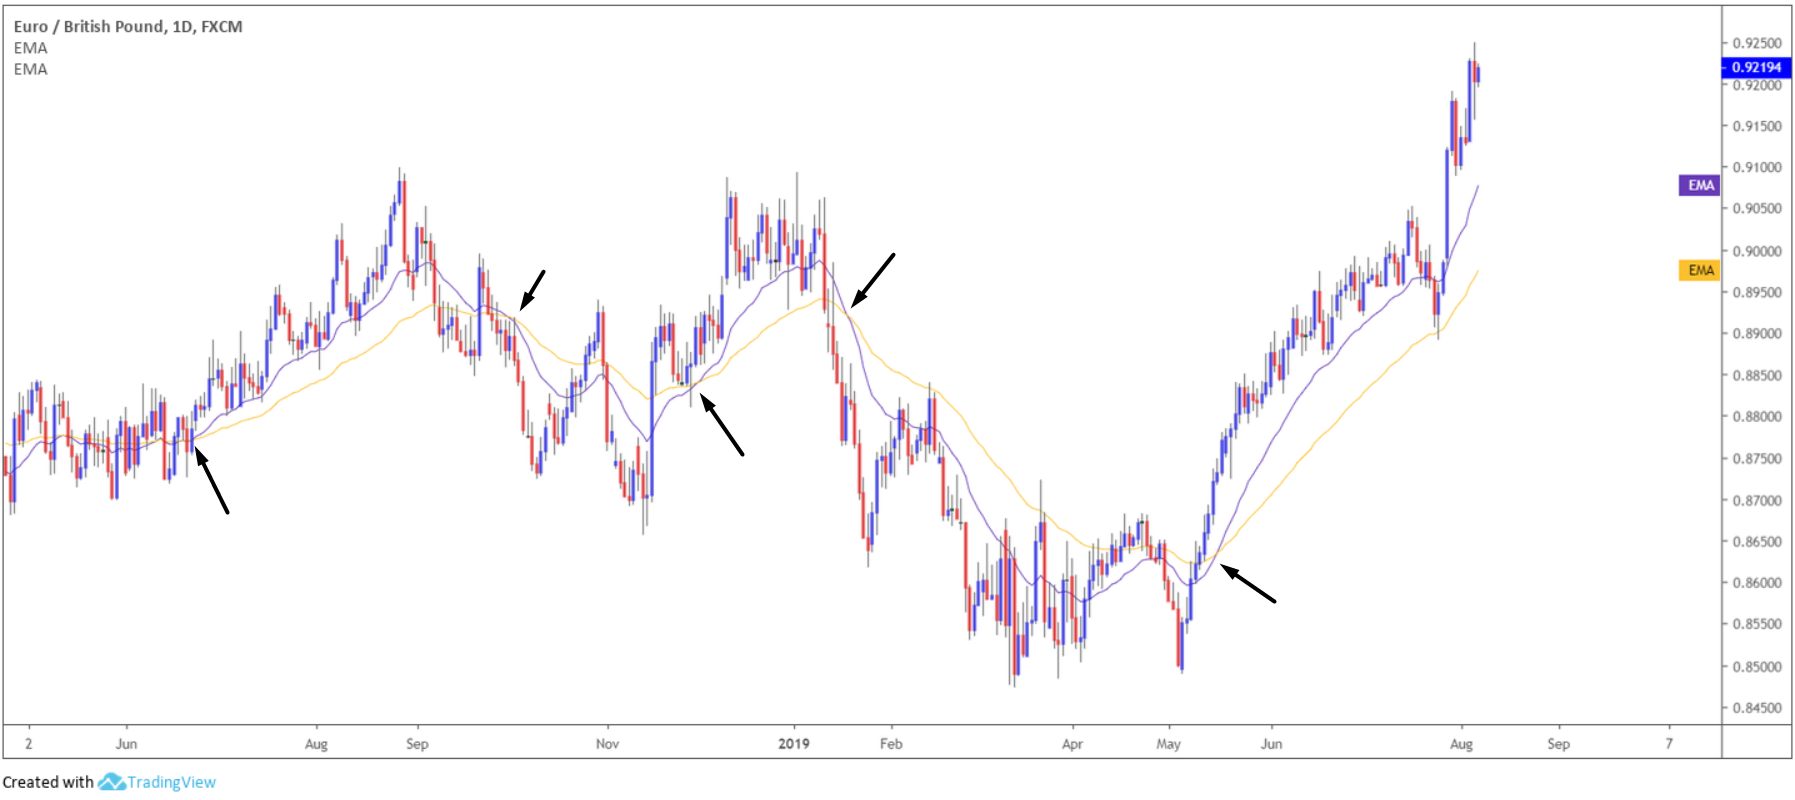
(Figure 1.11)
Another use is dynamic support and resistance. Using the 50-day EMA in figure 1.12 the pair respected the moving average several times as support and resistance.
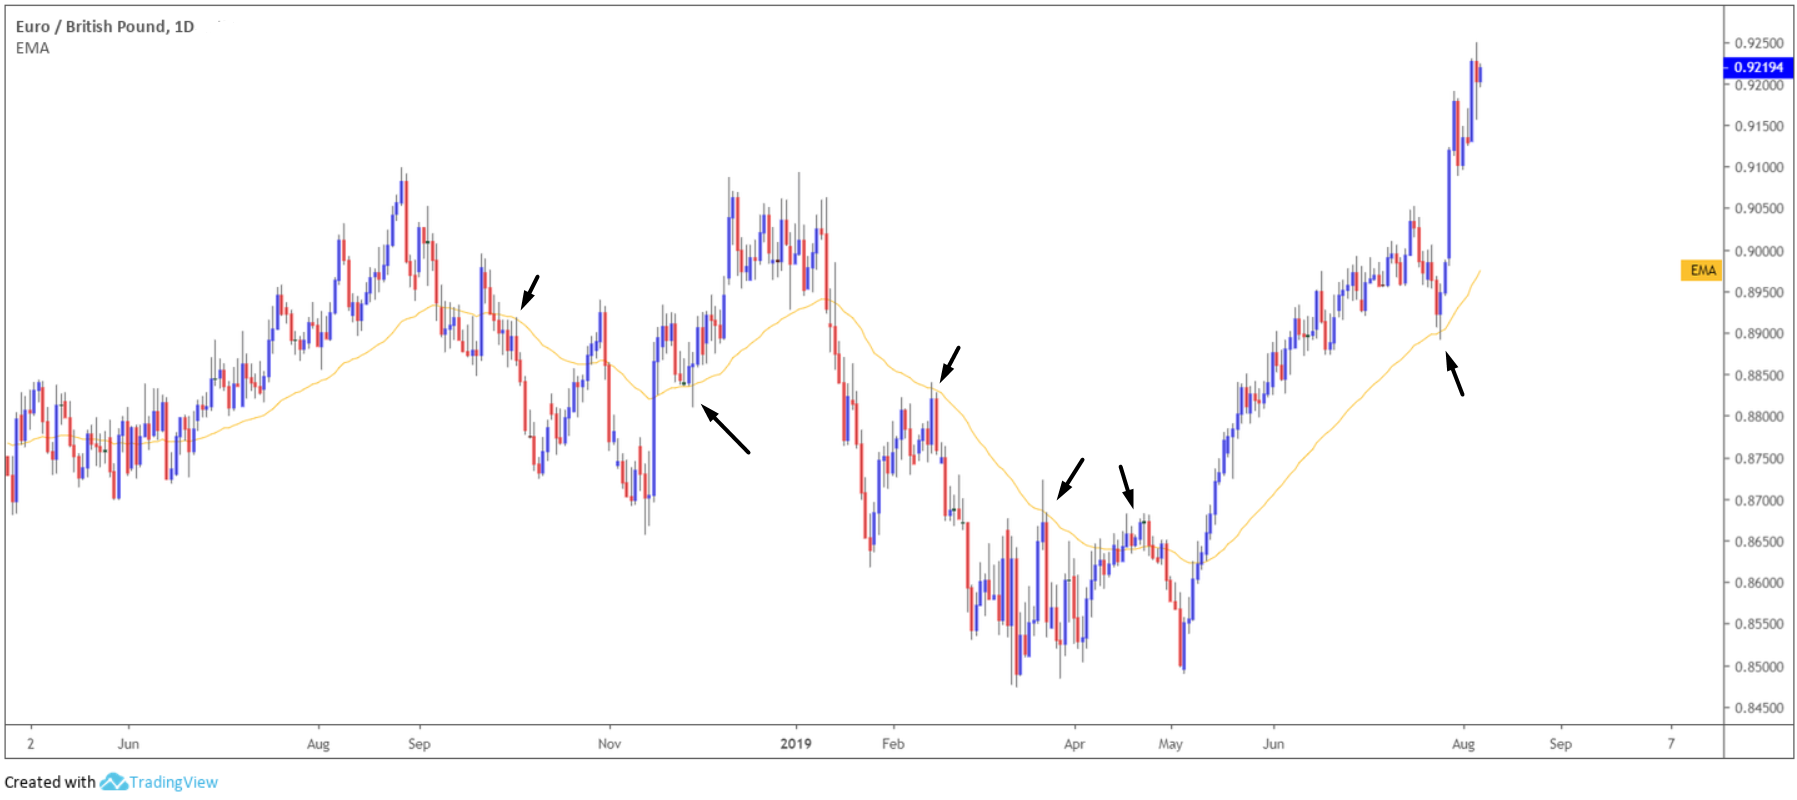
(Figure 1.12)
What’s the best indicator?
Selecting which indicator best suits your trading style is never an easy task. The three indicators highlighted above boast appealing qualities, though require thorough testing before employing them in live conditions.
Overall, moving averages are probably the most popular technical indicator on the list, though there are several other forex indicators worthy of a look if you have the time: the MACD (Moving average convergence divergence), Bollinger bands, the Stochastics indicator, for example.
The general rule of thumb when using indicators is never use them in isolation, or flood the charts with too many indicators. Indicators are typically used as confirmation alongside a price action signal.