
DXY:
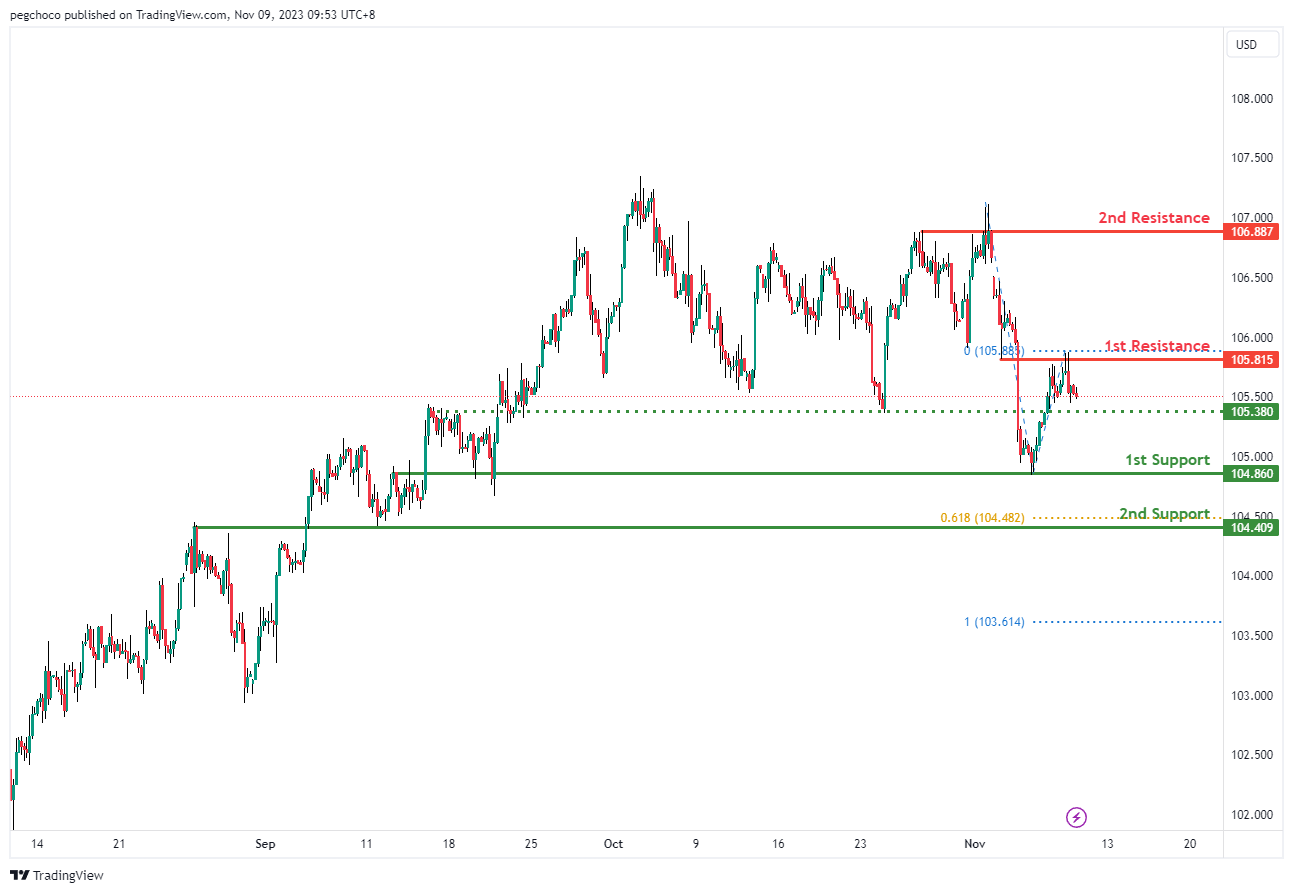
The DXY chart currently displays a bearish overall momentum, indicating the potential for a bearish continuation towards the 1st support level.
The 1st support at 104.86 is identified as an overlap support, which strengthens its significance as a potential level where the price could find buying interest.
Moreover, the 2nd support at 104.40 is also considered an overlap support, and it exhibits a confluence with the 61.80% Fibonacci Projection, indicating strong technical support. This makes it a crucial level to watch for potential reversals or price reactions.
On the resistance side, the 1st resistance at 105.81 is categorized as an overlap resistance, suggesting it may act as a level where the price encounters selling pressure.
Furthermore, the 2nd resistance at 106.88 is noted as a multi-swing high resistance, adding to its significance as a potential barrier to the price’s upward movement.
Intermediate support at 105.39 is identified as a pullback support, providing an additional area to monitor for potential price reactions.
EUR/USD:
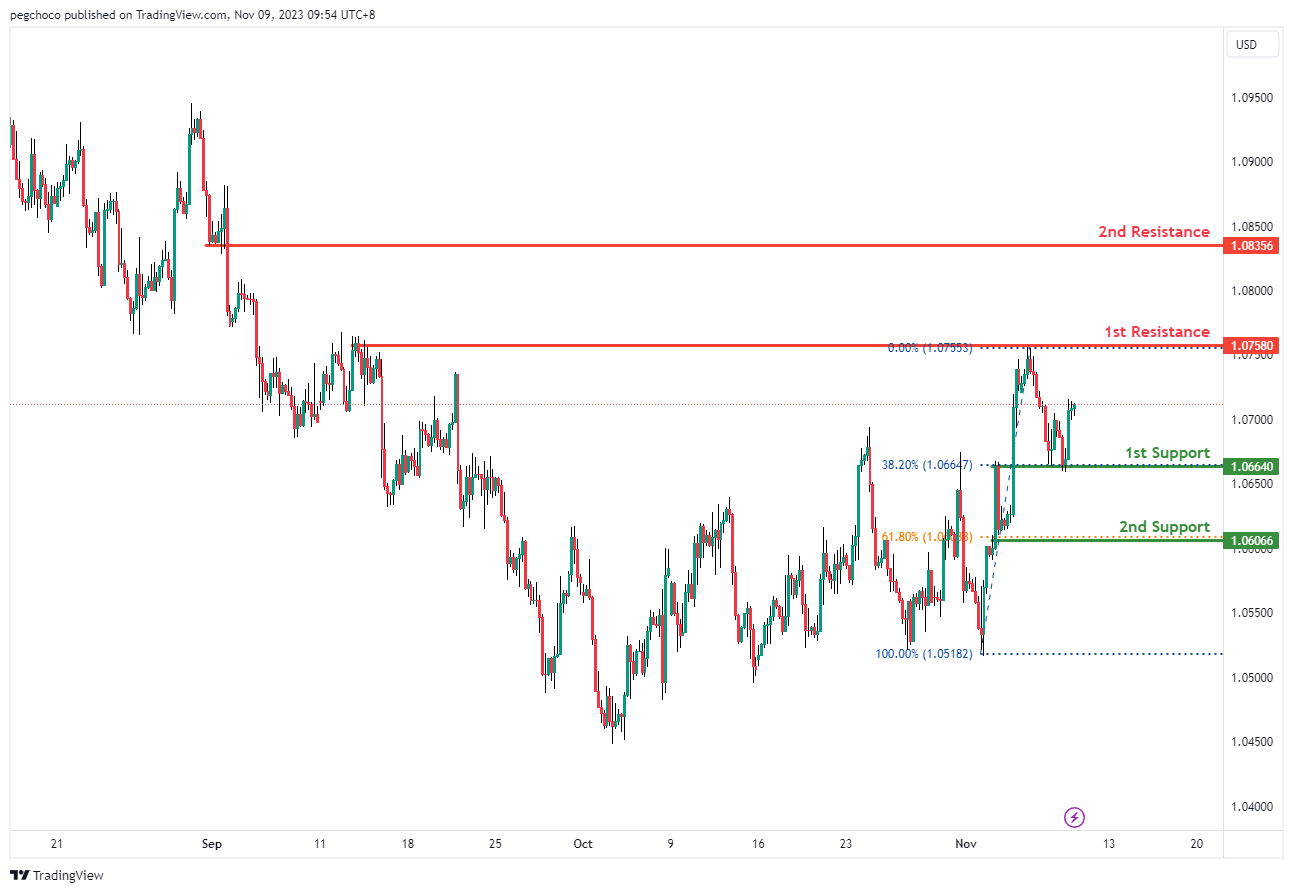
The EUR/USD chart currently has a bullish overall momentum, indicating the potential for a bullish continuation towards the 1st resistance level.
The 1st support at 1.0664 is identified as an overlap support and coincides with the 38.20% Fibonacci Retracement level, making it a significant level where buyers may step in.
Additionally, the 2nd support at 1.0606 aligns with the 61.80% Fibonacci Retracement level, further reinforcing its potential as a strong support level.
On the resistance side, the 1st resistance at 1.0758 is categorized as a multi-swing high resistance, suggesting it may act as a level where the price encounters selling pressure.
Furthermore, the 2nd resistance at 1.0835 is noted as a pullback resistance, indicating it could be a level where the price faces obstacles in its upward movement.
EUR/JPY:
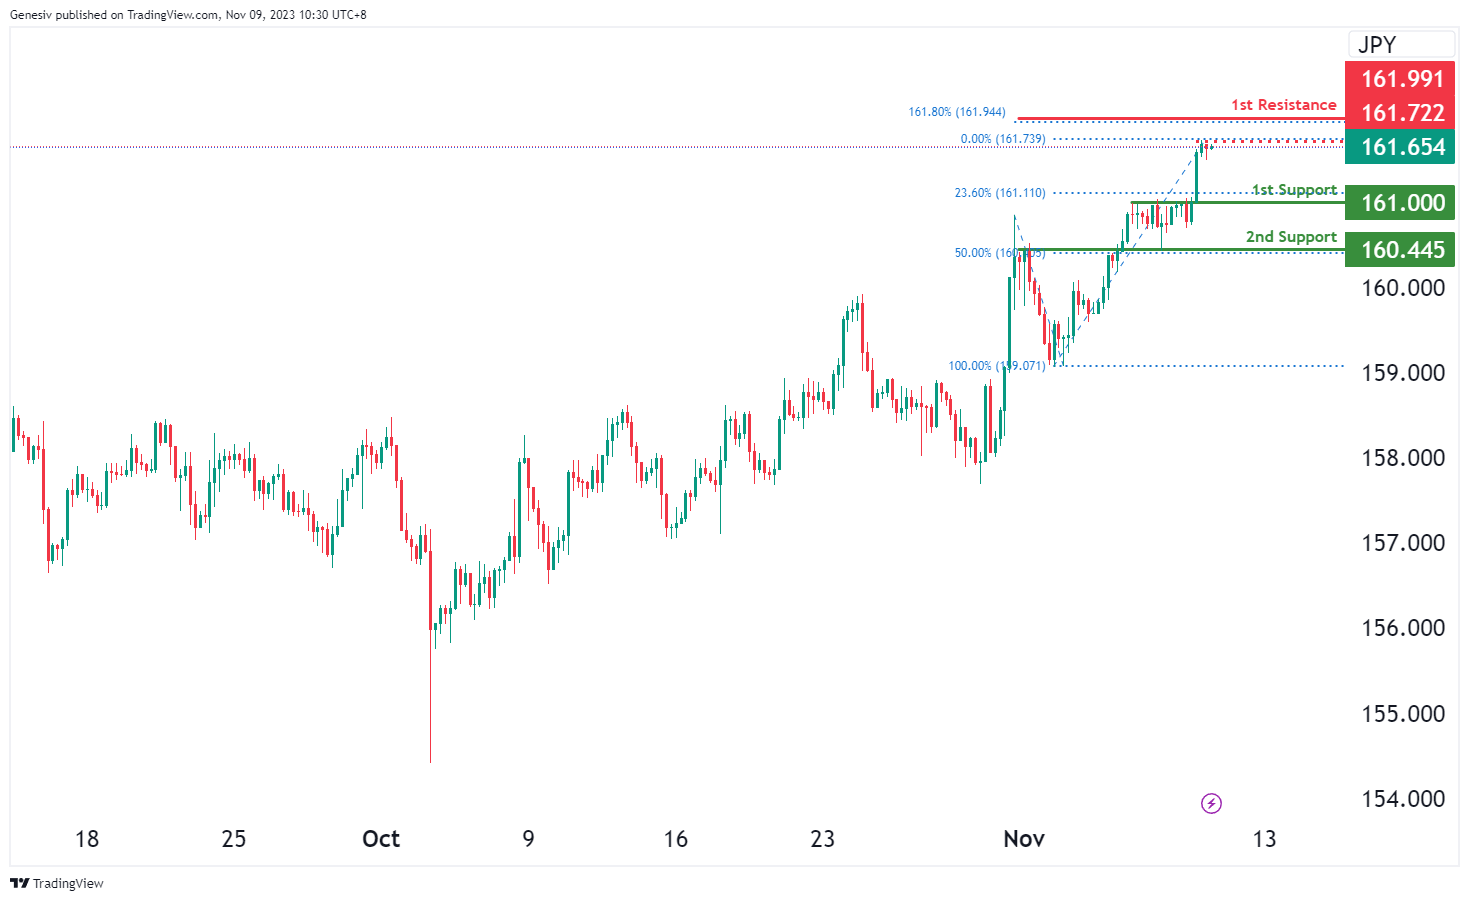
The EUR/JPY instrument is currently exhibiting a bearish momentum on the chart. There’s a potential for a short-term rise towards the first resistance before a likely reversal, subsequently leading the price to drop towards the first support at 161.00, known for its pullback support at the 23.60% Fibonacci Retracement level. Additionally, a second support at 160.44 is identified as an overlap support at the 50% Fibonacci Retracement level. On the resistance side, the first resistance at 161.99, marked at the 161.80% Fibonacci Extension, and the intermediate resistance at 161.72, recognized for its swing high resistance, indicate crucial points within the trading scenario.
EUR/GBP:
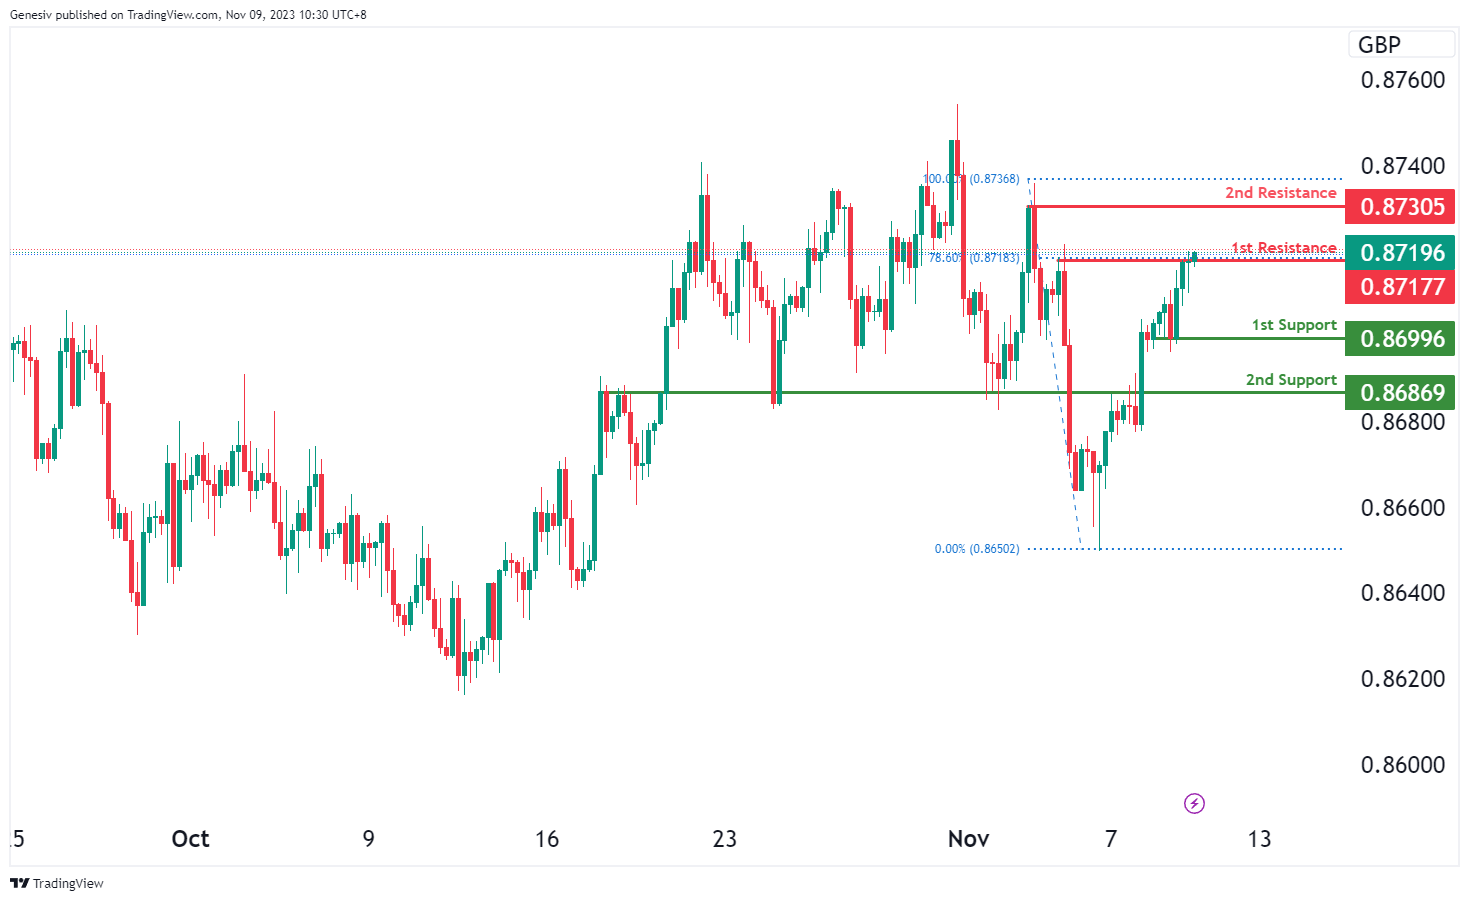
For EUR/GBP, the analysis suggests the following support and resistance levels based on the bullish momentum:
1st support is identified at 0.8699, noted as a swing low support. This level historically has shown significant buying interest or a bounce in the price.
The 2nd support is positioned at 0.8686, recognized as a pullback support. It indicates a level where the price has retraced before moving higher, adding further credence to its potential support role.
Regarding resistance, the 1st resistance level is at 0.8717, known as a swing high resistance coinciding with the 78.60% Fibonacci Retracement. This suggests a substantial historical level where selling pressure has previously affected the price, aligning with a critical Fibonacci level.
The 2nd resistance is placed at 0.8730, identified as a swing high resistance. This further solidifies the potential barrier that the price might face after breaching the 1st resistance, signaling another historical point where the price has been met with selling pressure.
.
GBP/USD:
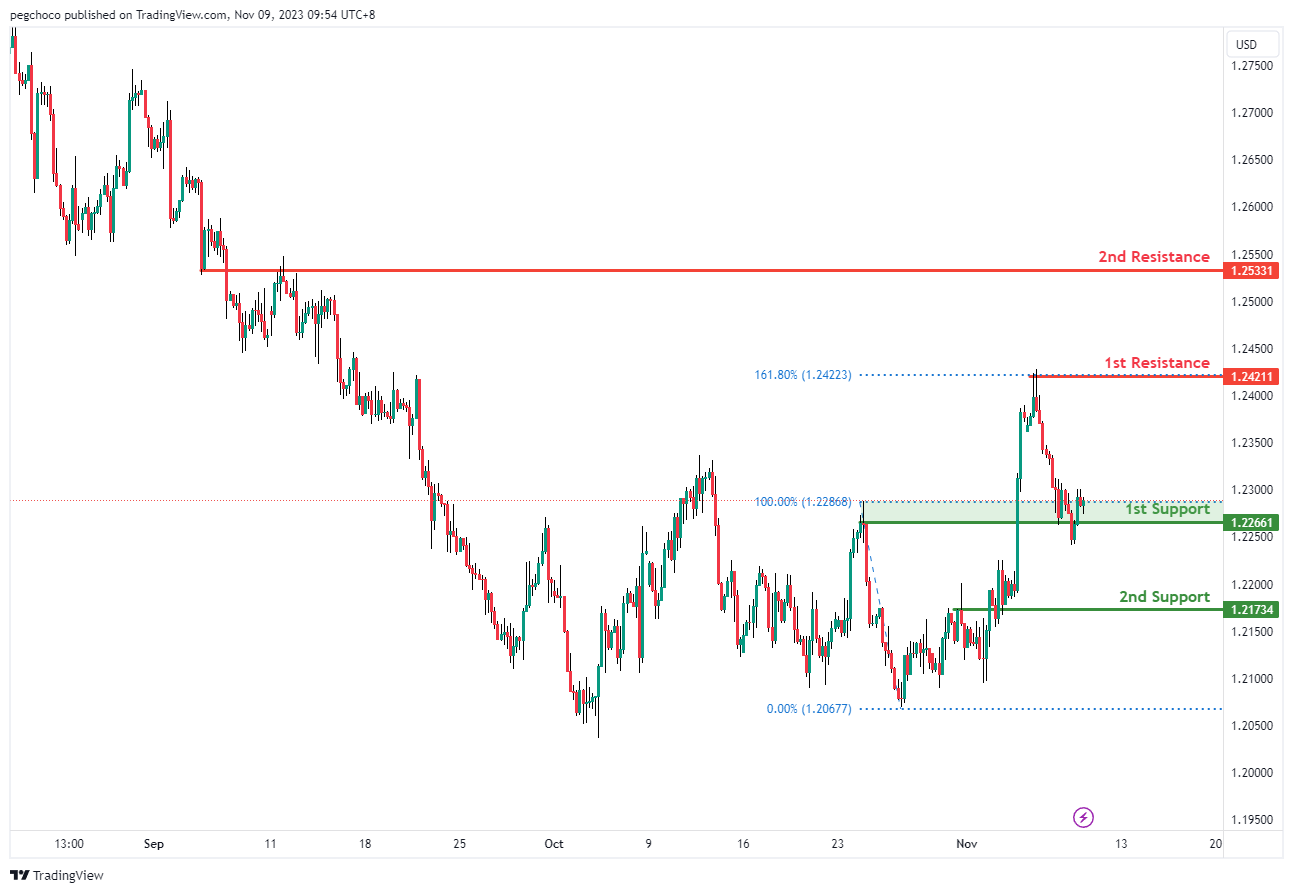
The GBP/USD chart currently has a bullish overall momentum, suggesting the potential for a bullish continuation towards the 1st resistance level.
The 1st support at 1.2266 is identified as an overlap support, making it a significant level where the price may find buying interest.
Additionally, the 2nd support at 1.2173 is also categorized as an overlap support, further reinforcing its potential as a strong support level.
On the resistance side, the 1st resistance at 1.2421 is noted as a swing high resistance, suggesting it could act as a level where the price encounters selling pressure.
Furthermore, the 2nd resistance at 1.2533 is identified as an overlap resistance, indicating another potential level where the price may face obstacles in its upward movement.
GBP/JPY:
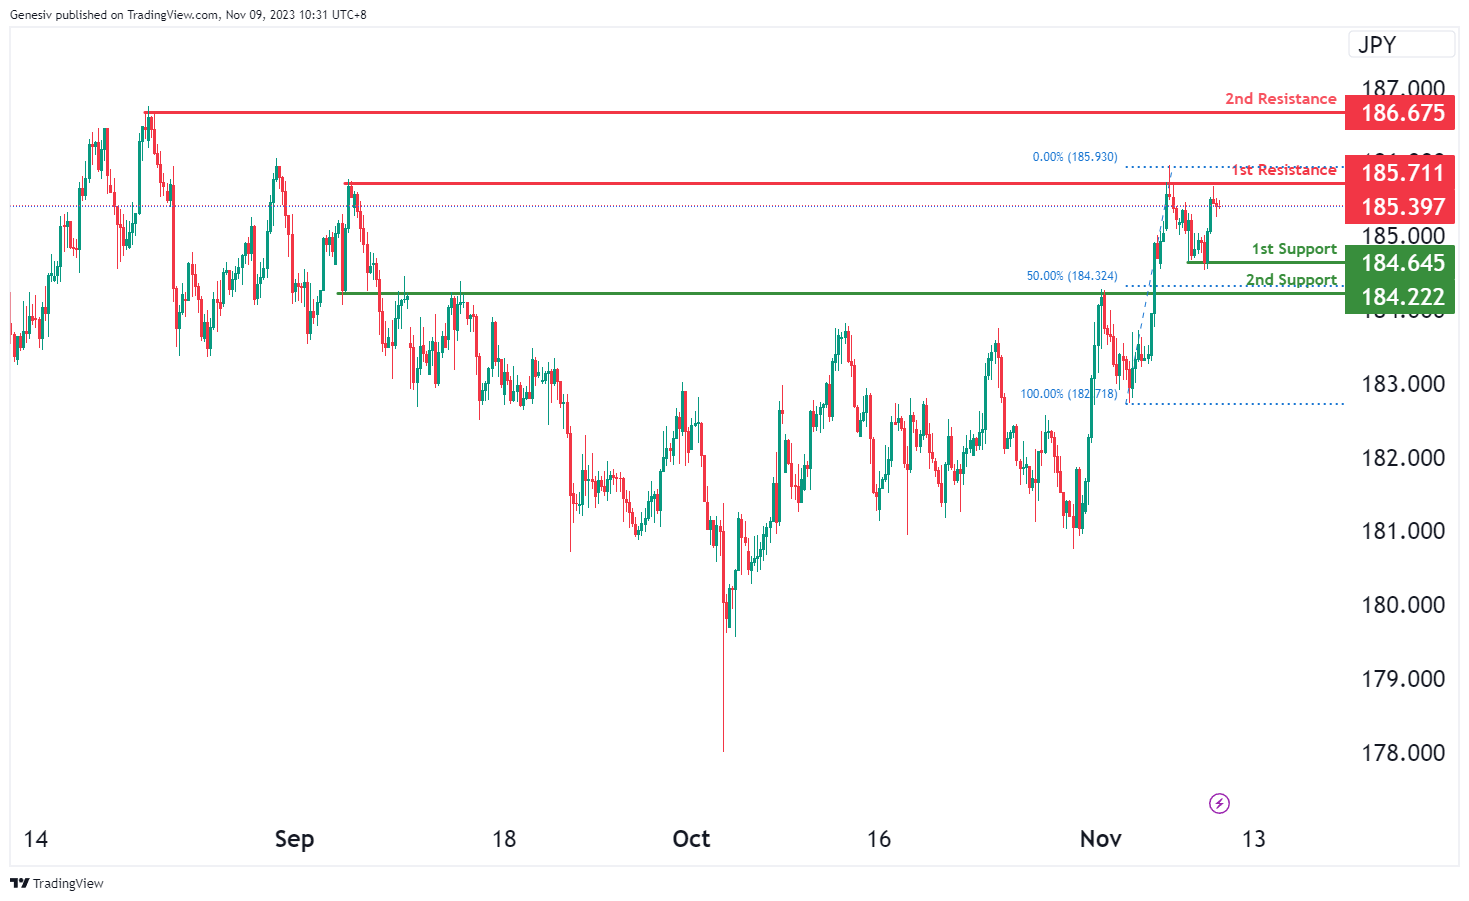
The GBP/JPY chart reflects a bearish momentum, suggesting a potential bearish reaction at the first resistance level, leading the price to drop towards the first support at 184.64, supported by its significance as a swing low support. Additionally, a second support at 184.22 is recognized as a pullback support at the 50% Fibonacci Retracement level. On the resistance side, the first resistance at 185.71 is identified as a point of multi-swing high resistance, while the second resistance at 186.67 is characterized by its significance as a swing high resistance, both indicating crucial levels within the trading context.
USD/CHF:
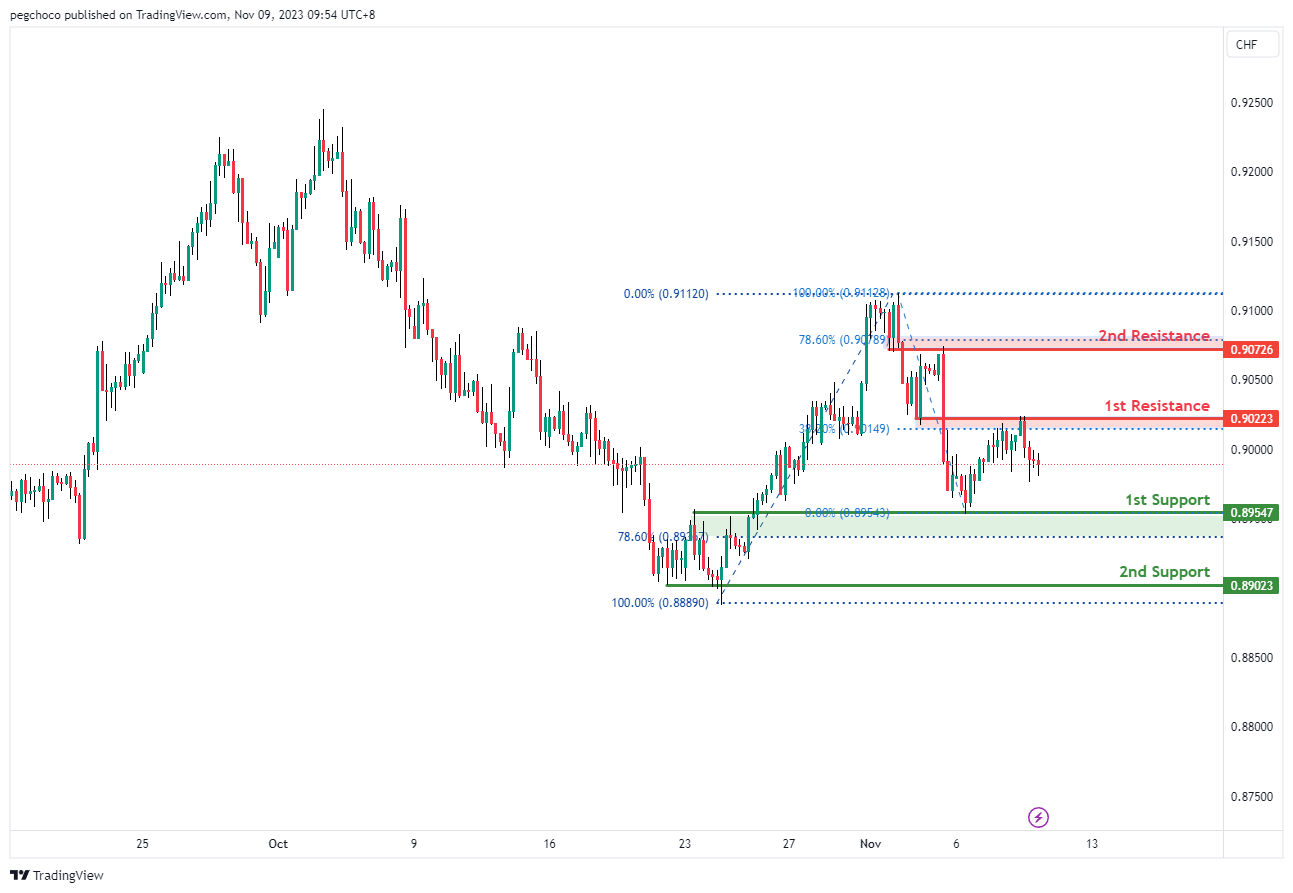
The USD/CHF chart currently exhibits a bearish overall momentum, indicating the potential for a bearish continuation towards the 1st support level.
The 1st support at 0.8954 is identified as an overlap support, signifying its significance as a level where the price may find buying interest. Additionally, this support level aligns with the 78.60% Fibonacci Retracement, adding to its potential as a strong support zone.
The 2nd support at 0.8902 is categorized as a multi-swing low support, further reinforcing its role as a potential level where buyers could enter the market.
On the resistance side, the 1st resistance at 0.9022 is noted as an overlap resistance. This level may act as a barrier where the price could face selling pressure. It also corresponds to the 38.20% Fibonacci Retracement.
Furthermore, the 2nd resistance at 0.9072 is identified as an overlap resistance and coincides with the 78.60% Fibonacci Retracement. This level adds to the strength of the resistance zone.
.
USD/JPY:
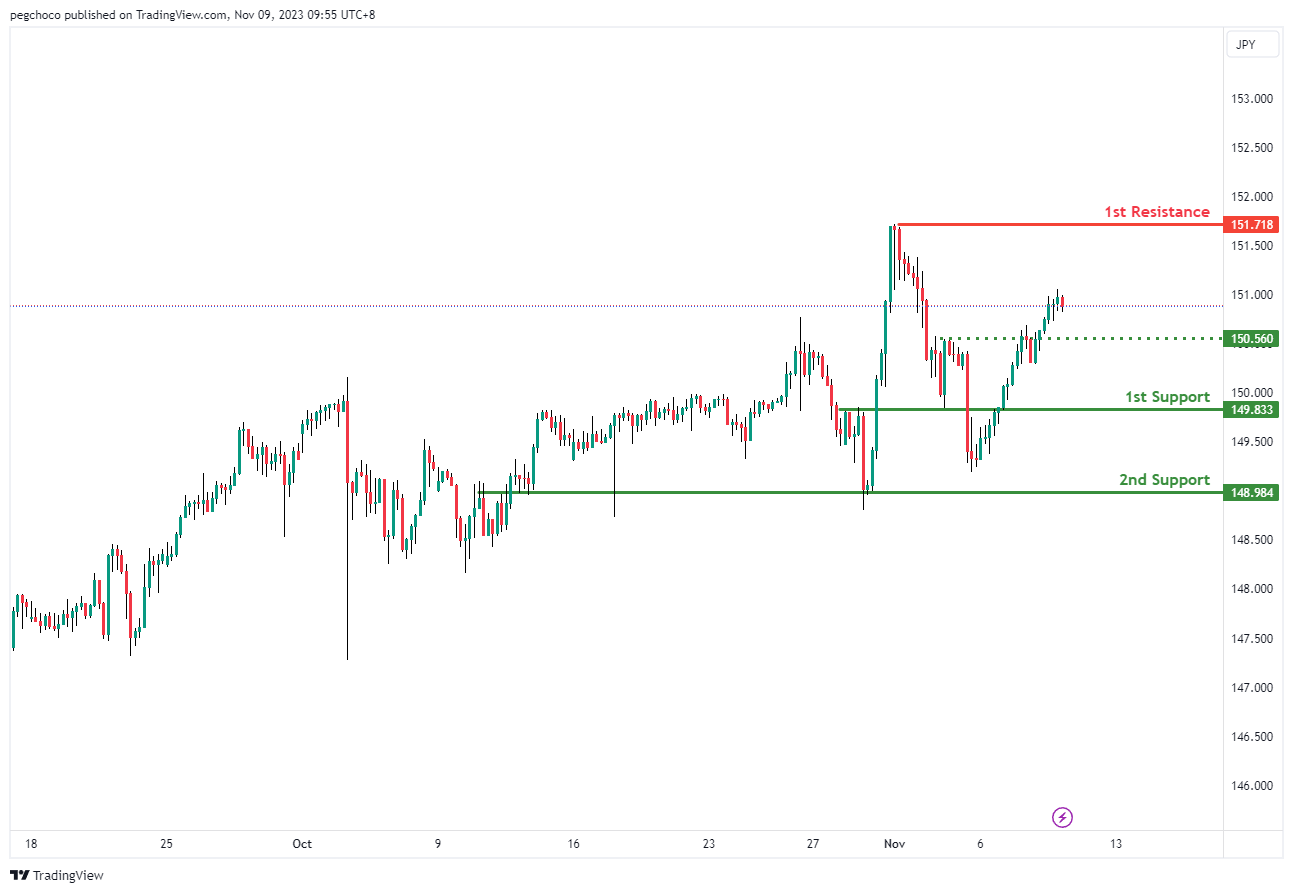
The USD/JPY chart currently displays a bullish overall momentum, suggesting the potential for a bullish continuation towards the 1st resistance level.
The 1st support at 149.83 is identified as a pullback support, indicating it could be a significant level where the price might find buying interest. This support level aligns with the prevailing bullish momentum.
Additionally, the 2nd support at 148.98 is categorized as an overlap support, further reinforcing its potential as a support level where buyers may step in.
On the resistance side, the 1st resistance at 151.71 is noted as a swing high resistance. This level indicates a potential barrier where the price may face selling pressure as it attempts to move higher.
Intermediate support at 150.56 is also mentioned as a pullback support, adding to the potential areas where the price might find support in its bullish journey.
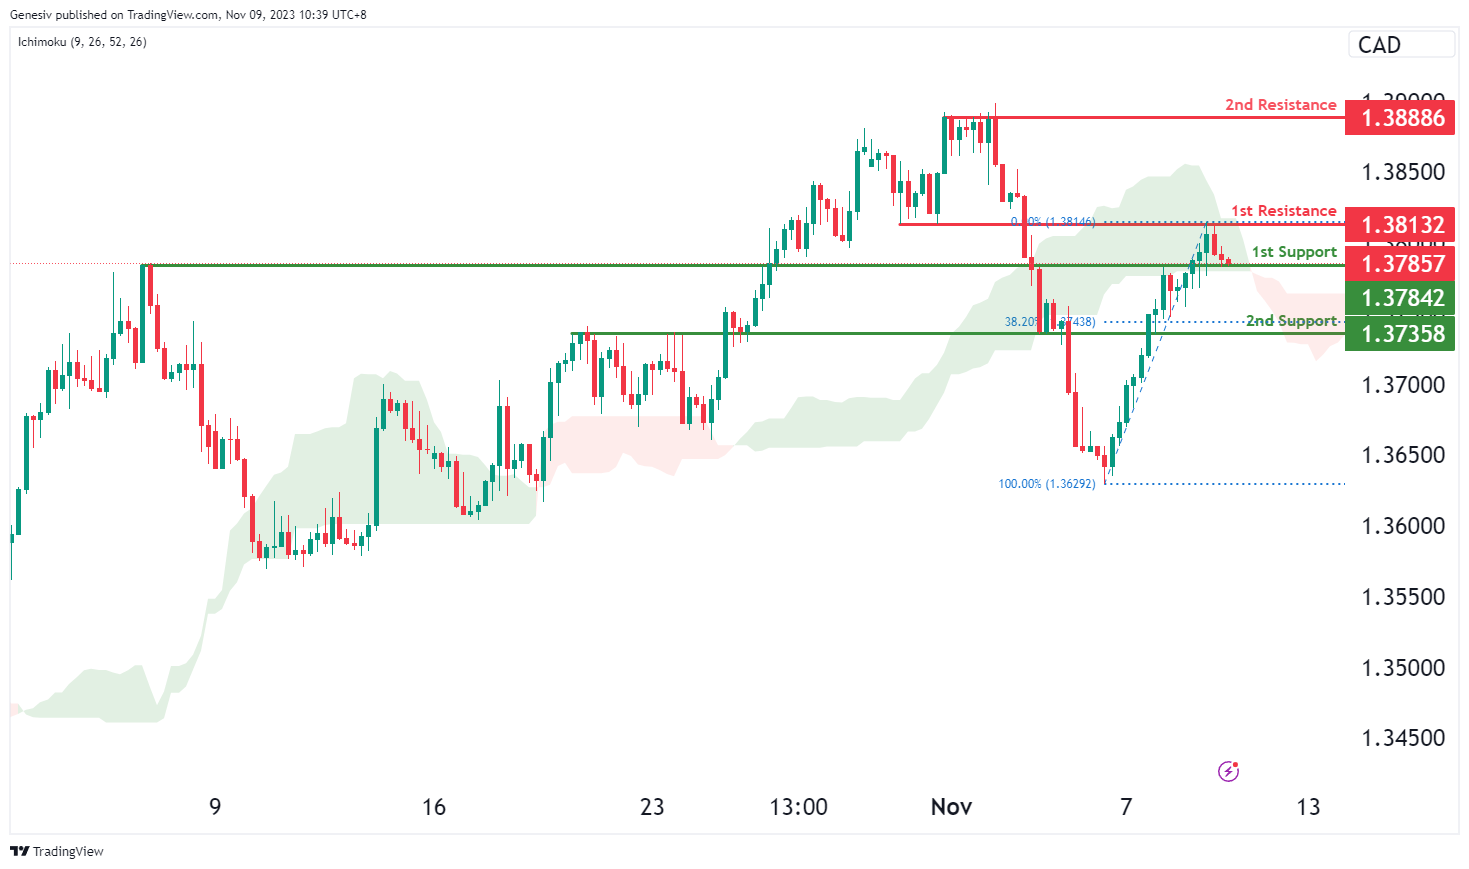
USD/CAD:
The USD/CAD chart is currently exhibiting an overall bullish momentum, indicating a potential for price to make a bullish continuation towards the 1st resistance.
The 1st resistance level at 1.3813 is identified as an overlap resistance. Higher up, the 2nd resistance level at 1.3889 is marked as a pullback resistance, suggesting that it may act as a strong resistance zone.
To the downside, the 1st support level at 1.3784 is identified as an overlap support. Further below, the 2nd support level at 1.3736 is also noted as an overlap support that aligns with the 38.20% Fibonacci retracement level, adding to its potential as a level where price could find support.
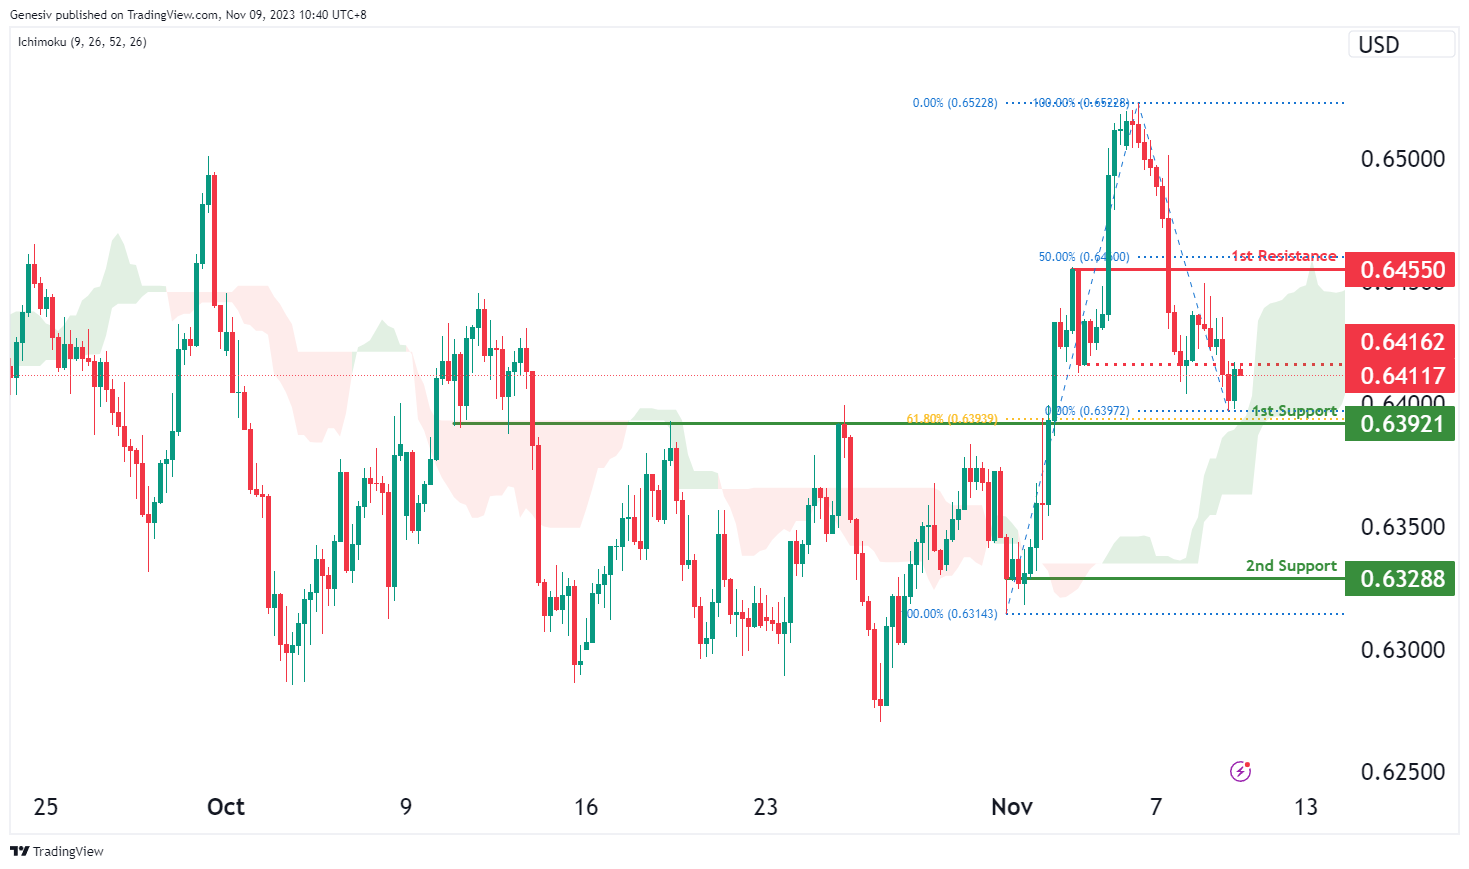
AUD/USD:
The AUD/USD chart is currently characterized by a weak bullish momentum. There is potential for price to make a bullish reaction off the 1st support and rise towards the intermediate resistance. Another factor contributing to this bullish reaction is that price is trading above the bullish Ichimoku cloud and could find strong support within the cloud.
The 1st support level at 0.6392 is idenitfied as an overlap support that aligns with the 61.80% Fibonacci retracement level. Further below, the 2nd support level at 0.6329 is noted as a pullback support, reinforcing its potential as a level of support for the price.
On the resistance side, the intermediate resistance level at 0.6416 is identified as a pullback resistance. Additionally, the 1st resistance level at 0.6455 is also marked as a pullback resistance that aligns close to the 50.00% Fibonacci retracement level, indicating another potential obstacle for the price’s upward movement.
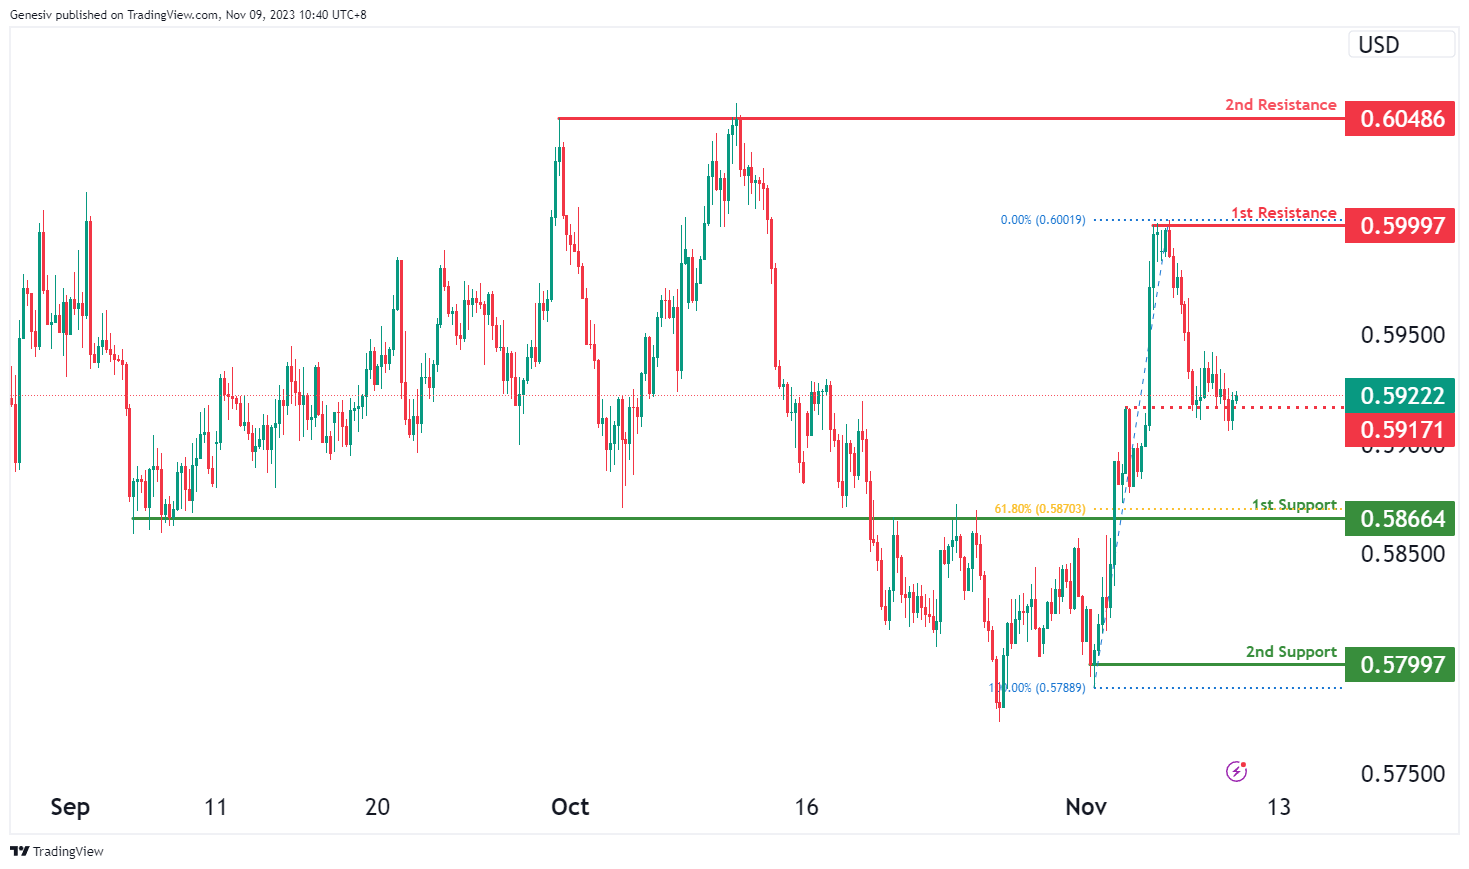
NZD/USD
The NZD/USD chart is currently characterized by an overall bearish momentum. There is potential for price to make a bearish continuation towards the 1st support.
The 1st support level at 0.5866 is identified as an overlap support that aligns with the 61.80% Fibonacci retracement level. Further below, the 2nd support level at 0.5799 is marked as a swing-low support, reinforcing its potential significance as a level of support.
On the resistance side, the intermediate resistance level at 0.5917 is identified as a pullback resistance while the 1st resistance level at 0.5999 is noted as a swing-high resistance. Higher up, the 2nd resistance level at 0.6049 is marked as a multi-swing-high resistance, indicating another potential level where the price may face obstacles in its upward movement.
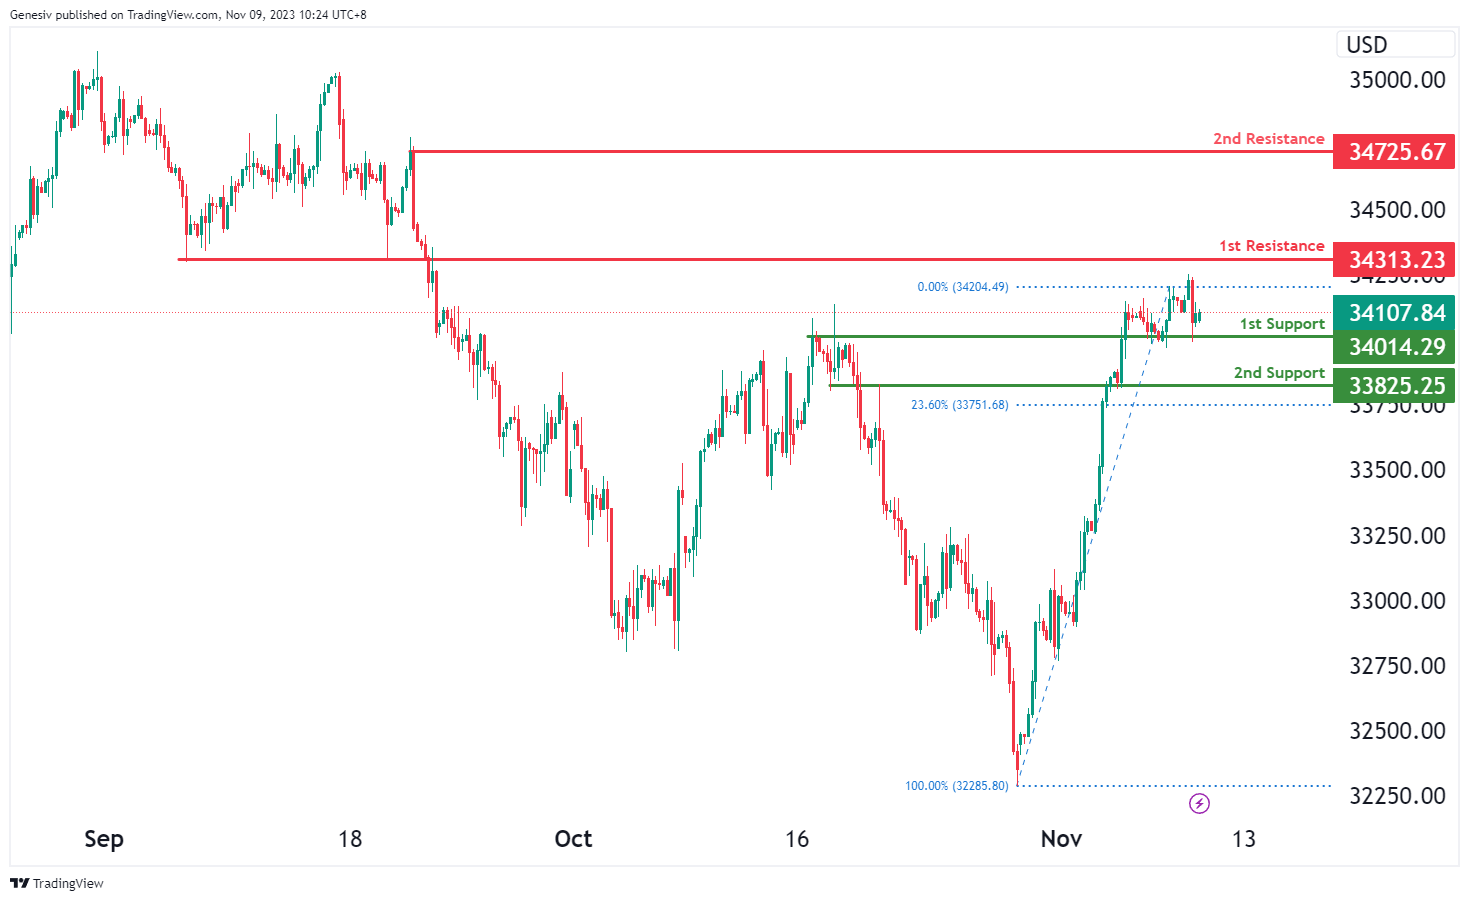
DJ30:
For DJ30, the current market momentum is bullish, and the price could potentially see a bullish continuation toward the 1st resistance. Here are the identified support and resistance levels:
1st support at 34014.29 is labeled as an overlap support, signifying a significant historical level where the price has shown a tendency to find support.
The 2nd support at 33825.25 is also recognized as an overlap support and coincides with the 23.60% Fibonacci Retracement level. This dual confirmation enhances its significance as a potential support area for the price.
On the resistance side, the 1st resistance at 34313.23 is identified as a pullback resistance. This level is likely to present a barrier where the price might face selling pressure based on historical price action.
The 2nd resistance is identified at 34725.67 and is characterized as a swing high resistance, implying a level where historical highs have been observed. This area could act as a significant barrier to further upward movement, potentially causing a reversal or a slowdown in the bullish momentum.
GER40:
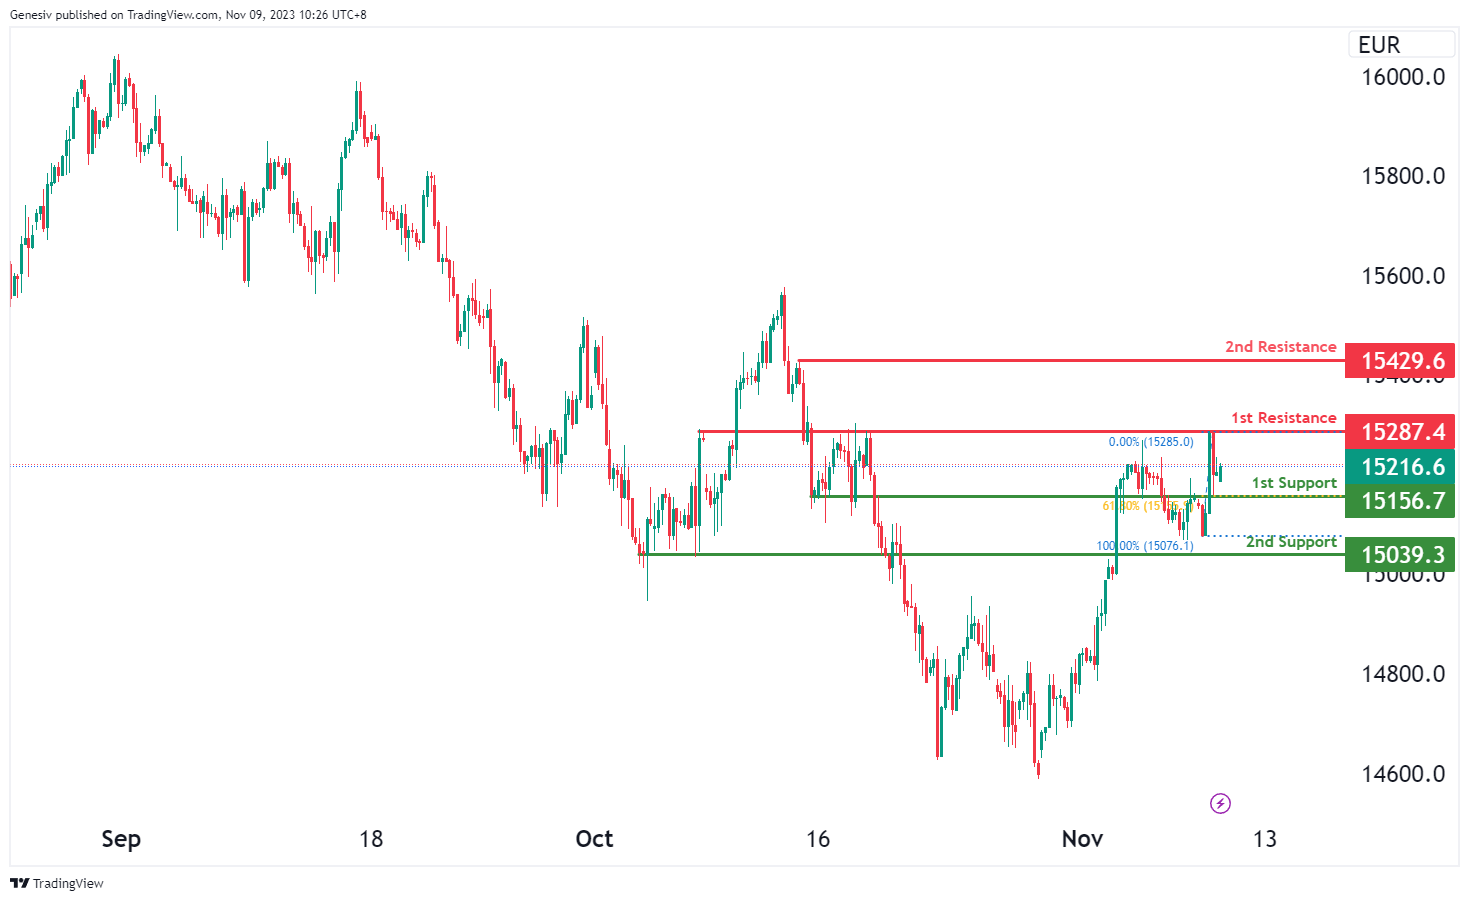
For GER40, the current market momentum is bullish. The analysis indicates potential support and resistance levels:
1st support at 15156.70, characterized as a pullback support, coincides with the 61.80% Fibonacci Retracement. This confluence enhances the significance of this level as a potential support area, indicating historical retracement levels aligning with prior price action.
The 2nd support at 15039.30 is another identified area for potential support. It’s marked as a pullback support without any particular confluence.
On the resistance side, the 1st resistance is noted at 15287.40, labeled as an overlap resistance, denoting a significant historical level where the price has shown a tendency to face selling pressure.
The 2nd resistance is at 15429.60, recognized as a swing high resistance. This level typically indicates historical highs and might act as a significant barrier to further upward movement, potentially causing a reversal or a slowdown in the bullish momentum.
`US500
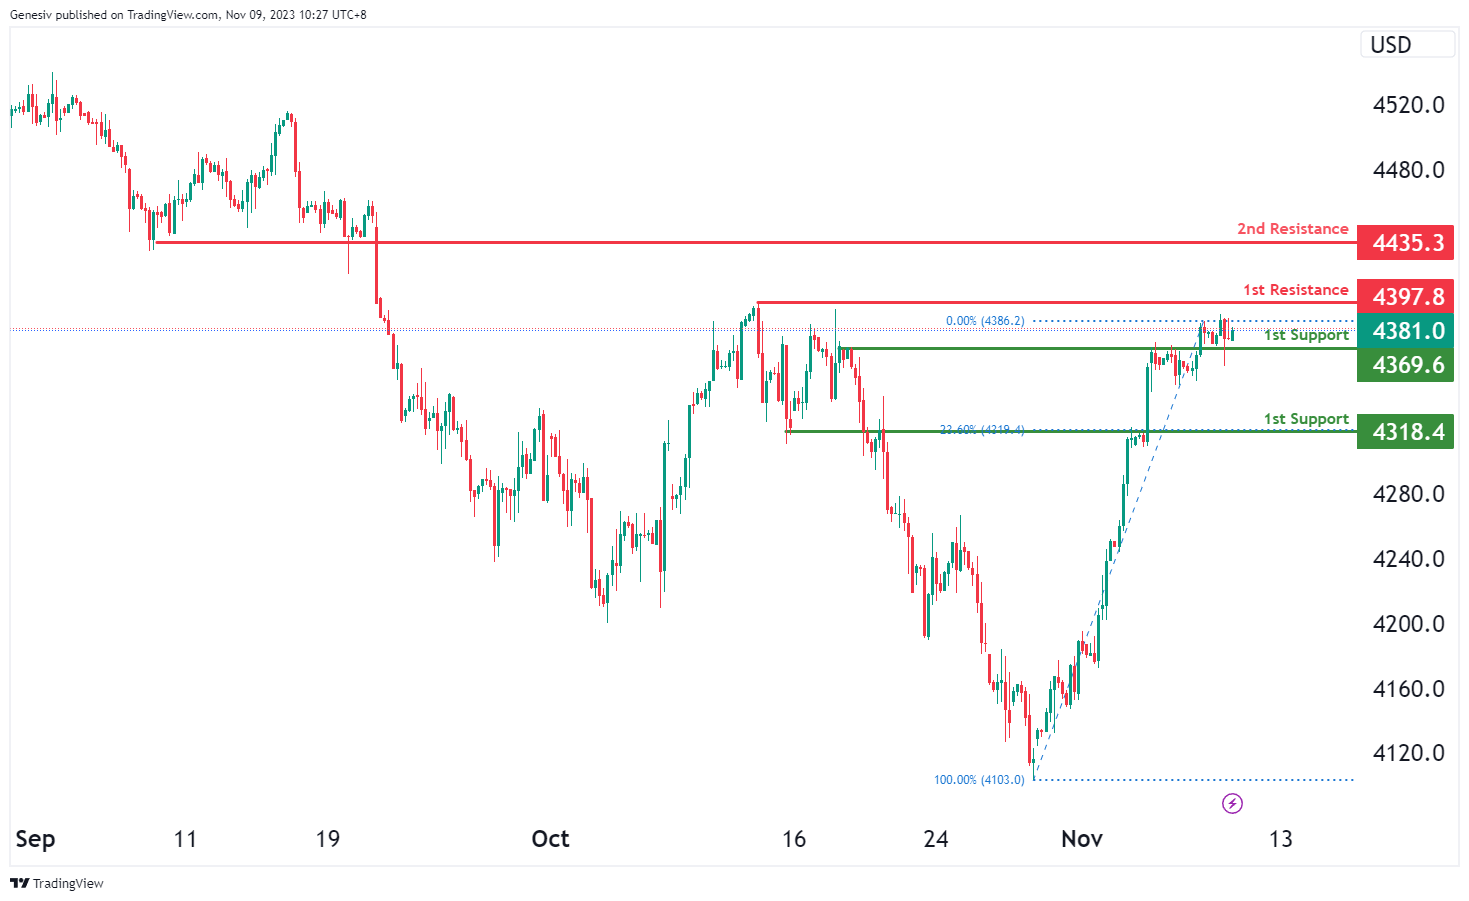
For US500, the current market momentum is bullish. Here’s an analysis of potential support and resistance levels:
1st support is identified at 4369.6, signified as an overlap support, which implies a historically significant level where the price might find initial support. This suggests that historically, the price has bounced back from this level.
The 2nd support at 4318.4 is also noted, classified as a pullback support and coinciding with the 23.60% Fibonacci Retracement level. This level signifies a potentially stronger support zone due to its alignment with a Fibonacci level.
On the resistance side, the 1st resistance is positioned at 4397.8, recognized as a swing high resistance. This level signifies a historically critical area where the price has previously reversed or stalled, reflecting a probable barrier to continued upward movement.
The 2nd resistance is observed at 4435.3, categorized as a pullback resistance. This level might serve as a point where selling pressure increases, potentially leading to a reversal or a slowdown in the bullish momentum.
BTC/USD:
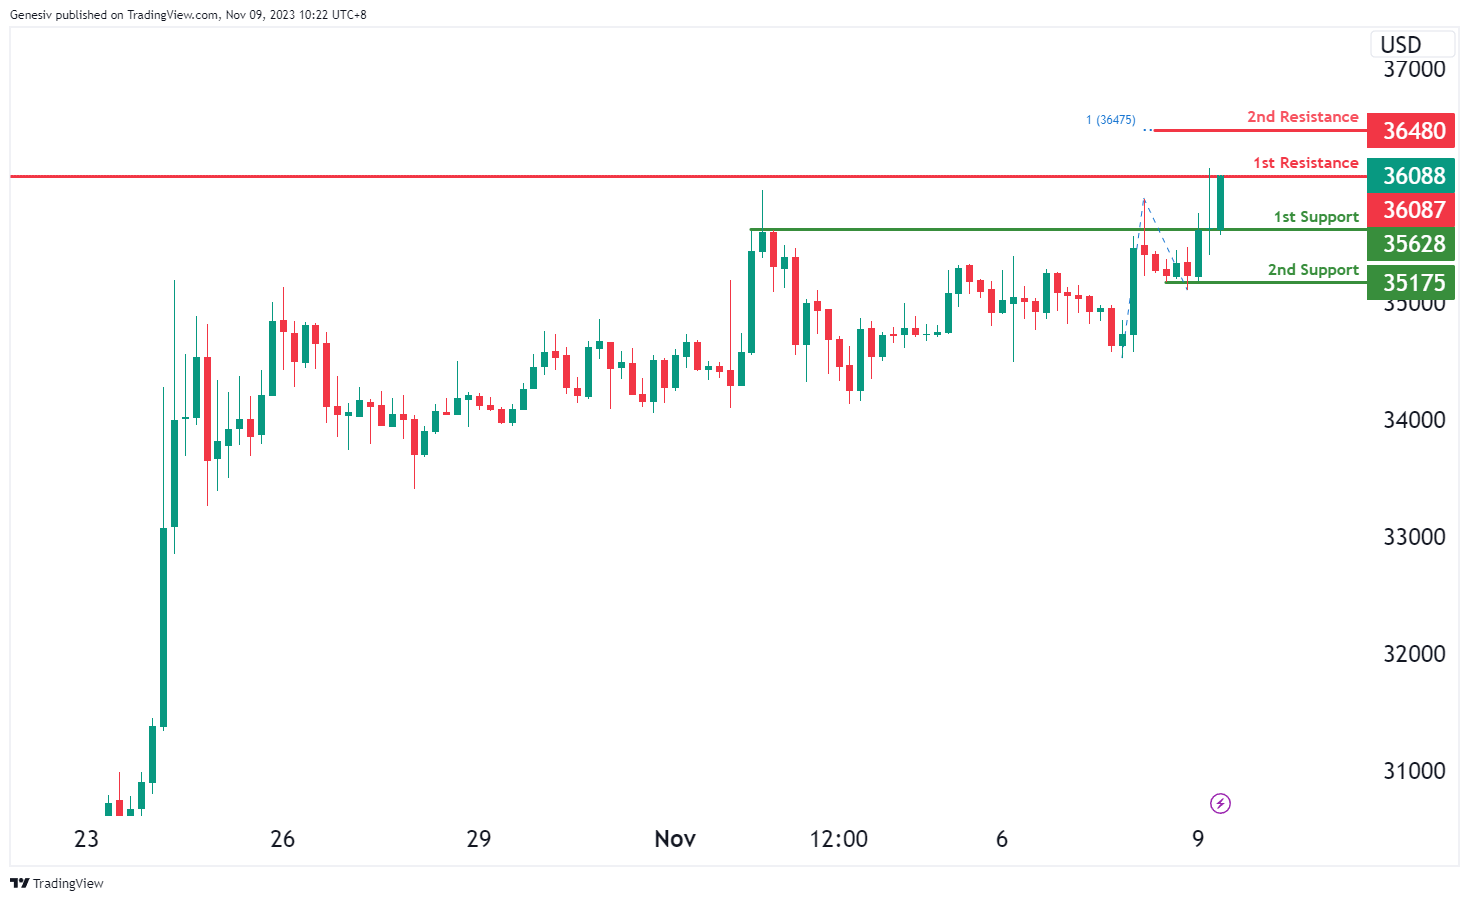
For BTC/USD, considering the current bullish momentum in the chart, there’s a potential scenario where the price might experience a bullish breakthrough past the first resistance level, potentially advancing towards the second resistance.
The provided levels are as follows:
1st support at 35628 is identified as a point of pullback support, indicating it as a significant level where the price might find substantial support during a pullback within the prevailing bullish trend.
The 2nd support at 35175 is recognized as a level of swing low support, suggesting it could serve as a critical area where the price might find support during downward movement.
On the resistance side, the 1st resistance at 36087 is characterized as an overlap resistance, representing a level where the price might encounter a significant barrier in its upward movement.
Moreover, the 2nd resistance at 36480 is identified as a level marked by the 100% Fibonacci Projection. This suggests it as a crucial level where the price might face strong resistance as it aims to surge further within the bullish trend.
ETH/USD:
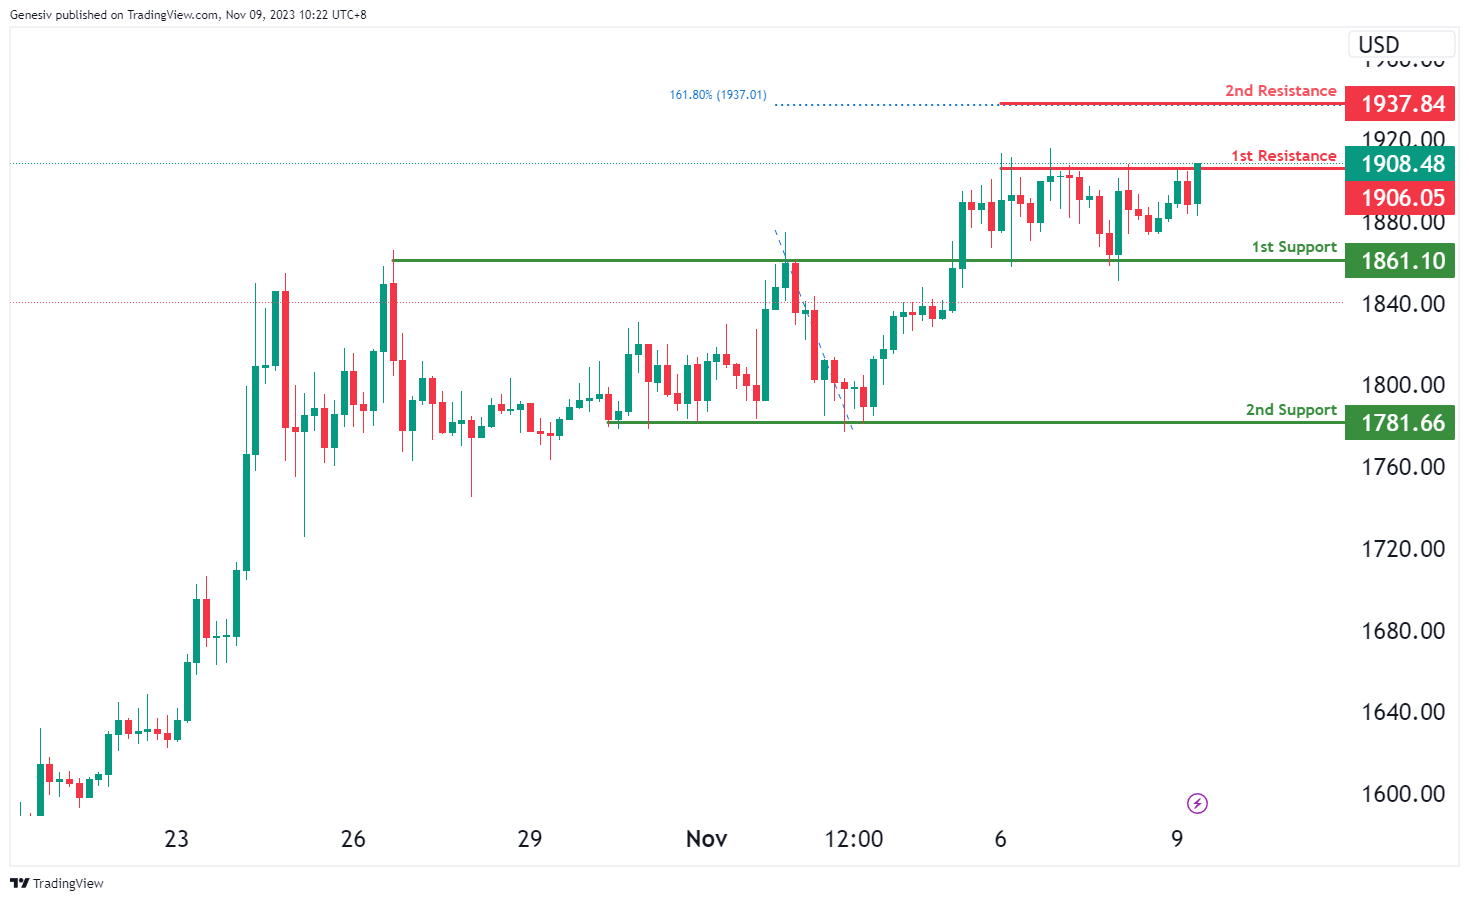
For ETH/USD, considering the current bullish momentum in the chart, there’s a potential scenario where the price might experience a bullish breakthrough past the first resistance level, potentially advancing towards the second resistance.
The provided levels are as follows:
1st support at 1861.10 is identified as an overlap support, indicating it as a significant level where the price might find support due to its historical relevance.
The 2nd support at 1781.66 is recognized as a level of multi-swing low support, suggesting it could serve as a critical area where the price might find strong support during downward movement.
On the resistance side, the 1st resistance at 1906.05 is characterized as a level of multi-swing high resistance, representing a point where the price might encounter substantial selling pressure due to historical highs.
Additionally, the 2nd resistance at 1937.84 is identified as a level marked by the 161.80% Fibonacci Extension. This indicates it as a crucial level where the price might face increased resistance as it aims to continue its bullish momentum.
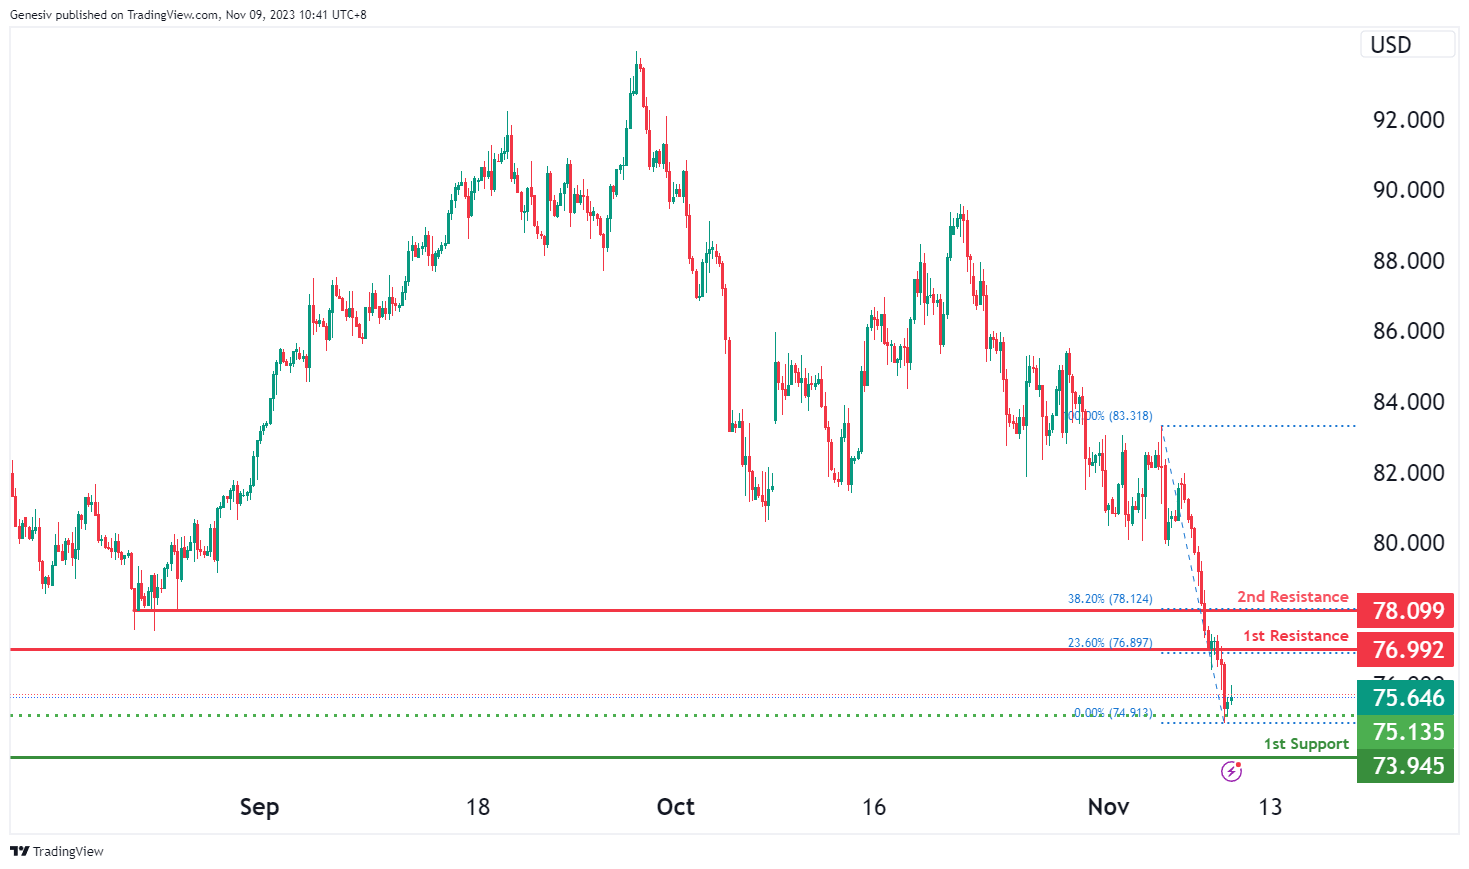
WTI/USD:
The WTI (West Texas Intermediate) chart currently demonstrates an overall bearish momentum. However, there is potential for price to rise towards the 1st resistance before making a bearish reaction and dropping towards the 1st support.
The 1st resistance level at 76.99 is identified as a pullback resistance that aligns with the 23.60% Fibonacci retracement level. Higher up, the 2nd resistance level at 78.09 is also noted a pullback resistance that aligns with the 38.20% Fibonacci retracement level, indicating another potential area where price could face resistance.
To the downside, the intermediate support level at 75.14 is identified as a pullback support. Further below, the 1st support level at 73.95 is marked as a swing-low support, potentially acting as a strong support zone.
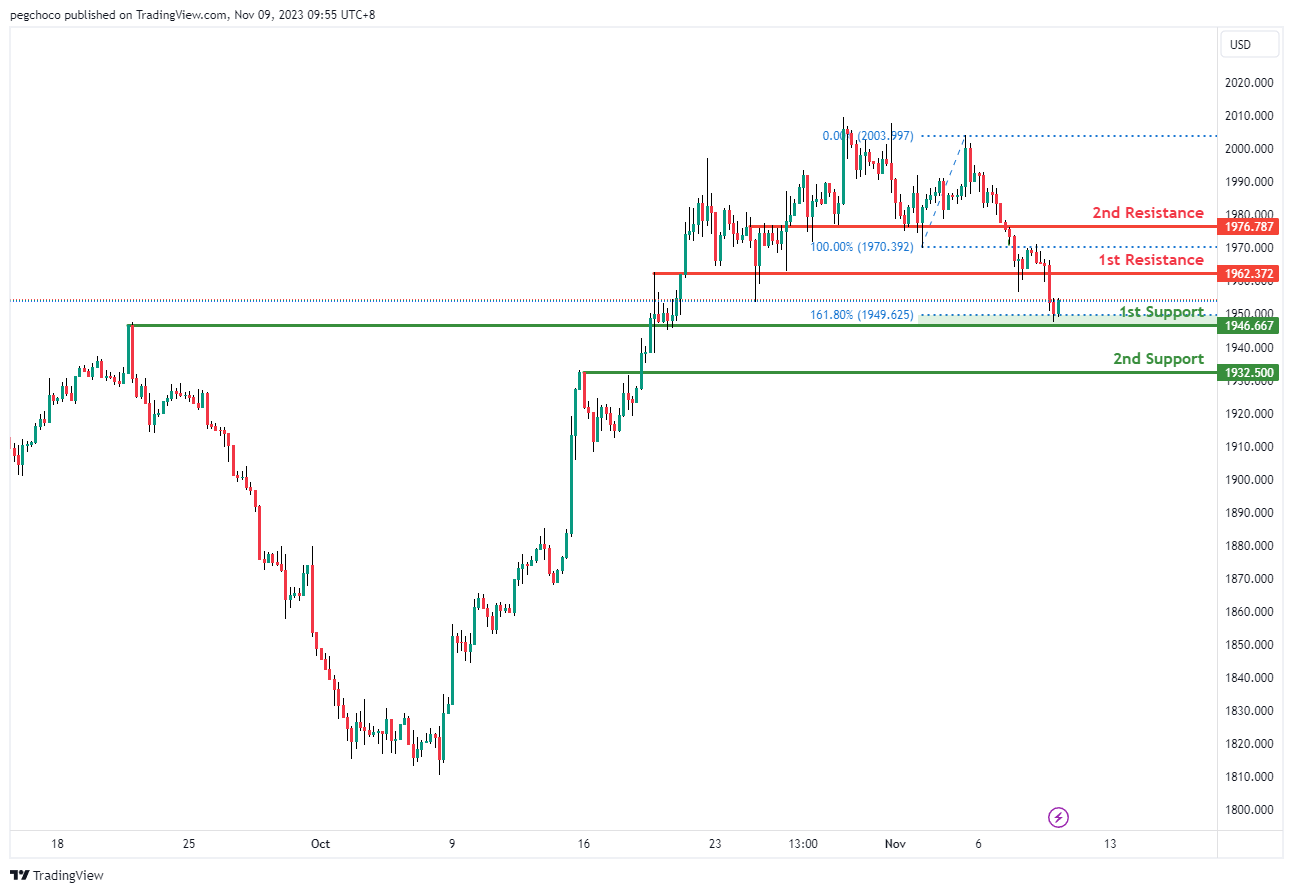
XAU/USD (GOLD):
The XAU/USD chart currently exhibits a bullish overall momentum, indicating the potential for a bullish continuation towards the 1st resistance level.
The 1st support at 1946.66 is identified as an overlap support, and it also aligns with the 161.80% Fibonacci Extension level. This confluence of support factors makes it a significant level where buyers may find interest, potentially providing a strong foundation for the price to bounce from.
The 2nd support at 1932.50 is considered a pullback support, reinforcing the potential support zone for XAU/USD.
On the resistance side, the 1st resistance at 1962.37 is categorized as a pullback resistance, suggesting it could act as a level where the price may face selling pressure as it attempts to move higher.
The 2nd resistance at 1976.78 is also noted as a pullback resistance, adding to the potential areas where the price might find resistance in its bullish journey.
The accuracy, completeness and timeliness of the information contained on this site cannot be guaranteed. IC Markets does not warranty, guarantee or make any representations, or assume any liability regarding financial results based on the use of the information in the site.
News, views, opinions, recommendations and other information obtained from sources outside of www.icmarkets.com, used in this site are believed to be reliable, but we cannot guarantee their accuracy or completeness. All such information is subject to change at any time without notice. IC Markets assumes no responsibility for the content of any linked site.
The fact that such links may exist does not indicate approval or endorsement of any material contained on any linked site. IC Markets is not liable for any harm caused by the transmission, through accessing the services or information on this site, of a computer virus, or other computer code or programming device that might be used to access, delete, damage, disable, disrupt or otherwise impede in any manner, the operation of the site or of any user’s software, hardware, data or property.


