
EUR/USD:
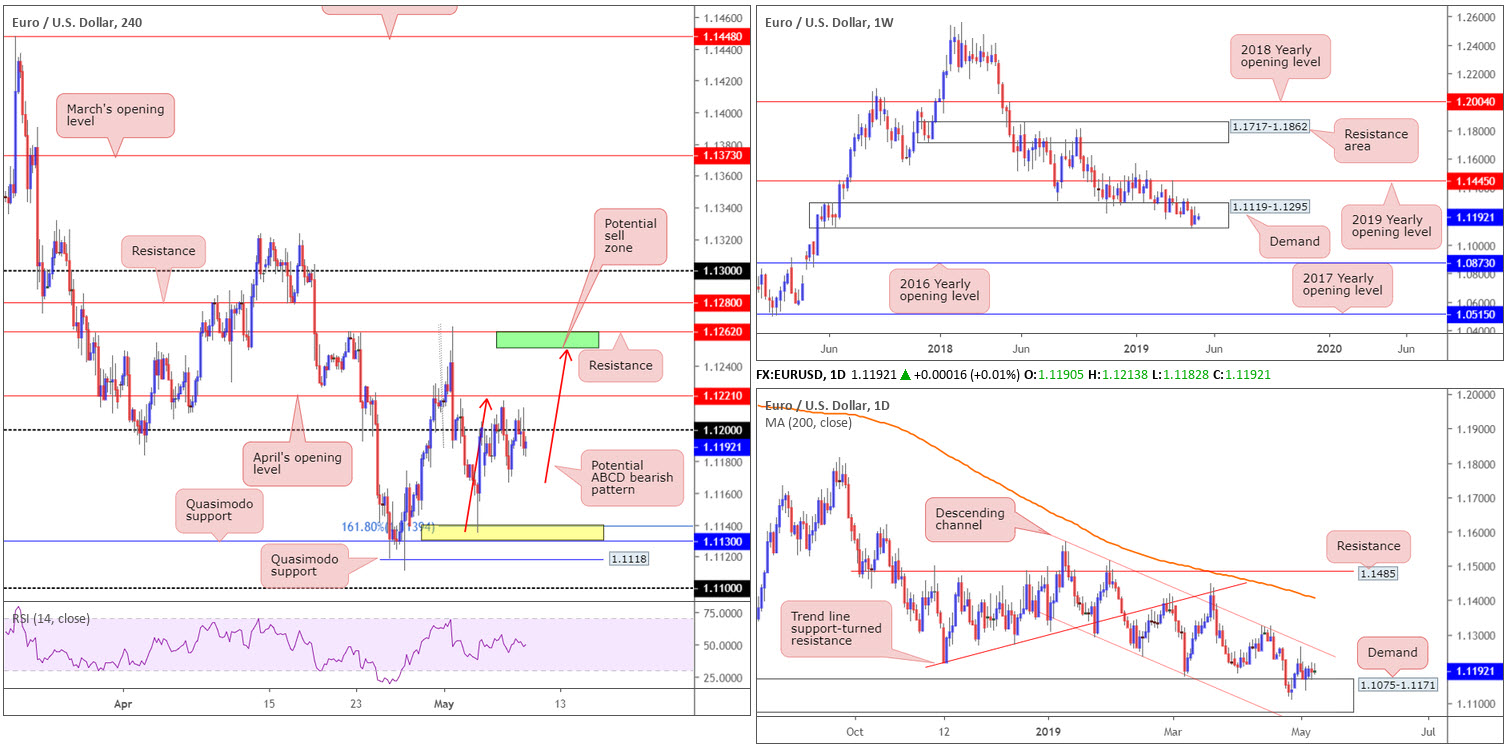
Over the course of Wednesday’s session, we can see the EUR/USD’s H4 candles failed to sustain gains above its 1.12 handle, altering course during US hours and slumping to a session low of 1.1182. The DXY, or US dollar index, retained its bid tone yesterday, though remains struggling to overthrow a weekly resistance positioned at 97.72.
In light of yesterday’s lacklustre performance, much of the following piece will echo thoughts put forward in Wednesday’s briefing.
Above 1.12, as you can see, has April’s opening level at 1.1221 in sight, followed by a rather interesting area of resistance (green) at 1.1262/1.1251 (comprised of a resistance level at 1.1262 and a potential ABCD measured move [red arrows] at 1.1251). To the downside, nonetheless, traders’ crosshairs are likely fixed on the 161.8% Fibonacci ext. point at 1.1139, as well as Quasimodo support at 1.1130 (yellow).
On more of a broader perspective, unchanged from previous reports, our technical studies have the buyers and sellers battling for position within the lower limits of a long-standing weekly demand zone coming in at 1.1119-1.1295. Continued buying may call for a test of weekly resistance plotted at 1.1445, the 2019 yearly opening level, whereas a break lower has the 2016 yearly opening level at 1.0873 in view.
Daily activity continues to hover around the top edge of demand priced at 1.1075-1.1171 (glued to the underside of the current weekly demand area). The next upside target from this region can be seen around the nearby channel resistance taken from the high 1.1569.
Areas of consideration:
Although the market may struggle to reach the H4 green sell zone at 1.1262/1.1251 today, it remains an area worthy of note for future use. In addition to its H4 confluence, the zone merges closely with the daily channel resistance highlighted above. Traders are, however, urged to wait and see if H4 price is able to chalk up a bearish candlestick formation before pulling the trigger. That way, you have not only identified seller intent, you also have entry and risk levels to work with (according to the pattern’s structure).
In case we push for lower ground today, the 1.1130/1.1139 yellow zone (highlighted above) on the H4 timeframe is another base worth keeping an eye on for longs, though do remain aware that a fakeout through this base is possible to a H4 Quasimodo support at 1.1118, followed closely by the 1.11 handle. It may also be worth noting the yellow zone has strong connections to both the current weekly and daily demand areas underlined above.
Today’s data points: Fed Chair Powell Speaks; US PPI m/m; US Core PPI m/m.
GBP/USD:
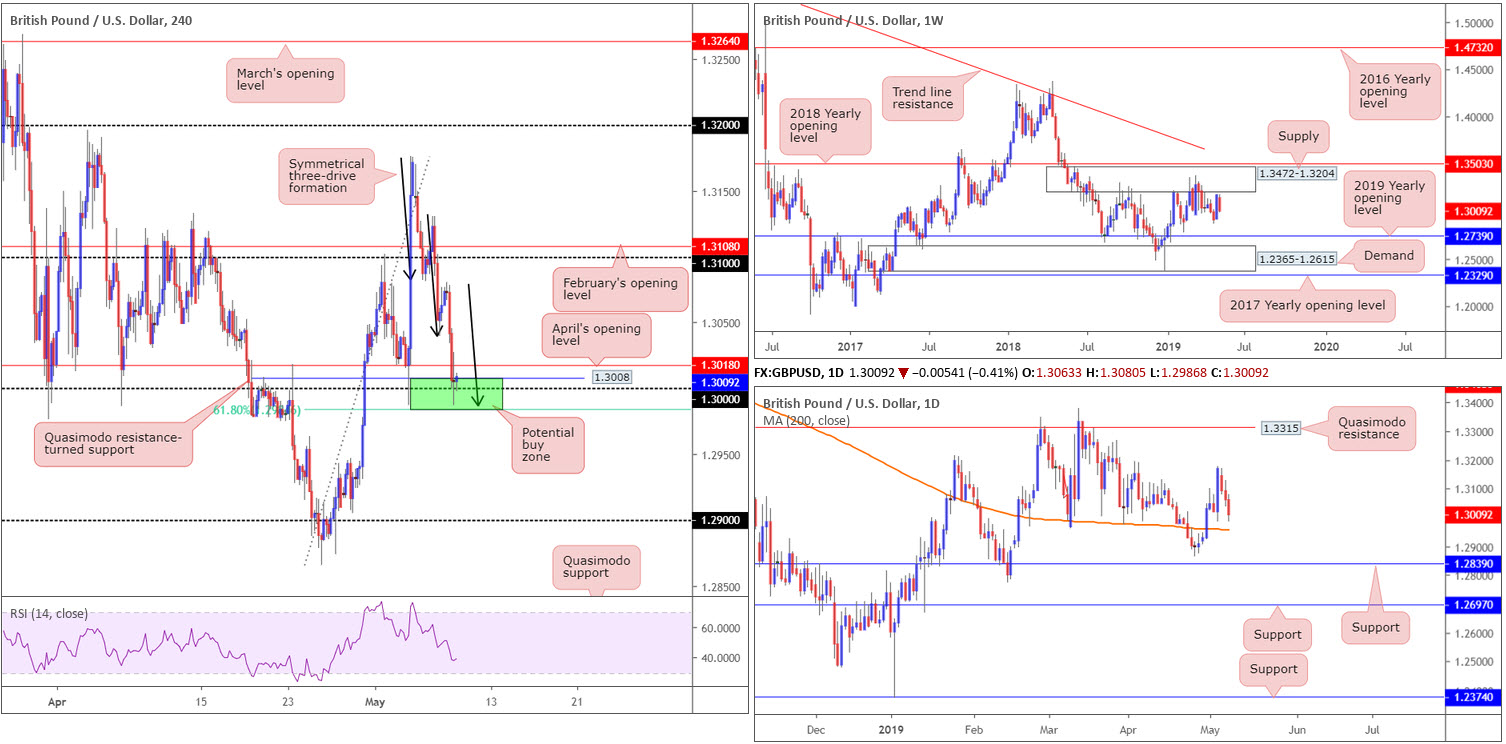
Sterling sustained further losses Wednesday, as hopes of a cross-party deal fades and pressure continues to mount on UK PM May to step down.
Recent selling drove the H4 candles towards key figure support at 1.30. By and of itself, this is a widely watched figure, though you’ll notice it draws in additional H4 support by way of (green) a Quasimodo resistance-turned support at 1.3008, a nearby 61.8% Fibonacci support value at 1.2985 and a symmetrical three-drive bullish pattern (black arrows) that terminates around 1.2988.
Reaching over to the bigger picture, similar to previous reports, has weekly price displaying signs of weakness ahead of a notable supply zone at 1.3472-1.3204, situated a few points south of the 2018 yearly opening level at 1.3503. Having observed this area hold price action lower on a number of occasions in the past, history has a good chance of repeating itself here should the area eventually be tested. Daily movement, on the other hand, appears to be trading in the direction of the 200-day SMA (orange), currently circulating around the 1.2954 region.
Areas of consideration:
Despite weekly flow screening signs of further selling and daily action poised to challenge its 200-day SMA, the H4 green zone pictured between 1.2985/1.3008 is an area of interest for longs today. Before pressing the buy button, though, traders may wish to hold fire and wait for a H4 close above April’s opening level at 1.3018 to form. Entry can then be taken on the breakout candle’s close with a stop-loss order placed accordingly. This potentially clears the pathway as far north as the 1.31 neighbourhood, shadowed closely by February’s opening level at 1.3108.
Today’s data points: Fed Chair Powell Speaks; US PPI m/m; US Core PPI m/m.
AUD/USD:
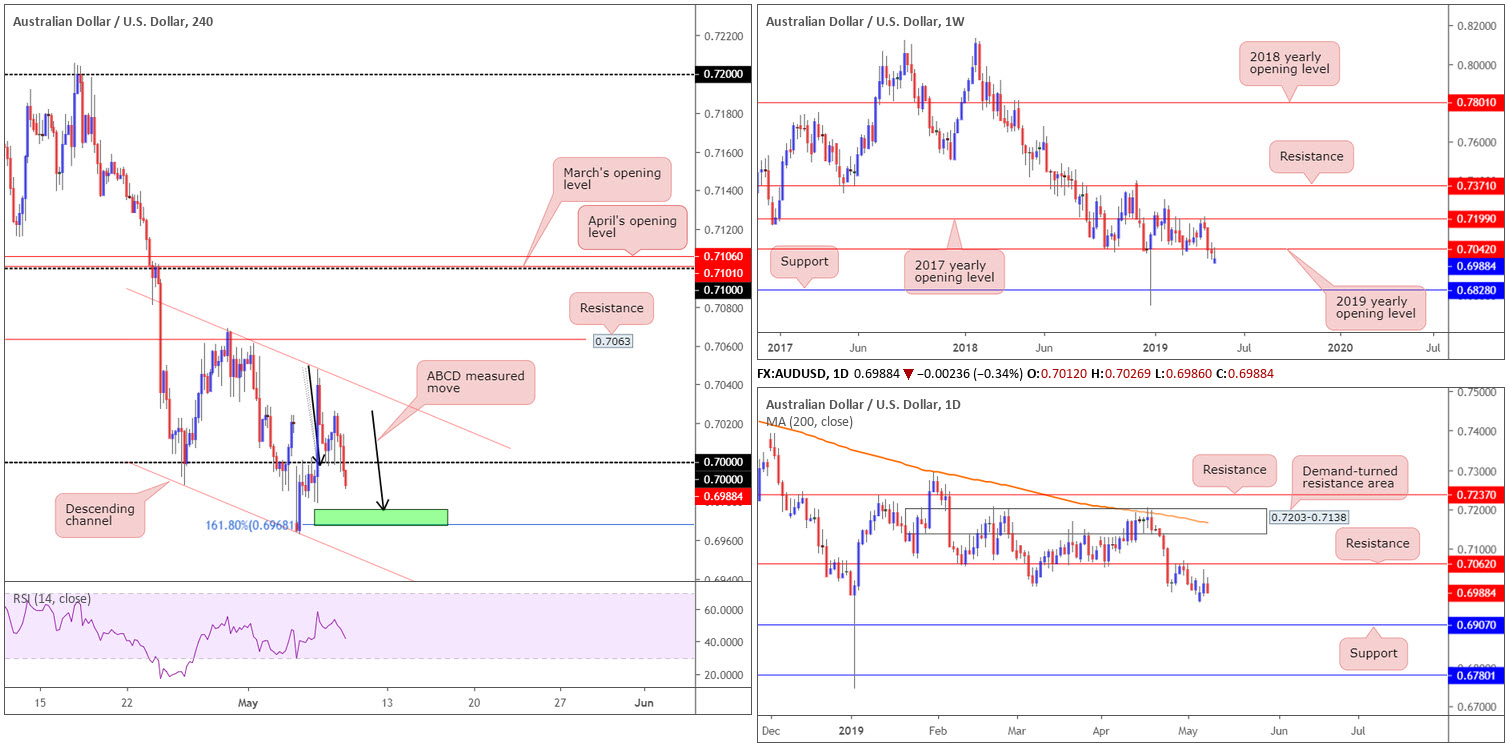
On-going trade concerns along with a modestly rising US dollar had the Australian dollar nursing losses sub 0.70 heading into Wednesday’s close. The next downside target on the H4 timeframe , according to our technical studies, can be seen around a 161.8% ABCD measured move (black arrows) that completes around 0.6968/0.6976 (green). Beyond here, the research team has channel support extended from the low 0.6988, followed by the round number 0.69 (not visible on the screen).
According to the higher-timeframe structure, further selling is likely on the cards. Weekly flow is retesting the underside of its 2019 yearly opening level at 0.7042. An established move below here has support at 0.6828 to target. In conjunction with weekly movement, the daily timeframe also exhibits scope to explore lower ground beneath its resistance at 0.7062, steering for a move towards support at 0.6907.
Areas of consideration:
Entering long from the H4 ABCD measured move mentioned above at 0.6968/0.6976 is chancy, given the higher-timeframe’s position. The same goes for the H4 channel support, too. The only area of support the research team has highlighted as feasible is the 0.69 handle, in light of its relationship with daily support at 0.6907.
Before price reaches 0.69, traders might wish to consider selling the underside of 0.70. In the event this number is retested in the shape of a H4 bearish candlestick formation (entry and risk can then be adjusted according to this pattern’s structure), a sell has a strong chance of reaching as far south as 0.69ish.
Today’s data points: China CPI y/y; Fed Chair Powell Speaks; US PPI m/m; US Core PPI m/m.
USD/JPY:
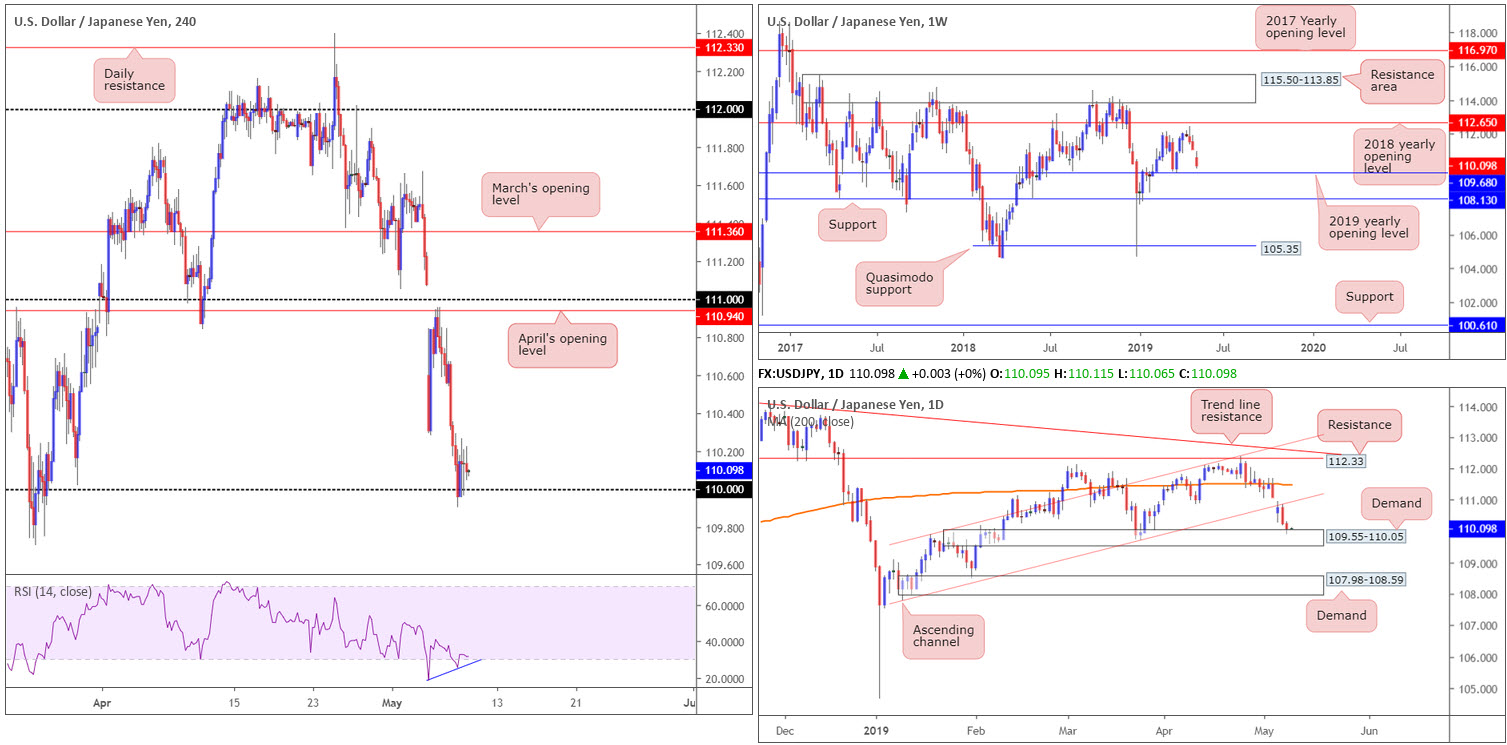
The Japanese yen continued to benefit from safe haven flows amid on-going trade uncertainty Wednesday, dropping the USD/JPY market to lows of 109.90. The 110 handle on the H4 timeframe, as you can see, is currently serving as support, though buyers lack conviction.
Interestingly, 110 boasts confirmation from the H4 RSI indicator, churning out a nice-looking positive divergence reading within oversold territory (blue line). What’s more, daily structure offers a demand area coming in at 109.55-110.05, after price action broke through a channel support-turned resistance (107.77) at the beginning of the week.
Another key thing worth highlighting is weekly price showing room to press beyond 110 to the 2019 yearly opening level at 109.68, which is also seen housed within the walls of the aforesaid daily demand zone.
Areas of consideration:
Having seen 110’s connection with daily demand mentioned above at 109.55-110.05, a bounce from this neighbourhood materialised, as expected. Owing to the threat of further selling on the weekly timeframe to 109.68, though, the said bounce from 110 may be all that’s on offer from here.
A H4 close formed beneath 110 shifts focus towards 109.68 for longs, using the lower edge of daily demand at 109.55 as a structure to base stop-loss orders. Upside targets from here naturally has 110 as an initial take-profit zone.
Today’s data points: Fed Chair Powell Speaks; US PPI m/m; US Core PPI m/m.
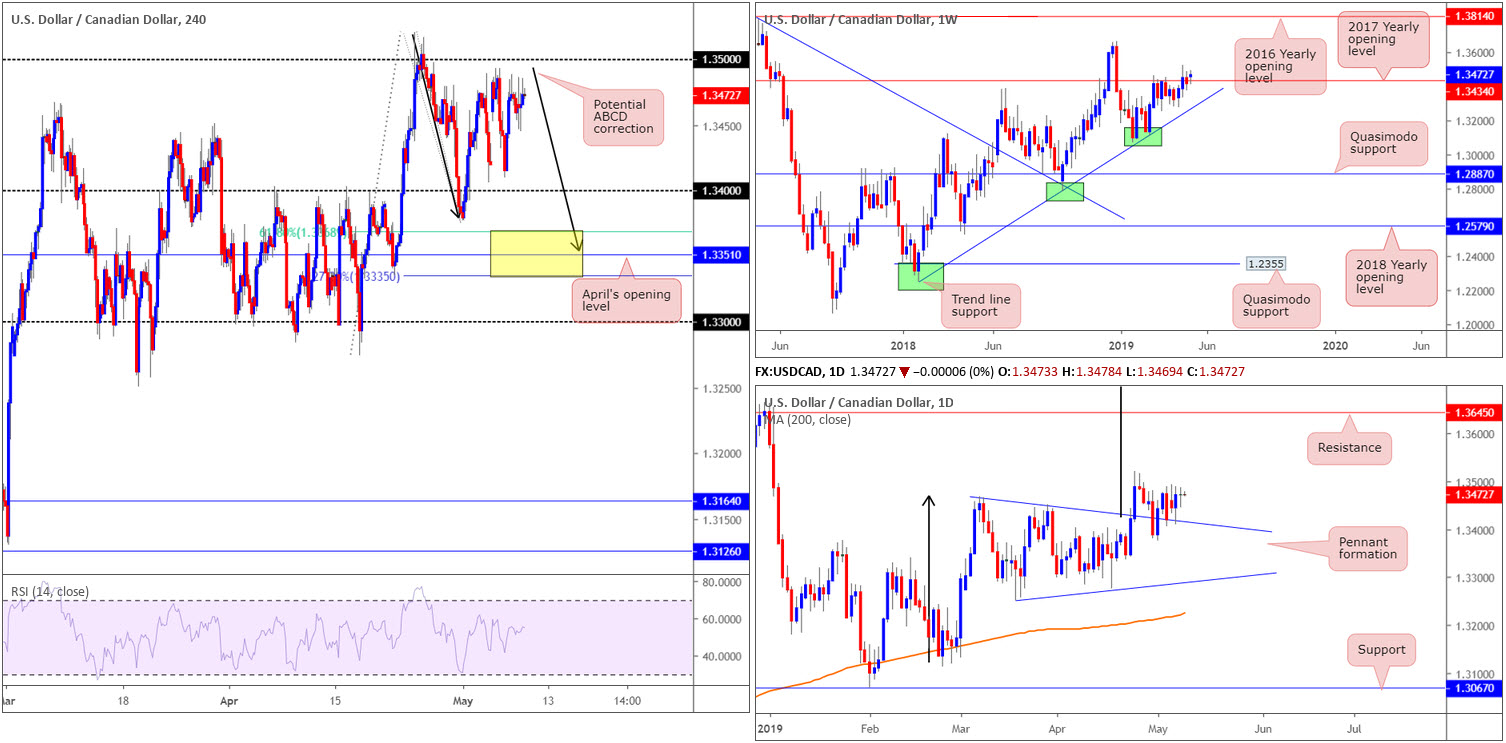
USD/CAD:
Outlook unchanged.
USD/CAD action concluded Wednesday’s segment unchanged, ranging no more than 40 points on the day and chalking up a clear-cut daily indecision candle (Doji) as a result.
In view of yesterday’s directionless performance, the following piece will echo a large portion of Wednesday’s outlook.
The H4 candles on the USD/CAD concluded the day consolidating a few points south of the 1.35 handle. As emphasised in previous reports, 1.34 could hold price action higher should a test be realised, though the more appealing area of support (in terms of H4 confluence) resides lower down on the chart between (yellow) at 1.3335/1.3368. Comprised of April’s opening level at 1.3351 as the centre line, a 61.8% Fibonacci support value at 1.3368 and a potential ABCD (black arrows) 127.2% Fibonacci ext. point at 1.3335, this zone offers reasonably robust local confluence.
On a wider perspective, longer-term flows remain circulating above the 2017 yearly opening level at 1.3434. Beneath this base, traders’ crosshairs are fixed on trend line support taken from the low 1.2247, whereas continued buying could eventually lead to a move materialising in the direction of the 2018 yearly high of 1.3664.
A closer reading of price action shows the daily candles continue to feed off support drawn from the top edge of a pennant pattern (1.3467). Although the traditional price target (calculated by taking the distance from the beginning of the preceding move and adding it to the breakout price) remains on the chart (black arrows), the next upside target from a structural standpoint falls in around resistance at 1.3645.
Areas of consideration:
On account of our technical studies, 1.34 is a level of support to watch today given its close connection with the top edge of the daily pennant pattern.
The yellow H4 zone highlighted above at 1.3335/1.3368 is also likely to offer a bounce, in view of its H4 confluence.
Irrespective of which movement takes shape, traders may want to consider waiting and seeing if the H4 candles chalk up a bullish candlestick signal (entry and risk can then be determined according to the pattern’s rules) before pulling the trigger.
In the event further buying develops before connecting with either of the above said barriers, the market may observe a H4 close form above 1.35. Should this occur, traders have the choice of either buying the breakout candle and placing stop-loss orders beneath its tail, or waiting and seeing if a retest scenario takes shape and entering on the back of the rejection candle’s structure.
Today’s data points: Fed Chair Powell Speaks; US PPI m/m; US Core PPI m/m; Canadian Trade Balance.
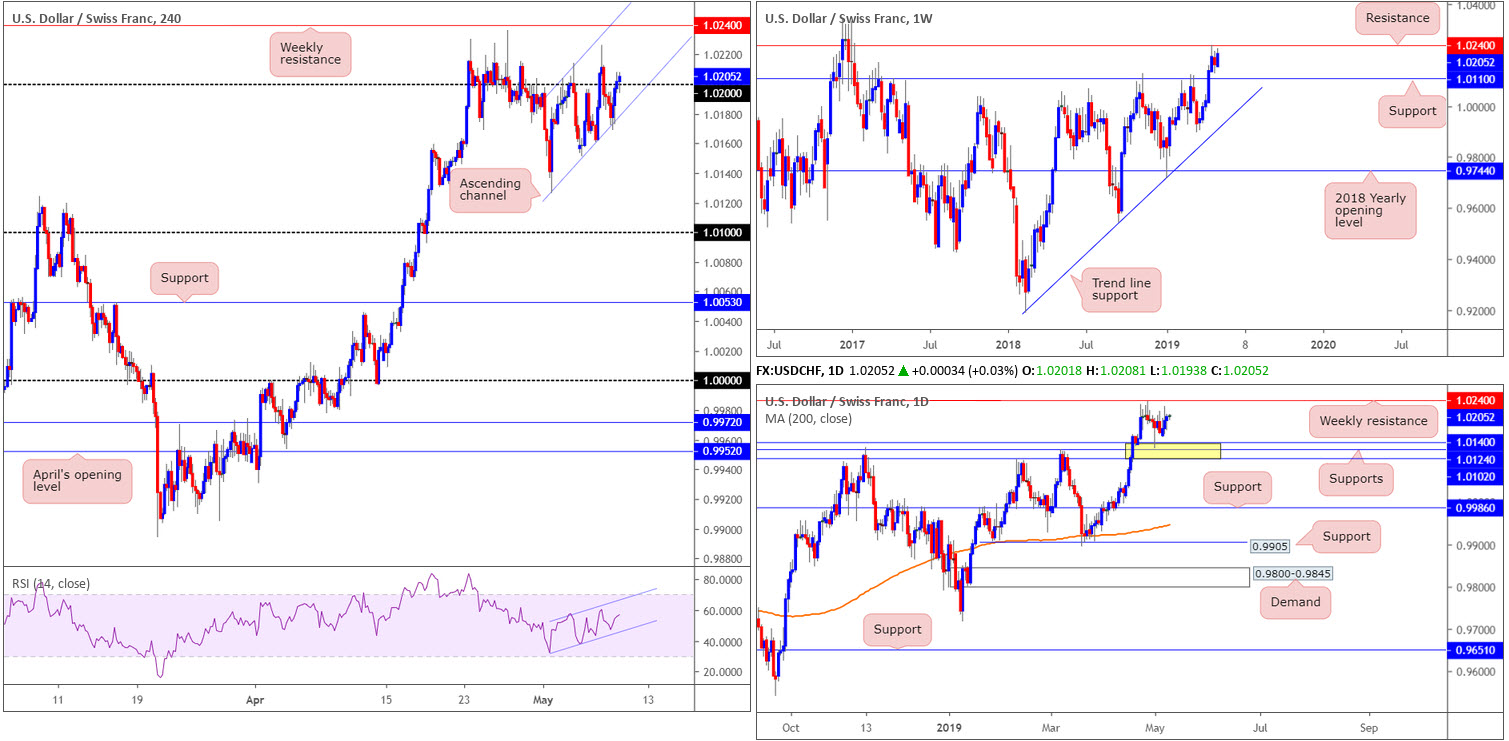
USD/CHF:
In recent sessions, USD/CHF activity reclaimed 1.02+ status on the H4 timeframe, pressing to a high of 1.0208. Compressing within the limits of an ascending channel formation, confirmed by the RSI indicator, we could potentially see the H4 candles attempt an approach towards weekly resistance pencilled in at 1.0240 today. The important thing to consider here, though, is price action has attempted to test the said weekly resistance on a number of occasions in the past and came up short. Therefore, do bear this in mind if your planning to long this market above 1.02.
Looking at weekly structure, the research team notes resistance present around 1.0240, as already highlighted above, and support coming in at 1.0110. In terms of daily flow, weekly resistance is also the next visible upside target on this scale. What’s interesting on the daily timeframe, though, is the weekly support at 1.0110 is encapsulated within the walls of daily support area between 1.0102/1.0140 (yellow).
Areas of consideration:
Short-term traders may be interested in attempting a long above 1.02 today, but, as mentioned above, do remain cognizant of the possibility of price possibly stalling prior to reaching the weekly resistance level at 1.0240.
Assuming we connect with the weekly resistance today/tomorrow, however, and remain encapsulated within the aforementioned H4 channel, selling on the breakout of the current channel to the downside is an option.
Today’s data points: Fed Chair Powell Speaks; US PPI m/m; US Core PPI m/m.
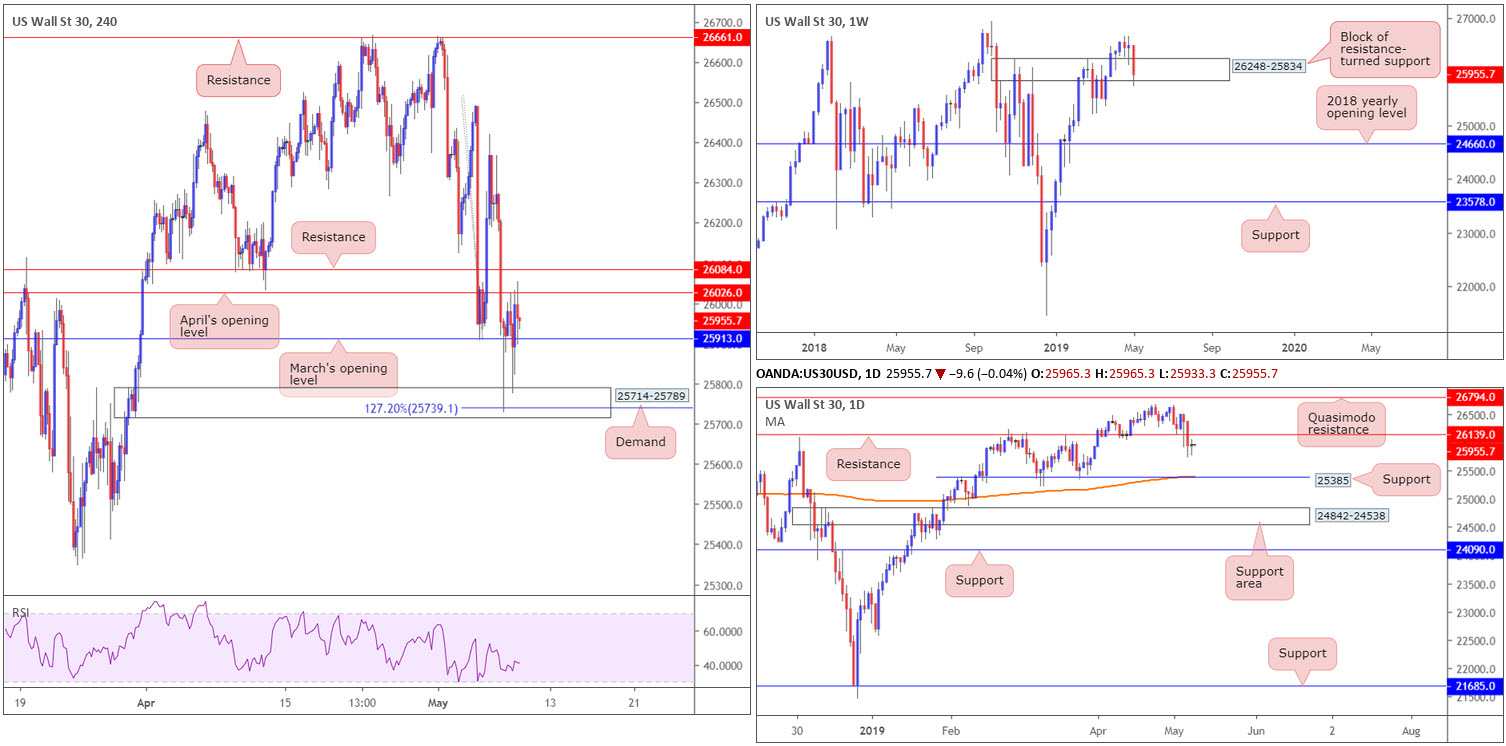
Dow Jones Industrial Average:
Outlook unchanged.
US equity indexes concluded Wednesday’s session mixed, as trade uncertainty between the US and China continues to plague markets. According to press reports, US President Trump is not backing away from his tariff threats, and the US will raise tariffs on USD 200bln worth of Chinese imports from 10% to 25%, effective Friday.
Beijing since responded and stated it stands ready to respond in-kind to any US tariff hikes.
The Dow Jones Industrial Average edged up 0.10%; the S&P 500 lost 0.16%, while the tech-heavy Nasdaq Composite fell 0.30%.
Technically speaking, weekly movement continues to trade around the lower edge of a resistance-turned support area at 26248-25834. A decisive break of this zone may call for a long-term target of 24660: the 2018 yearly opening level. Recent action on the daily timeframe ended by way of an indecision candle (mild Doji) beneath resistance registered at 26139. Downside from here has a clear-cut base of support in sight at 25385.
A closer reading of price action on the H4 timeframe shows the candles ended the session above March’s opening level, following a second test of demand at 25714-25789. The next upside targets on this scale fall in around April’s opening level at 26026 and resistance parked at 26084.
Areas of consideration:
Having seen daily action trade beneath resistance at 26139, and H4 price unveiling resistance close by at 26084/26026, buying this market on the back of the current weekly support area, at least right now, still may not be the path to explore.
Selling is also still equally problematic, according to our reading. Yes, we do have a clear run lower on the daily timeframe, but with weekly buyers still potentially in the fight and H4 action trading around support (25913), this market may, once again, be best left on the back burner today as neither a long nor short seems attractive.
Today’s data points: Fed Chair Powell Speaks; US PPI m/m; US Core PPI m/m.
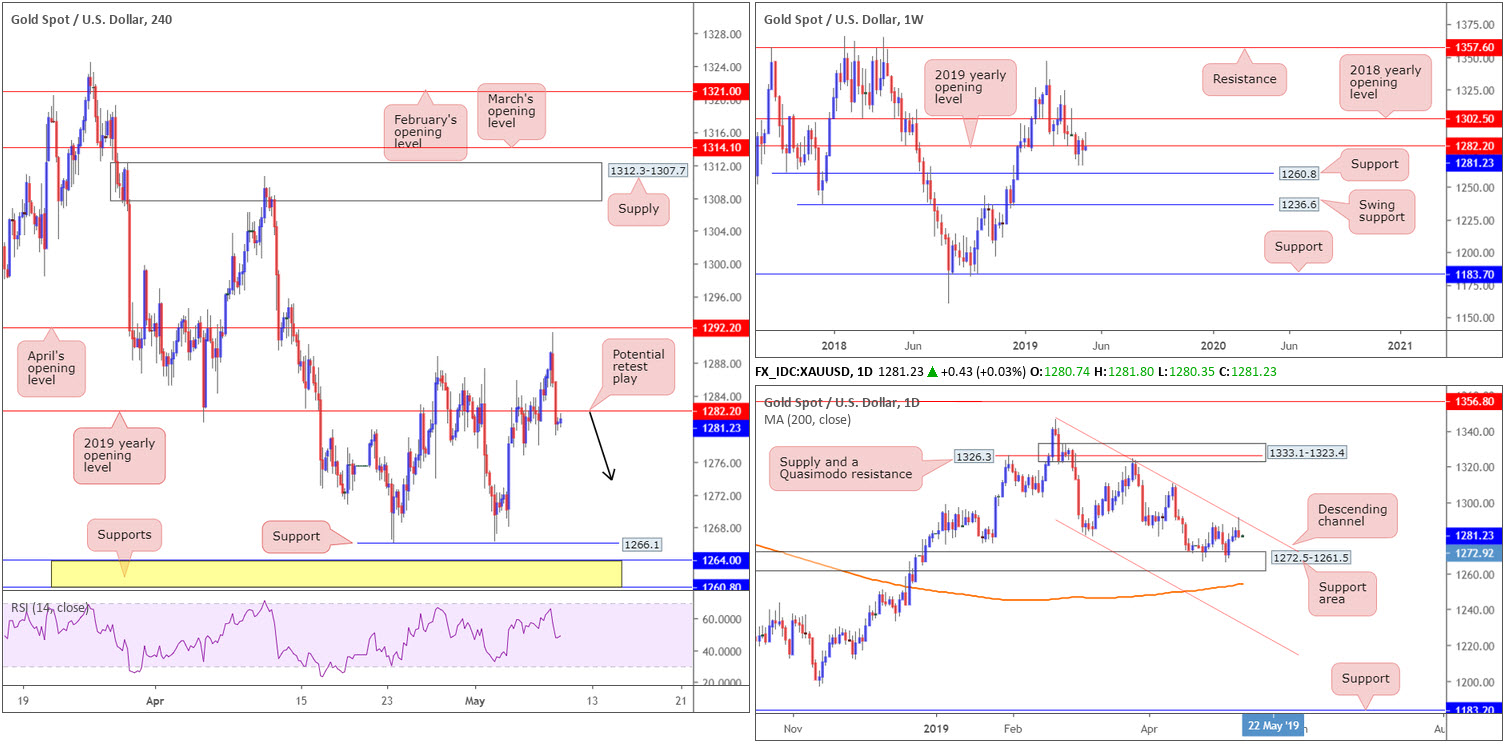
XAU/USD (GOLD):
The price of gold, in $ terms, settled at 1280.8 Wednesday, 0.26% down from where it started the day, amid mild demand for the US dollar. In the shape of a H4 bearish engulfing pattern, the yellow metal rotated south, missing April’s opening level at 1292.2 by a few points, and concluding the segment just south of the 2019 yearly opening level at 1282.2.
With room seen for the H4 candles to stretch as far south as support coming in at 1266.1, and daily flow drawing in a channel resistance (extended from the high 1346.7), further selling may be in store.
Weekly price, in relation to the aforementioned 2019 yearly opening level, has support coming in at 1260.8, whereas a decisive move above 1282.2 may call for an approach in the direction of the 2018 yearly opening level at 1302.5.
Areas of consideration:
With all three timeframes emphasising a bearish tone, focus shifts to 1282.2 for potential shorting opportunities. A H4 rejection off this barrier, preferably by way of a H4 bearish candlestick pattern (entry and risk parameters can be determined according to the formation’s structure), is considered a high-probability sell signal, targeting the top edge of a daily support area at 1272.5-1261.5 (the next downside target on the daily timeframe) as the initial downside point.
The accuracy, completeness and timeliness of the information contained on this site cannot be guaranteed. IC Markets does not warranty, guarantee or make any representations, or assume any liability with regard to financial results based on the use of the information in the site.
News, views, opinions, recommendations and other information obtained from sources outside of www.icmarkets.com.au, used in this site are believed to be reliable, but we cannot guarantee their accuracy or completeness. All such information is subject to change at any time without notice. IC Markets assumes no responsibility for the content of any linked site. The fact that such links may exist does not indicate approval or endorsement of any material contained on any linked site.
IC Markets is not liable for any harm caused by the transmission, through accessing the services or information on this site, of a computer virus, or other computer code or programming device that might be used to access, delete, damage, disable, disrupt or otherwise impede in any manner, the operation of the site or of any user’s software, hardware, data or property.


