
A note on lower timeframe confirming price action…
Waiting for lower timeframe confirmation is our main tool to confirm strength within higher timeframe zones, and has really been the key to our trading success. It takes a little time to understand the subtle nuances, however, as each trade is never the same, but once you master the rhythm so to speak, you will be saved from countless unnecessary losing trades. The following is a list of what we look for:
- A break/retest of supply or demand dependent on which way you’re trading.
- A trendline break/retest.
- Buying/selling tails/wicks – essentially we look for a cluster of very obvious spikes off of lower timeframe support and resistance levels within the higher timeframe zone.
- Candlestick patterns. We tend to only stick with pin bars and engulfing bars as these have proven to be the most effective.
We search for lower timeframe confirmation between the M15 the H1 timeframes, since most of our higher-timeframe areas begin with the H4. Stops are usually placed 5-10 pips beyond confirming structures.
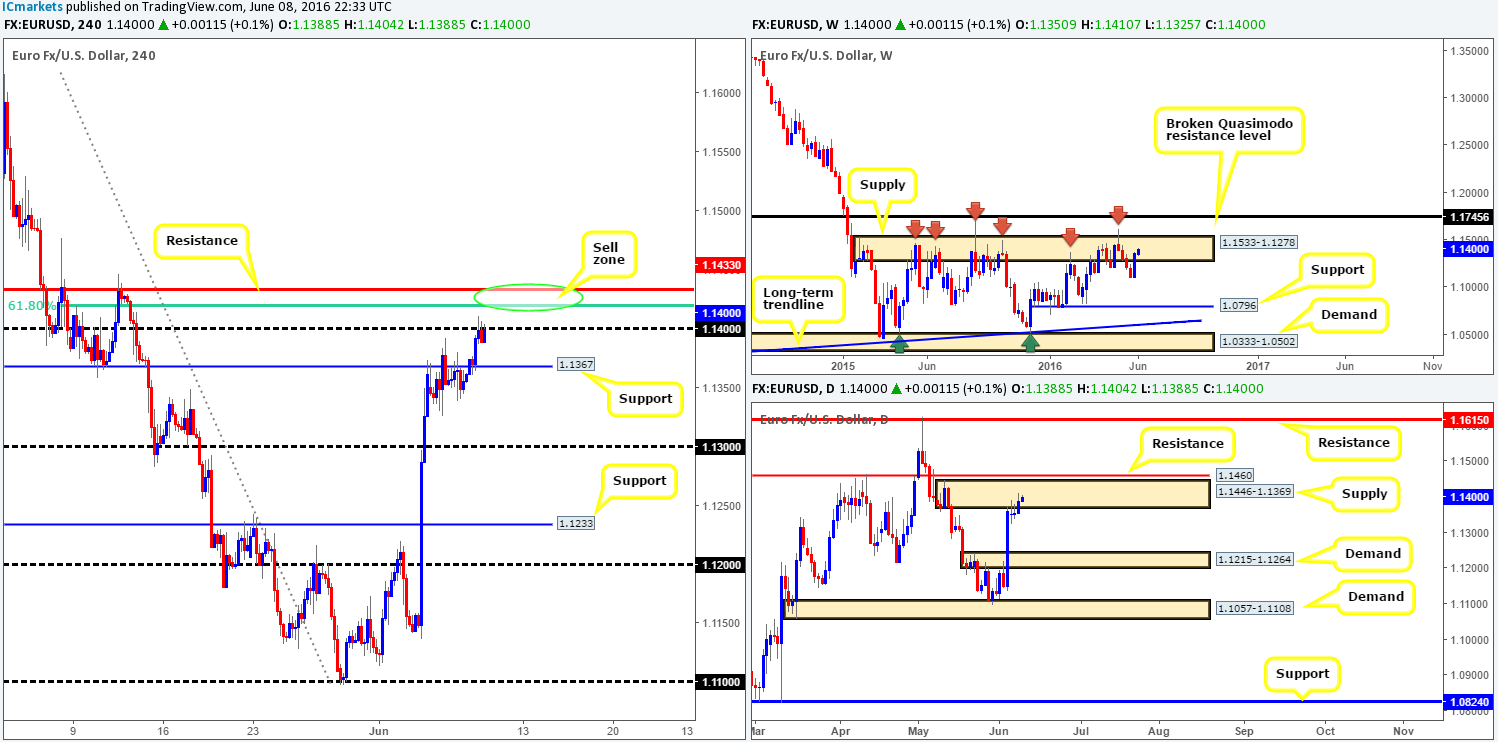
EUR/USD:
Starting from the top this morning, we can see that the bulls continue to give the bears a hard time within the weekly supply area seen at 1.1533-1.1278. However, considering that this weekly zone has managed to cap upside since May 2015, pushing this market higher will not be an easy feat for the bulls to achieve in our opinion.
Sliding down to the daily chart, the shared currency remains trading within daily supply chalked up at 1.1446-1.1369. Although the bears are struggling to hold ground at the moment, price has yet to close beyond Monday’s high point at 1.1392.
Stepping across to the H4 chart, resistance at 1.1367 (now acting support) was taken out during yesterday’s sessions, allowing price to connect with the 1.14 handle into the close. There is, as you can see, already selling interest forming around this region, but this is not really a place we’d look on favorably for shorts. The reason for why comes from seeing a beautiful-looking H4 resistance line planted just above it at 1.1433, coupled with a H4 61.8% Fib resistance line just below at 1.1418 (green circle).
Our suggestions: Watch for shorting opportunities between the H4 1.1433/1.1418 region today. Waiting for lower timeframe confirmation to form before pulling the trigger is, in our opinion, the safest route to take here since a whipsaw through our H4 sell zone is likely. Confirmation could be in the form of an engulf of demand followed by a retest, a trendline break/retest or simply a collection of selling wicks around resistance (see the top of this report).
Levels to watch/live orders:
- Buys: Flat (Stop loss: N/A).
- Sells: 1.1433/1.1418 [Tentative – confirmation required] (Stop loss: dependent on where one confirms this area).
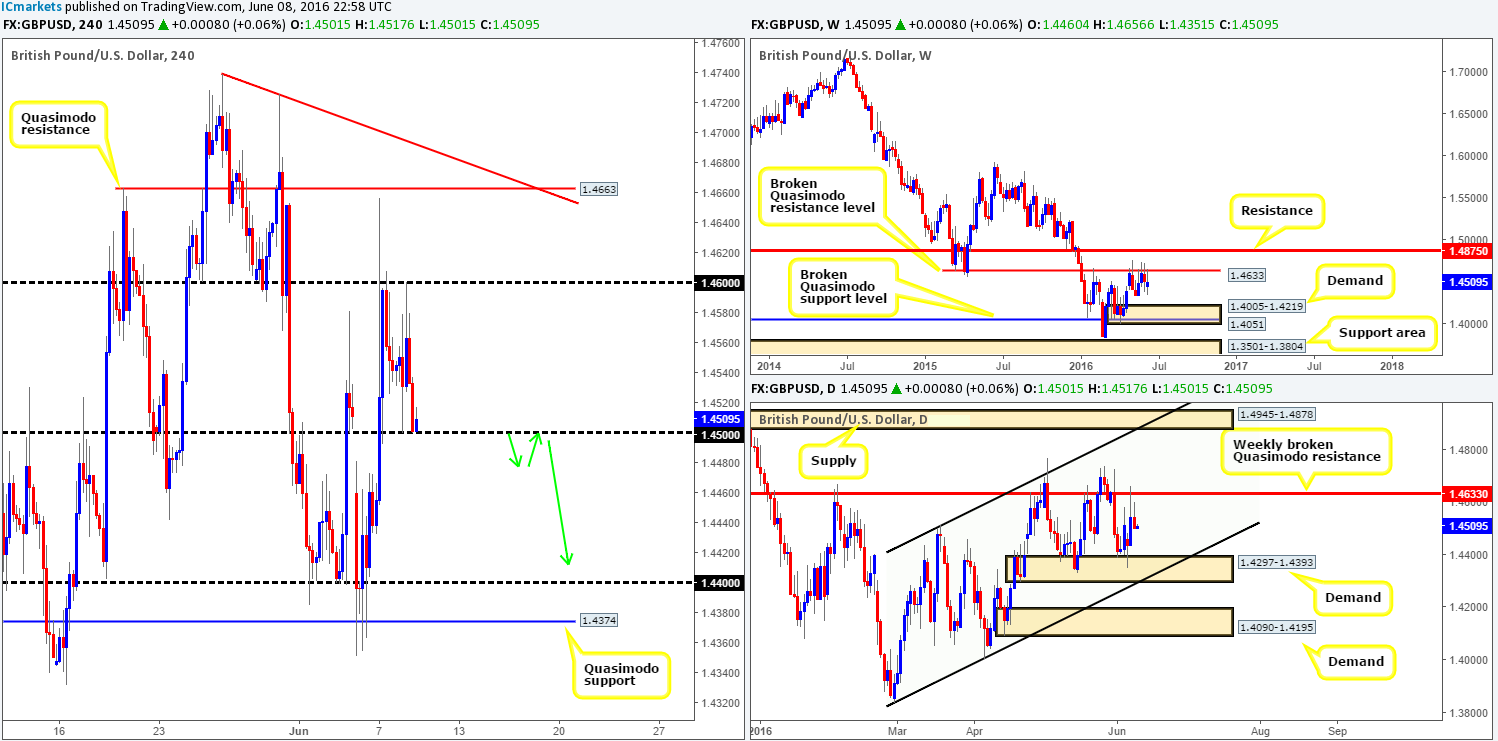
GBP/USD:
In recent trading, the British pound attacked offers around the 1.46 handle mid-way through yesterday’s London session, which, as can be seen from the H4 chart, forced cable back down to 1.45 by the close. In view of the higher timeframe picture trading from a weekly broken Quasimodo resistance line (BQM) at 1.4633, and daily action showing room to move lower down to daily demand at 1.4297-1.4393, we have zero interest in entering long from 1.45 today.
Our suggestions: Watch for price to close below and retest 1.45 (as per the green arrows). This would likely open the gates for this market to challenge the 1.44 band, which sits just above the aforementioned daily demand zone.
Of course, it is down to the individual trader how levels are confirmed; some are aggressive, while some are conservative. In regards to the case above, our team will require lower timeframe confirmation to be seen following a retest of 1.45 (see the top of this report for details). This is not only because of the expected volatility surrounding the ‘Brexit’ situation, but also since psychological numbers are prone to whipsaws!
Levels to watch/live orders:
- Buys: Flat (Stop loss: N/A).
- Sells: Watch for price to consume 1.45 and look to trade any retest seen thereafter (lower timeframe confirmation required).
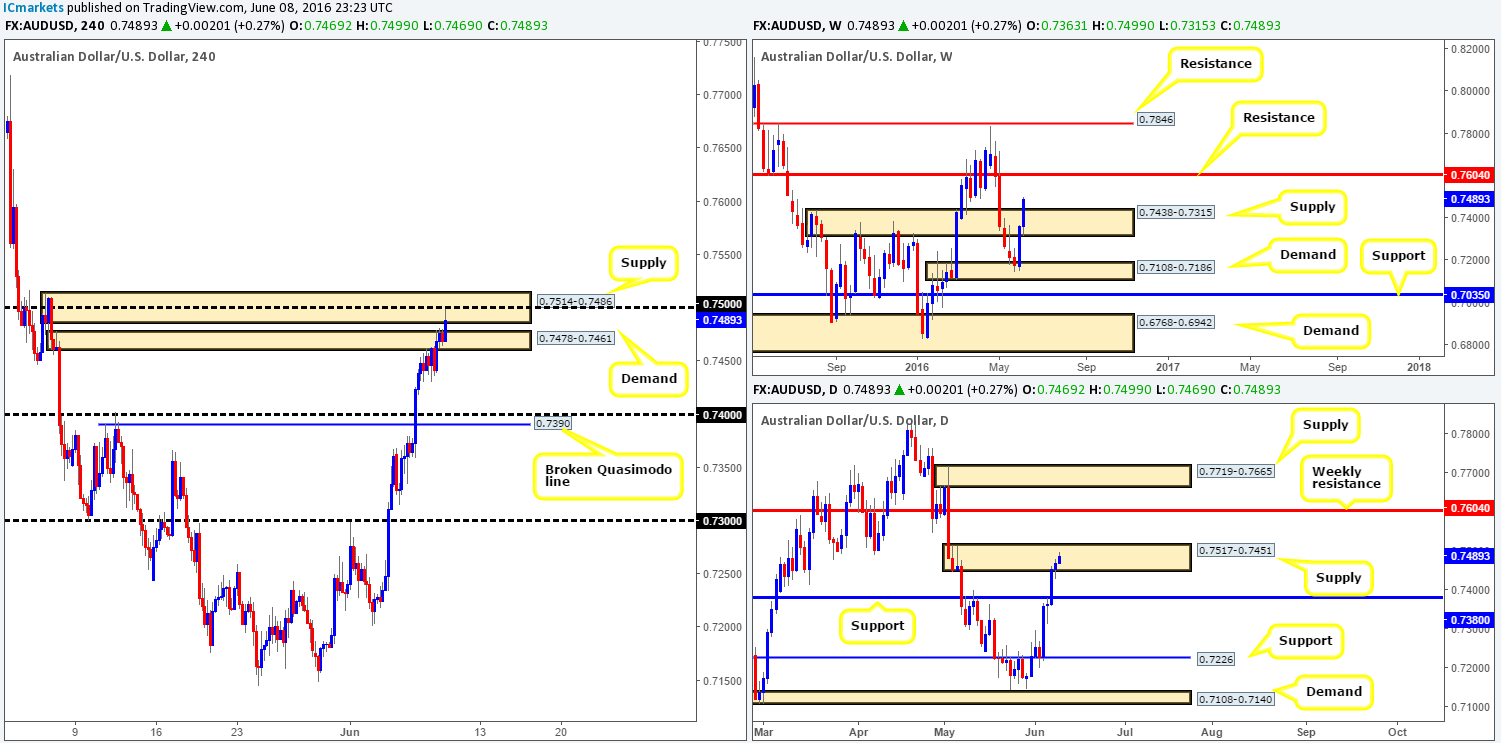
AUD/USD:
Yesterday’s push higher marks the fourth consecutive bullish day for this pair! The big question for us now is how long can the buyers sustain this momentum? Well, with the H4 chart showing price now touching gloves with H4 supply at 0.7514-0.7486 (fuses with the 0.75 handle), and daily price still housed within daily supply seen at 0.7517-0.7451, a bounce lower could be seen. Nevertheless, this will not be an easy feat to accomplish in our opinion. Not only is weekly price trading above weekly supply at 0.7438-0.7315, but there is also H4 demand at 0.7478-0.7461 (prior supply) lurking just below.
Our suggestions: From our perspective, there is no clear direction being presented on the charts at the moment. Yes, one could look to short from the current H4 supply, but considering the strong break above weekly supply and near-term H4 demand planted just below (see above), this would, in our book, be a stressful trade to put oneself in.
Levels to watch/live orders:
- Buys: Flat (Stop loss: N/A).
- Sells: Flat (Stop loss: N/A).
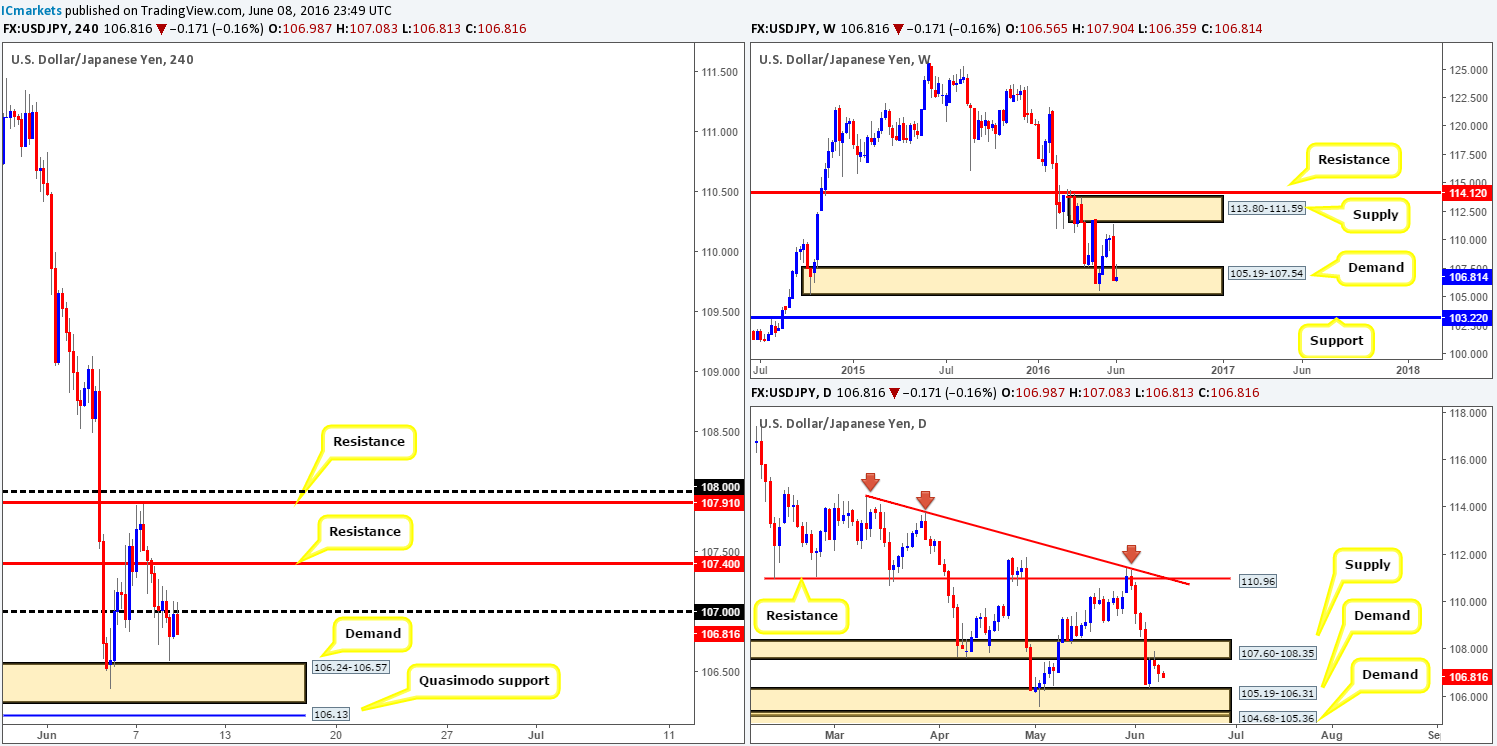
USD/JPY:
The USD/JPY edged lower amidst yesterday’s trading, managing to reach session lows of 106.59 – just above a H4 demand coming in at 106.24-106.57. As is shown on the H4 chart, price ended the day slightly recovering and jabbing into the 107 handle, consequently easing some of the day’s losses.
Meanwhile, over on the weekly chart the buyers and sellers continue to clash within the confines of a weekly demand base seen at 105.19-107.54. In the event that price is bid higher from here, the next upside target can be seen around weekly supply at 113.80-111.59. Turning our attention to the daily chart we can see that this unit is currently fixed between a daily supply zone at 107.60-108.35 and daily demand drawn from 105.19-106.31 (positioned within the extremes of the aforementioned weekly demand area).
Our suggestions: Despite this pair residing within weekly demand at 105.19-107.54, entering long from the H4 chart is difficult in that both the 107 hurdle and its neighboring H4 resistance line just above at 107.40 are close by. Of course, shorting this market would be just as difficult! Not only is there weekly demand currently in play, but daily demand at 105.19-106.31 is not too far from being brought into the action. Therefore, in the absence of clearer price action we have decided to remain flat for the time being.
Levels to watch/live orders:
- Buys: Flat (Stop loss: N/A).
- Sells: Flat (Stop loss: N/A).
USD/CAD:
The Canadian currency continued to appreciate in value yesterday, as oil prices hit highs of 51.50. Consequent to this, H4 demand at 1.2697-1.2731 was taken out and has since been retested as supply. In light of this recent break, the path south appears clear for price to head down towards the H4 mid-way support 1.2650, followed closely by the 1.26 handle.
To our way of seeing things, the weekly chart supports further selling down to weekly support at 1.2538, which blends nicely with trendline support extended from the high 1.1278. Despite this, daily price is trading deep within daily demand given at 1.2653-1.2753, so there is a chance of some buying interest being seen in this market today.
Our suggestions: Look for shorting opportunities from the H4 supply area at 1.2697-1.2731. Our preferred plan of attack here is to wait for lower timeframe confirming price action (at the time of writing we do not see any sign of confirmation) due to the possibility of buying being seen from the above said daily demand.
In our view, a move lower from the current H4 supply has the potential to decline as far as the H4 Quasimodo support at 1.2498 (sits forty or so pips below the aforementioned weekly support).
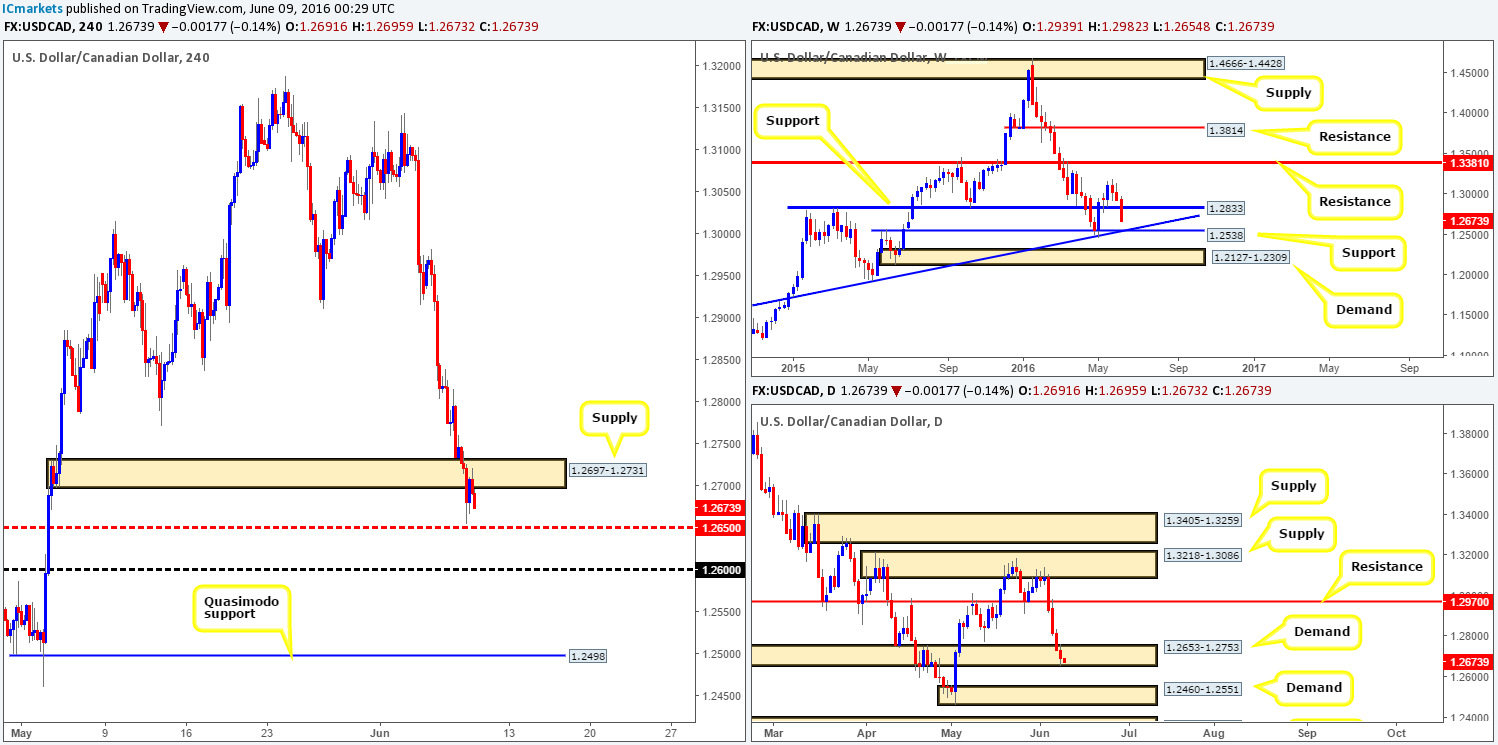
Levels to watch/live orders:
- Buys: Flat (Stop loss: N/A).
- Sells: 1.2697-1.2731 [Tentative – confirmation required] (Stop loss: dependent on where one confirms this area).
USD/CHF:
The USD/CHF is taking a right hammering at the moment, with close to 200 pips already being erased this week so far. From a technical standpoint, the weekly chart shows room for this selling to continue down to at least weekly support seen at 0.9508 (boasts trendline confluence from the low 0.9078). In spite of this, the Swissy recently came into contact with a daily Quasimodo support at 0.9584, which for now is holding firm. Should this line cave in, this would likely place 0.9498 (another daily Quasimodo support) in the picture which lurks just below the aforementioned weekly support. Looking over to the H4 chart, psychological support 0.96 was recently taken out, potentially opening the path south for prices to test H4 demand at 0.9530-0.9558.
Our suggestions: Watch for price to retest 0.96 and hold firm. If a lower timeframe signal is seen to short following the retest (see the top of this report for confirming techniques), we would, considering what the weekly picture is showing right now (see above), look to short, targeting H4 demand at 0.9530-0.9558 as our immediate take-profit zone, followed closely by the daily Quasimodo support at 0.9498.
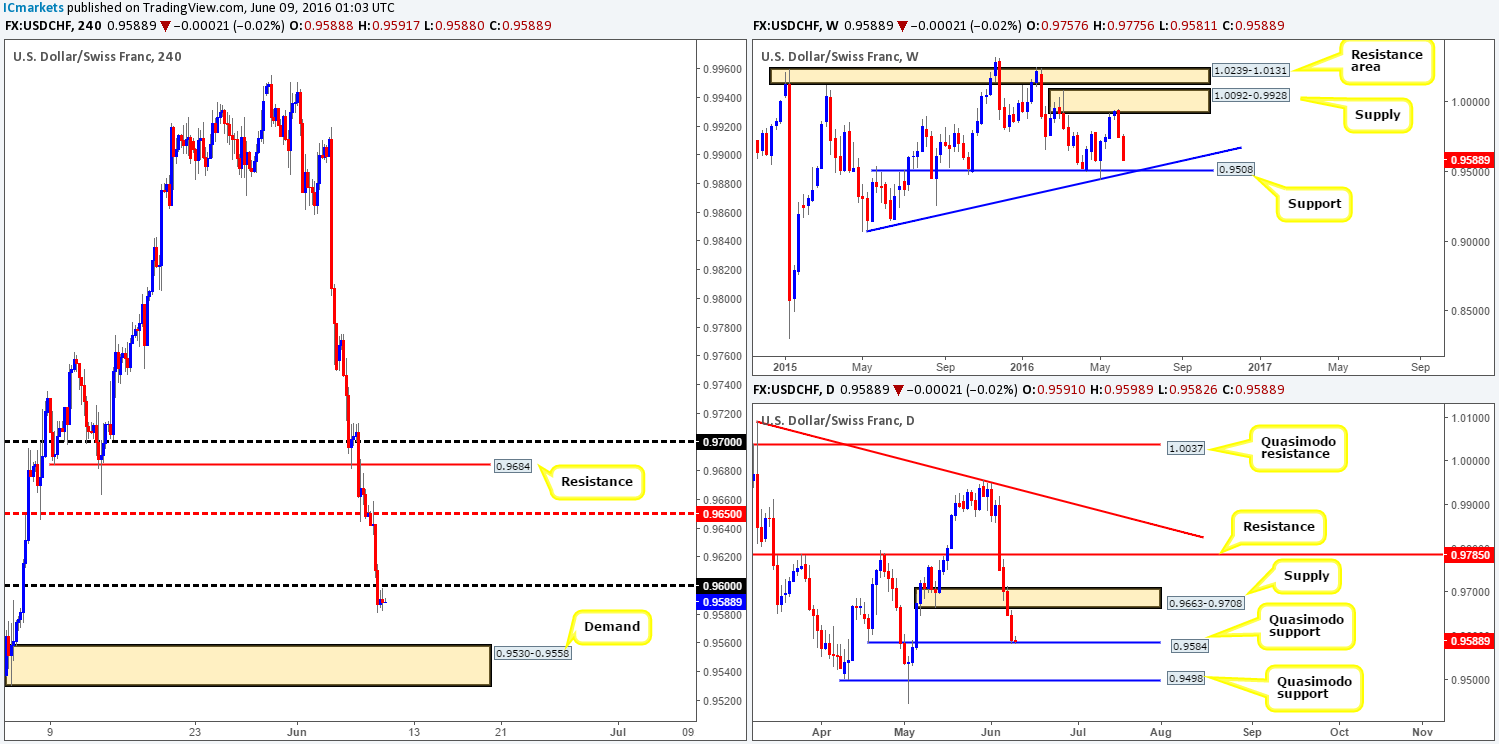
Levels to watch/live orders:
- Buys: Flat (Stop loss: N/A).
- Sells: 0.9600 region [Tentative – confirmation required] (Stop loss: dependent on where one confirms this area).
DOW 30:
For those who read our previous report on the DOW (see link below) you may recall us mentioning to keep an eye on the H4 support level at 17920 for a potential long opportunity. As we can all see, price rallied beautifully from this barrier yesterday, and has since then broke above Tuesday’s high at 18003. Well done to any of our readers who managed to jump aboard this setup.
With a collection of H4 selling wicks seen forming around Tuesday’s high point, there is a possibility that this index may give back some of yesterday’s gains today. Therefore, for anyone currently long this market from out buy line, it may be an idea to reduce risk to breakeven and take 50% of the position off the table. Should price revisit the 17920 hurdle today, we would look to try and enter long again (with lower timeframe confirmation – see the top of this report), since the next upside target on the H4 does not come into view until 18050 – a H4 Quasimodo resistance.
In addition to the above points, both the weekly and daily charts still show room to move higher. The next upside target on the weekly chart is not seen until 18365-18158 (a weekly resistance area), whilst the daily chart shows potential to move up to daily supply at 18186-18117.
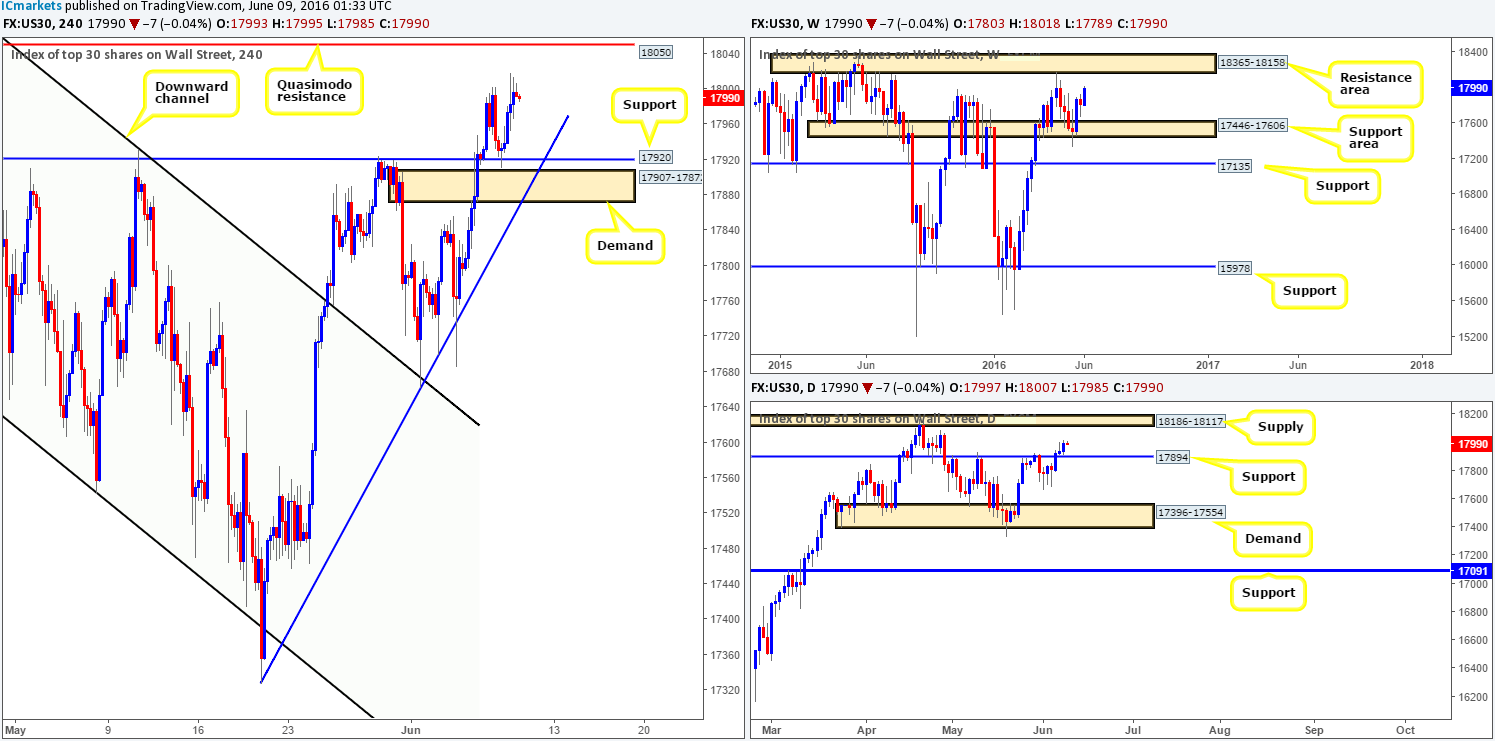
Levels to watch/live orders:
- Buys: 17920 region [Tentative – confirmation required] (Stop loss: dependent on where one confirms this area).
- Sells: Flat (Stop loss: N/A).
GOLD:
With a general bearish tone seen on the dollar yesterday, the shiny metal rallied to highs of 1264.2 on the day. This, as can be seen from the H4 chart, saw price cut through both H4 supply at 1252.1-1248.2 (now acting demand), and also H4 resistance at 1260.0 (now acting support).
In consequence to the recent surge in gold buying, daily resistance penciled in at 1262.2 is now in play. This line has proved to be a noteworthy number in the past few months, but will it be enough to defend against weekly buying from weekly demand at 1205.6-1181.2? Personally, we do not think so considering that the next upside target on the weekly chart stands at a weekly supply area seen at 1307.4-1280.0.
Our suggestions: Look to go long from the H4 support barrier at 1261.8, targeting H4 resistance at 1270.6. Seeing as how the take-profit target is relatively close and there is always a chance that price may whipsaw through the aforementioned H4 support before rallying, our team will look to the lower timeframes for a confirmed entry. This could be in the form of an engulf of supply followed by a retest, a trendline break/retest or simply a collection of buying tails around support (see the top of this report for more details).
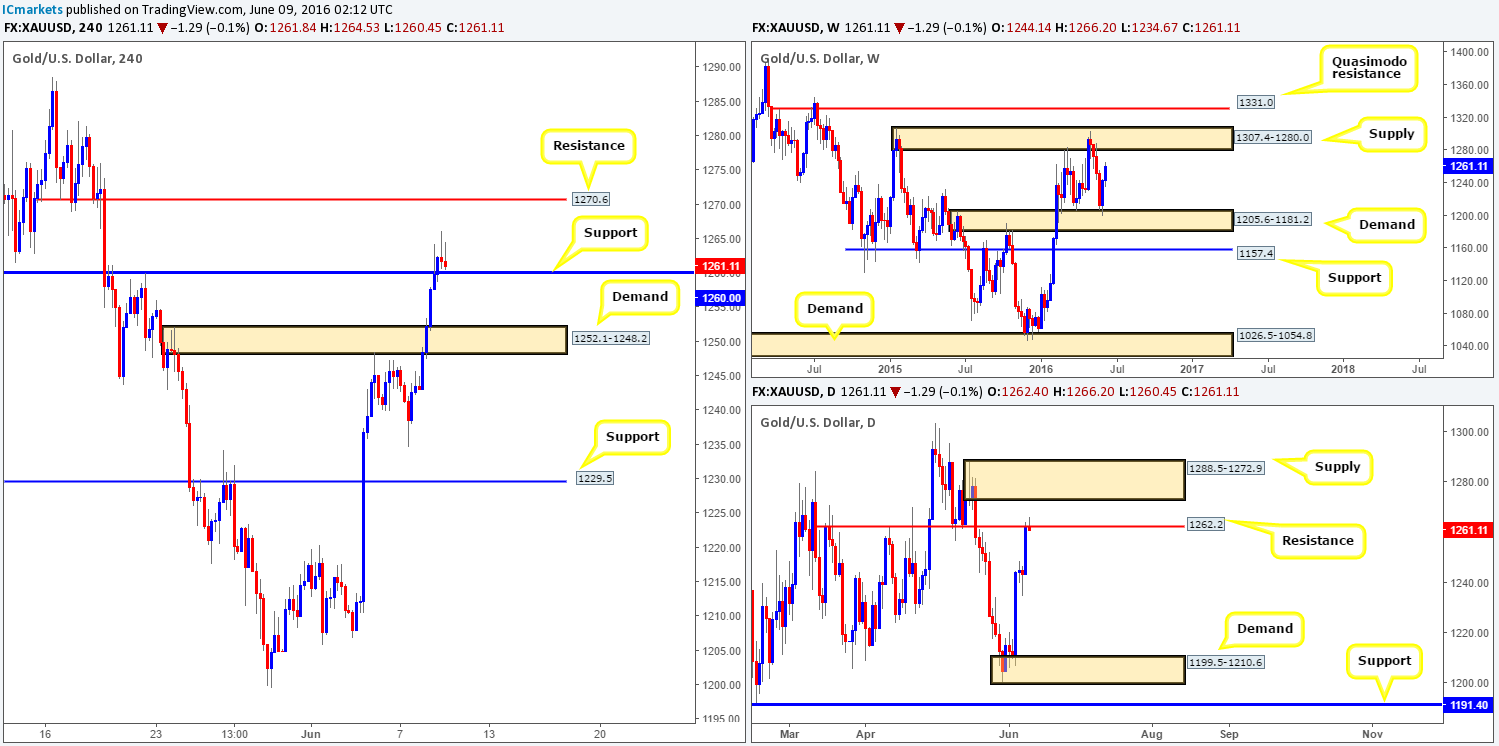
Levels to watch/live orders:
- Buys: 1260.0 region [Tentative – confirmation required] (Stop loss: dependent on where one confirms this area).
- Sells: Flat (Stop loss: N/A).


