
Key risk events today:
New Zealand ANZ Business Confidence; Eurogroup Meetings; US Unemployment Claims.
(Previous analysis as well as outside sources – italics).
EUR/USD:
In recent sessions, the US dollar index softened through 96.50 and poured cold water on any hopes of recovery above 97.00.
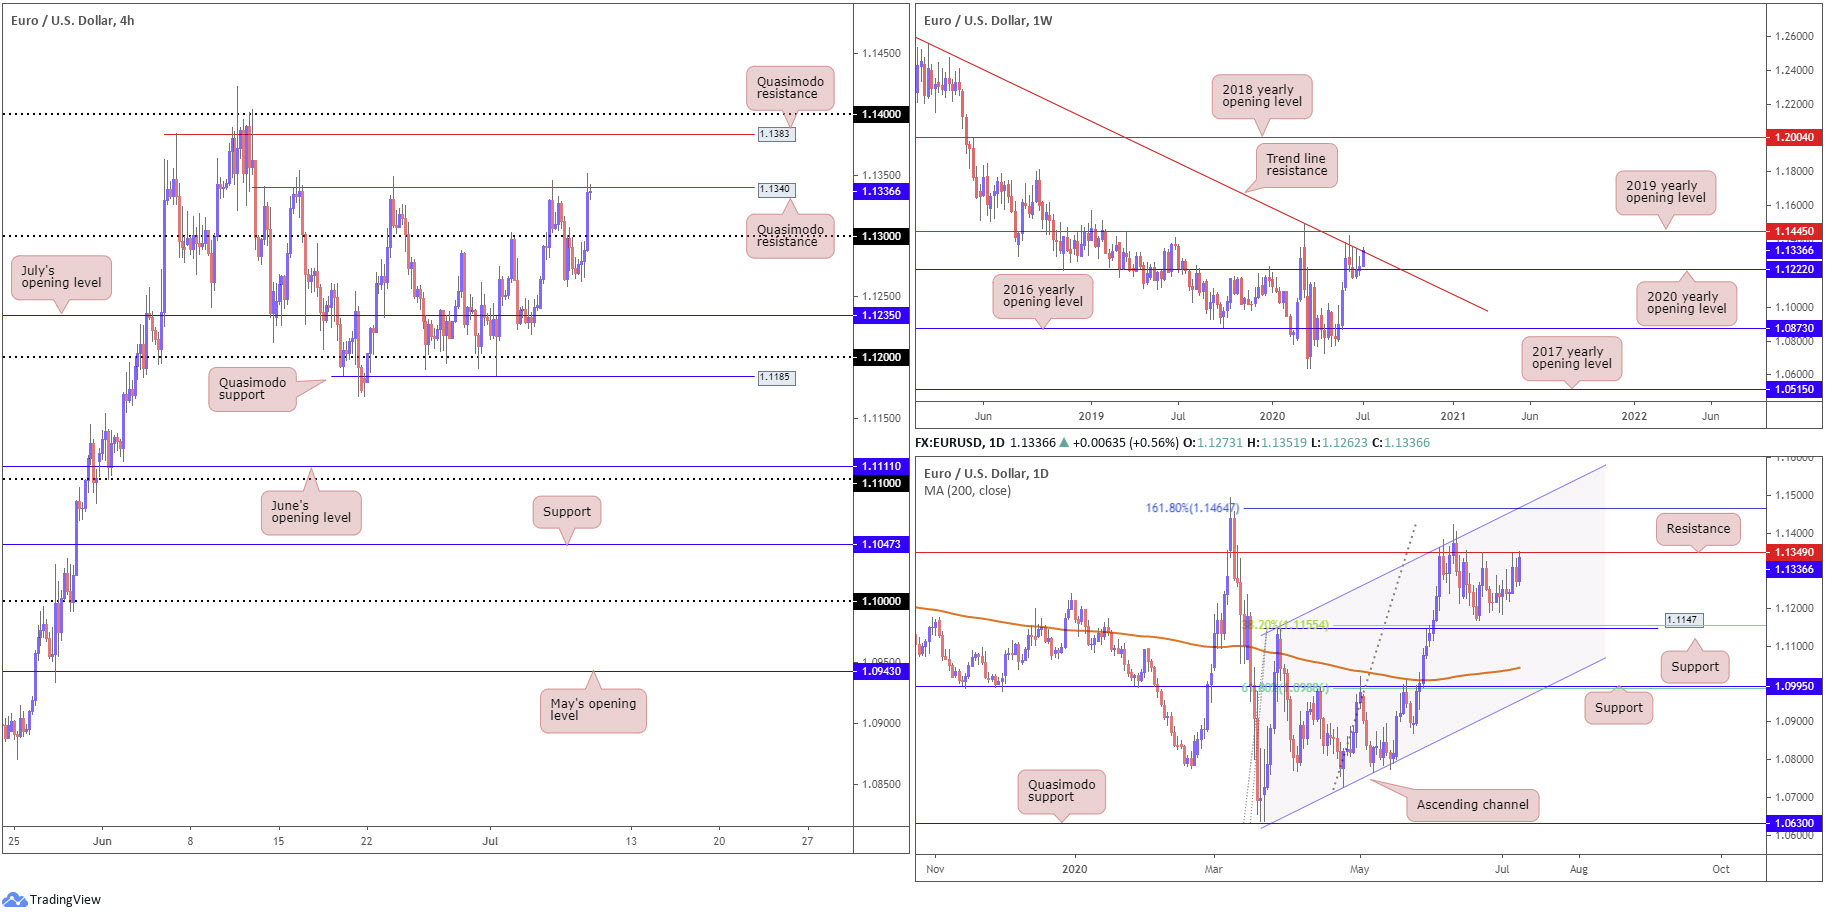
EUR/USD bulls entered an offensive phase, conquering 1.13 and reconnecting with familiar H4 Quasimodo resistance at 1.1340.
Sellers appear weakened on the H4 scale, incapable of holding under 1.13. The aforementioned Quasimodo resistance also seems equally fragile. Any sustained move above 1.1340 today places another H4 Quasimodo resistance in the firing range at 1.1383, closely shadowed by the 1.14 handle.
Trade on the weekly timeframe remains contained between the 2020 yearly opening level at 1.1222 and long-standing trend line resistance, taken from the high 1.2555, with the latter making an appearance in recent trade. Further buying here shifts focus to the possibility of reaching the 2019 yearly opening level at 1.1445, while a dip to lower levels highlights the 2016 yearly opening level at 1.0873.
Since the beginning of June on the daily timeframe, resistance at 1.1349 has capped upside, a level challenged once again yesterday. Breaking 1.1349 points to a 161.8% Fibonacci extension point at 1.1464, combined with channel resistance, extended from the high 1.1147. A decisive rejection, on the other hand, assuming we overrun the 1.1168 June 22 low, has support from the 1.1147 27 March high in view, a level that merges closely with a 38.2% Fibonacci retracement ratio at 1.1155.
Areas of consideration:
According to analysis, we’re trading at resistance across the board right now. However, each resistance echoes a delicate tone, emphasising a possible break north today.
Should the above come to fruition and a H4 close north of 1.1340 materialises, this could be an opportunity for breakout buyers, targeting H4 Quasimodo resistance at 1.1383 as the initial take-profit zone. Conservative traders, however, may seek additional confirmation before pulling the trigger, such as a retest at 1.1340 as support.
GBP/USD:
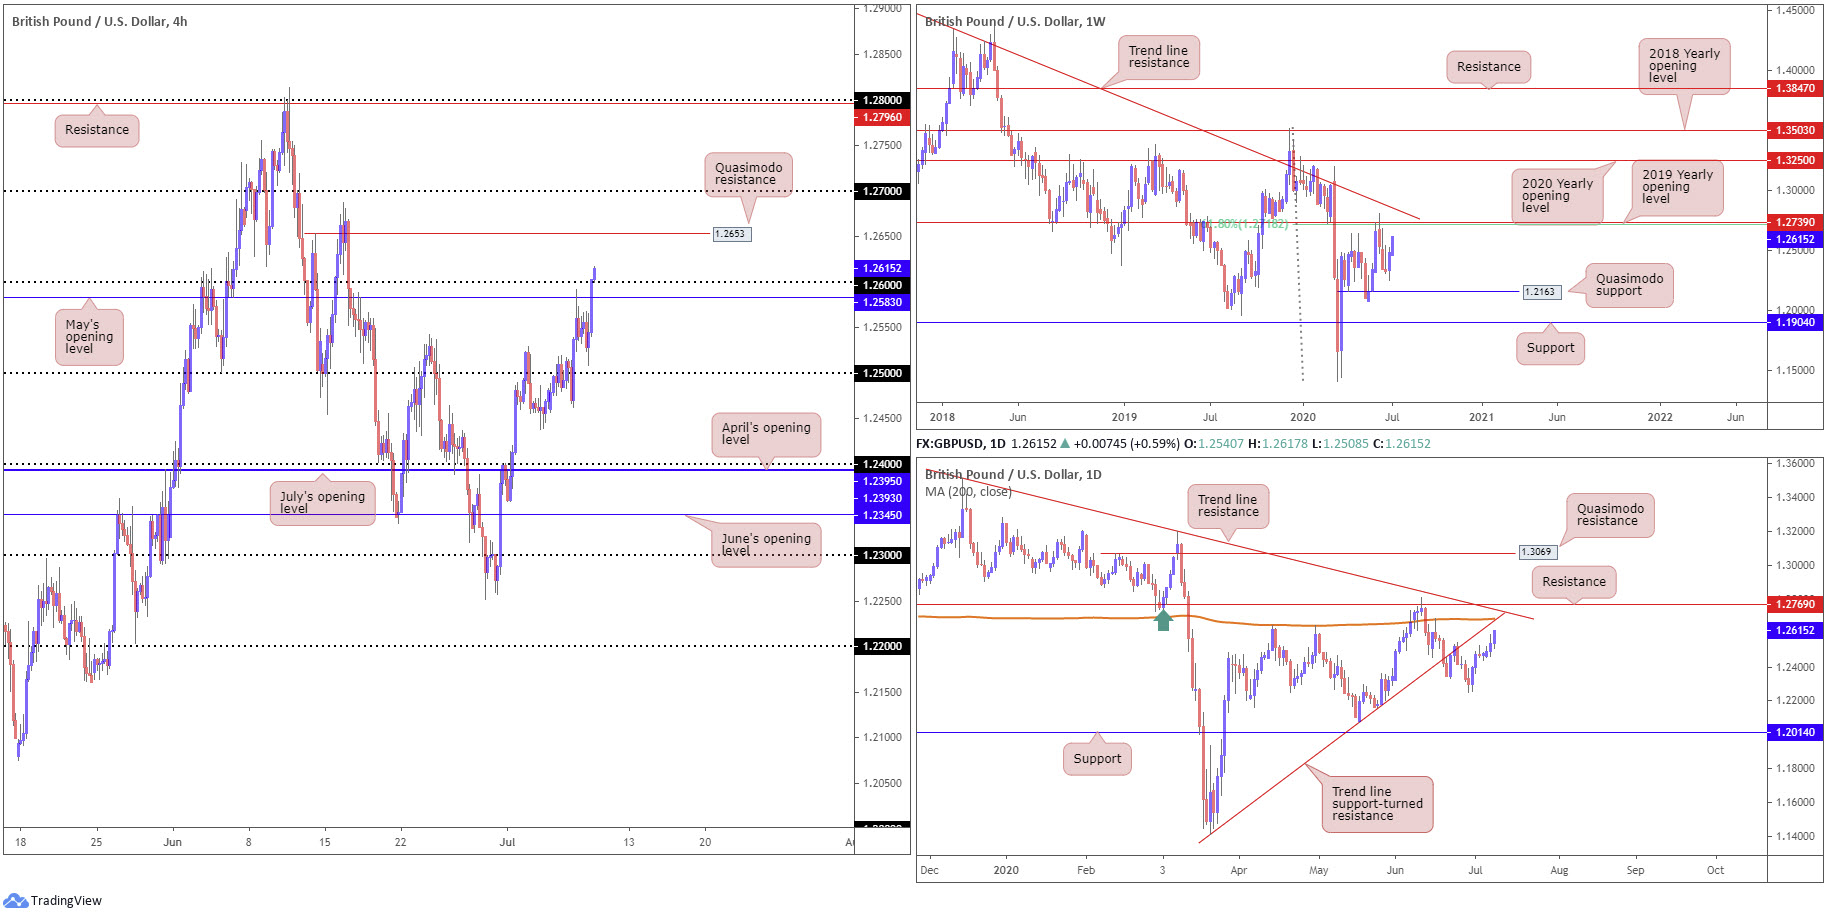
Recording its fourth consecutive daily gain Wednesday, GBP/USD attracted fresh buying as the DXY dipped a toe in waters south of 96.50. May’s opening level at 1.2583 and the 1.26 handle caved under pressure on the H4 timeframe, potentially setting the stage for an approach to Quasimodo resistance at 1.2653 and, with a little enthusiasm, the 1.27 handle.
With respect to structure on the weekly timeframe, support resides at 1.2163, a Quasimodo formation. Follow-through buying, nevertheless, may eventually see price meet with a 61.8% Fibonacci retracement ratio at 1.2718 and 2019 yearly opening level at 1.2739.
Price movement on the daily timeframe, meanwhile, is poised to engage trend line support-turned resistance, taken from the low 1.1409, converging closely with another trend line resistance, taken from the high 1.3514, and the 200-day SMA (orange – 1.2685). This combination is closely followed by resistance at 1.2769.
Areas of consideration:
The break of 1.26 will capture the attention of buyers on the H4 scale. This, alongside both weekly and daily timeframes suggesting territory north is clear until around the 1.27 handle (a point of robust resistance on the daily timeframe), will likely persuade breakout buyers to engage above 1.26 today, initially targeting H4 Quasimodo resistance at 1.2653, followed by 1.27.
AUD/USD:
The Australian dollar concluded firmer against the US dollar Wednesday, reclaiming Tuesday’s slump.
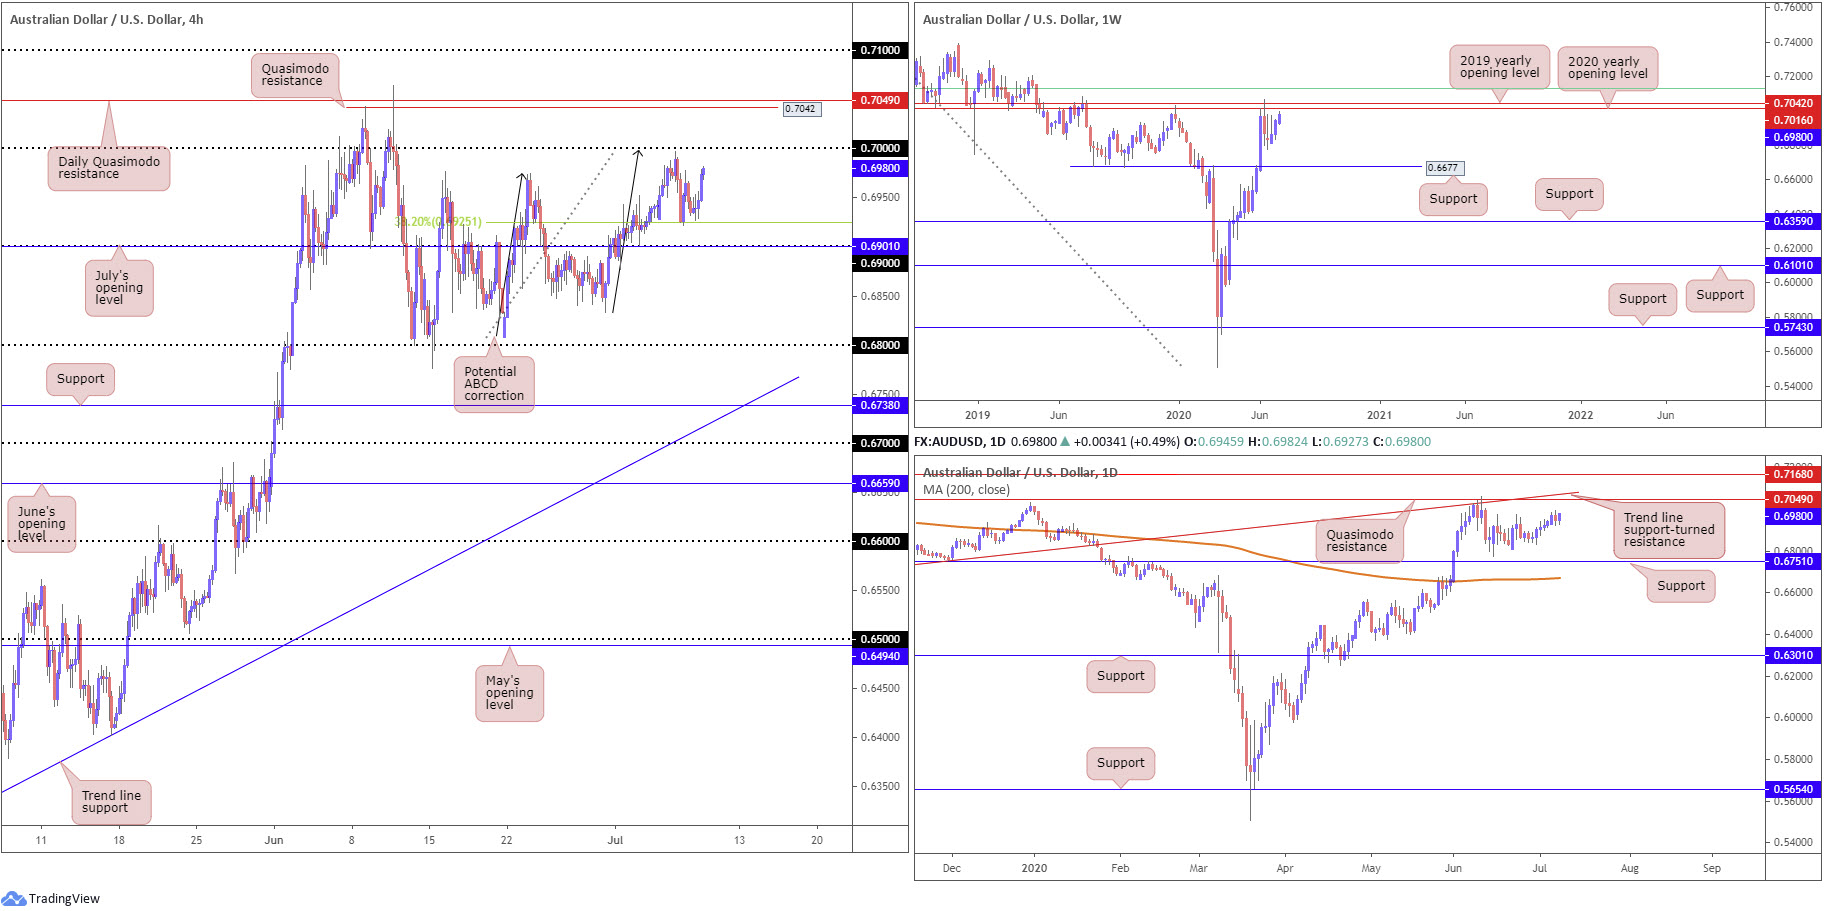
As evident from the H4 timeframe, after fading levels just south of the key figure 0.70, specifically the ABCD correction (black arrows) at 0.6997, the 38.2% Fibonacci retracement ratio at 0.6925 made an entrance (generally looked upon as the initial take-profit target out of ABCD patterns, derived from legs A-D). 0.6925, as you can see, maintained its position as a support on Wednesday, threatening the possibility of bringing in the key figure 0.70 today.
A break of 0.70 would expose Quasimodo resistance at 0.7042 and daily Quasimodo resistance at 0.7049. Note on the daily timeframe we also see the Quasimodo merging with trend line support-turned resistance, taken from the low 0.6670. Attention on the daily timeframe also remains at support coming in from 0.6751.
Resistance, forged in the shape of a 2020 yearly opening level and a 2019 yearly opening level, at 0.7016 and 0.7042, respectively, continues to offer a central presence nearby on the weekly timeframe. It might also interest traders to note just above the said resistances we have a 61.8% Fibonacci retracement ratio at 0.7128 (green). In terms of support, crosshairs remain fixed on 0.6677.
Areas of consideration:
With the round number 0.70 sharing space with weekly resistance at 0.7016, the 2020 yearly opening level, this remains a key point of resistance going into Thursday. Therefore, a fakeout above 0.70, a move that whipsaws to 0.7016 and follows through with a H4 close back under 0.70, will likely be a welcomed sight for sellers, particularly if the movement forms a bearish candlestick signal.
USD/JPY:
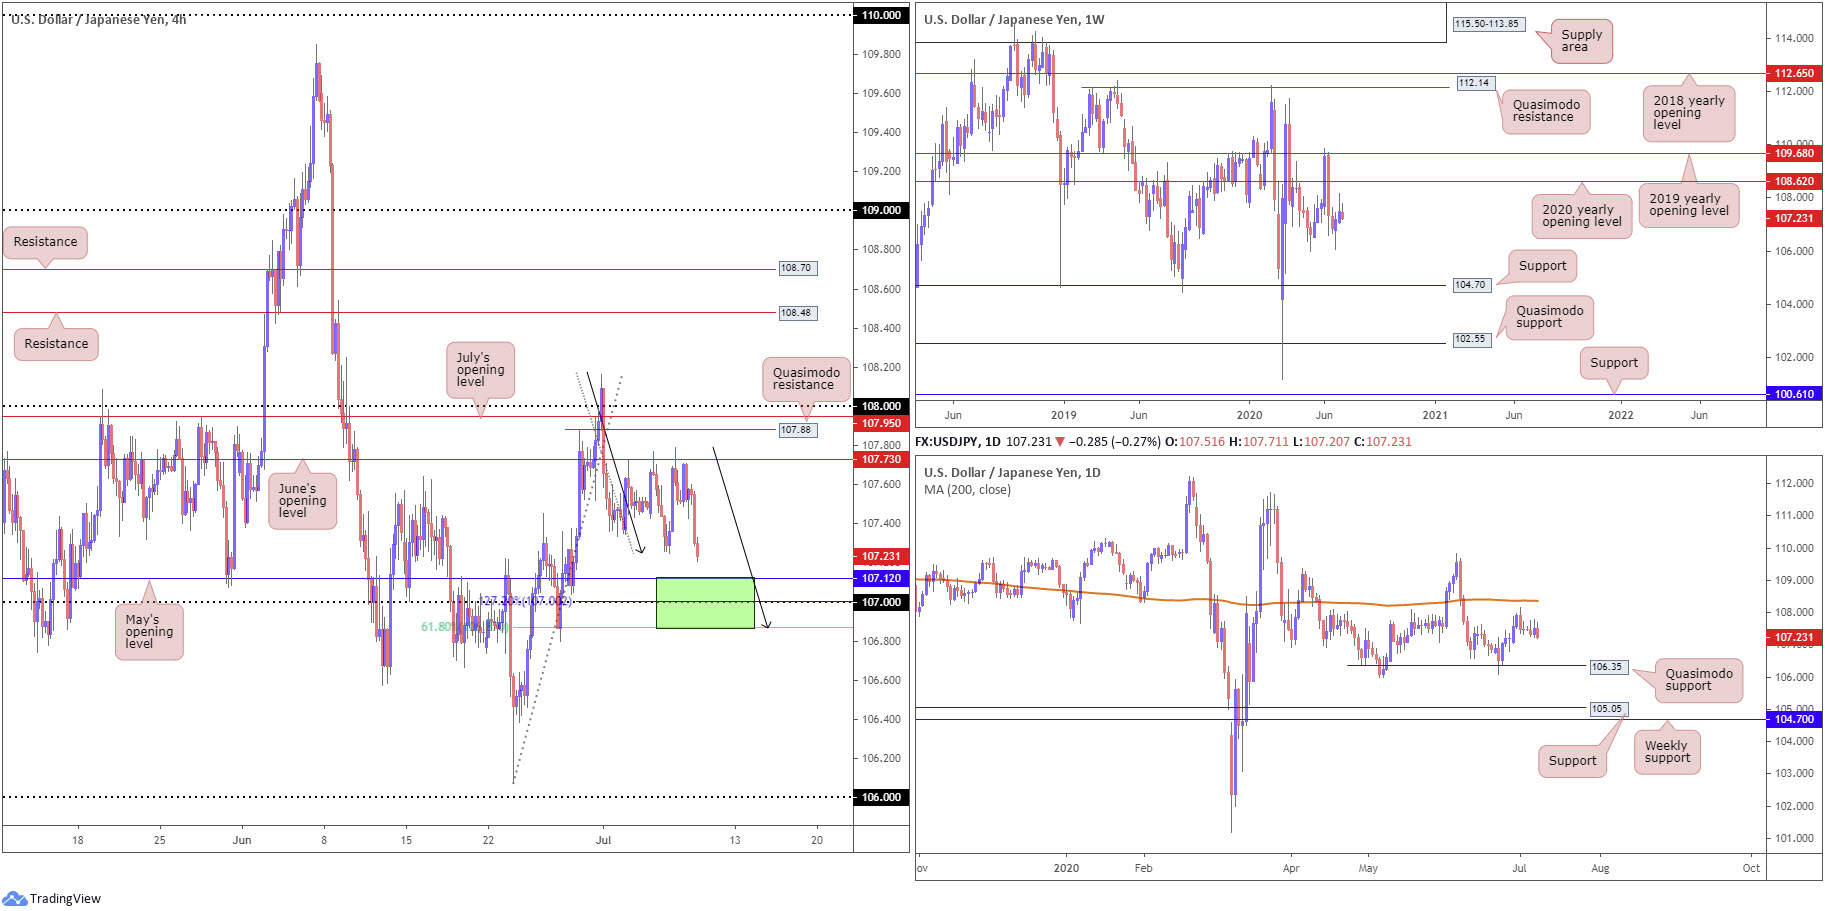
Unable to muster enough strength to overthrow June’s opening level at 107.73 on the H4 timeframe, USD/JPY, undermined by the DXY crossing underneath 96.50, is now seen heading towards May’s opening level at 107.12. Readers may also wish to acknowledge the latter is positioned nearby the 107 handle, a 127.2% Fibonacci extension point at 107.00 and a 61.8% Fibonacci retracement ratio at 106.87 (green). It might also interest some traders to note we have an AB=CD bullish correction at 106.87 (black arrows).
Resistance rests reasonably close by on the weekly timeframe by way of the 2020 yearly opening level at 108.62, followed by the 2019 yearly opening level at 109.68. Support remains fixed around the 105.98 6th May low, with a break uncovering long-term support at 104.70.
Last week on the daily timeframe, price action pencilled in a top a few pips shy of the 200-day SMA (orange – 108.36), shaped by way of a bearish outside day. The recent top (and candle formation), given the indecisive movement witnessed since, draws attention back to Quasimodo support at 106.35, the origin of the recent leg higher.
Areas of consideration:
The area between May’s opening level at 107.12, 107 and the 61.8% Fibonacci retracement ratio at 106.87 (green) is likely to entice buying interest into the market today. Nevertheless, it is worth noting the area lacks higher-timeframe convergence, therefore traders may seek additional confirmation before engaging.
USD/CAD:
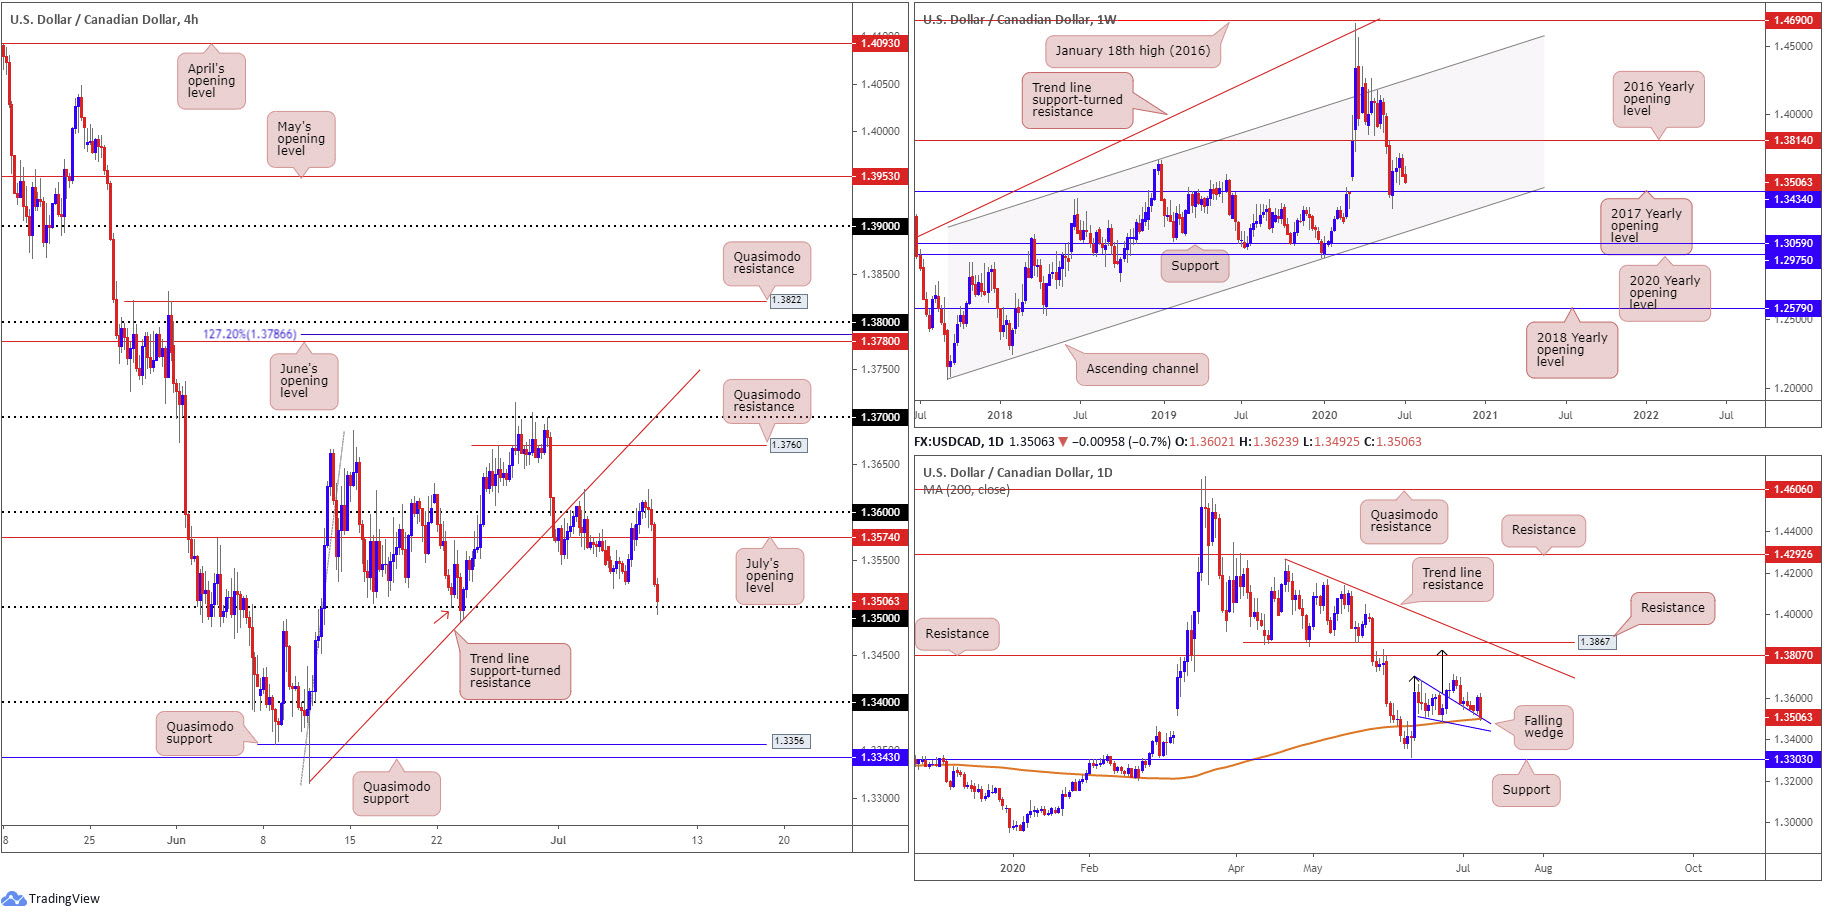
A combination of WTI knocking on the door of $41.00/bbl and the US dollar index crumbling through 96.50, guided USD/CAD approximately 100 pips south Wednesday. Leaving behind July’s opening level at 1.3574, we’re now witnessing H4 movement face the 1.35 handle, a level that also puts across a Quasimodo support (red arrow). Sinking through 1.35 today will test the resolve of buyers as relatively thin air is seen until reaching 1.34.
Interestingly, on the daily timeframe, the recent swing lower has landed price action back at the breached falling wedge pattern as a support (1.3686/1.3504), merging with the 200-day SMA (1.3499). Take-profit targets out of a falling wedge pattern can be measured by taking the base value and adding this figure to the breakout point (black arrows), which as you can see in this case, converges closely with the next daily resistance at 1.3807, followed closely by another layer of resistance at 1.3867.
On the weekly timeframe, action is positioned close by the 2017 yearly opening level at 1.3434. Beyond 1.3434, channel support, taken from the low 1.2061, can be seen as the next potential floor. A USD/CAD bid, on the other hand, throws the 2016 yearly opening level at 1.3814 in the pot as feasible resistance, with follow-through buying likely to try and tackle a dense block of supply between 1.4190/1.3912.
Areas of consideration:
1.35, based on the H4, is an interesting level today. Not only does it come with a H4 Quasimodo support, it also brings with it a 200-day SMA at 1.3499 and daily wedge support. This confluence may be enough to stir buyers and draw to higher levels today, targeting July’s opening level at 1.3574 as an initial port of call.
USD/CHF:
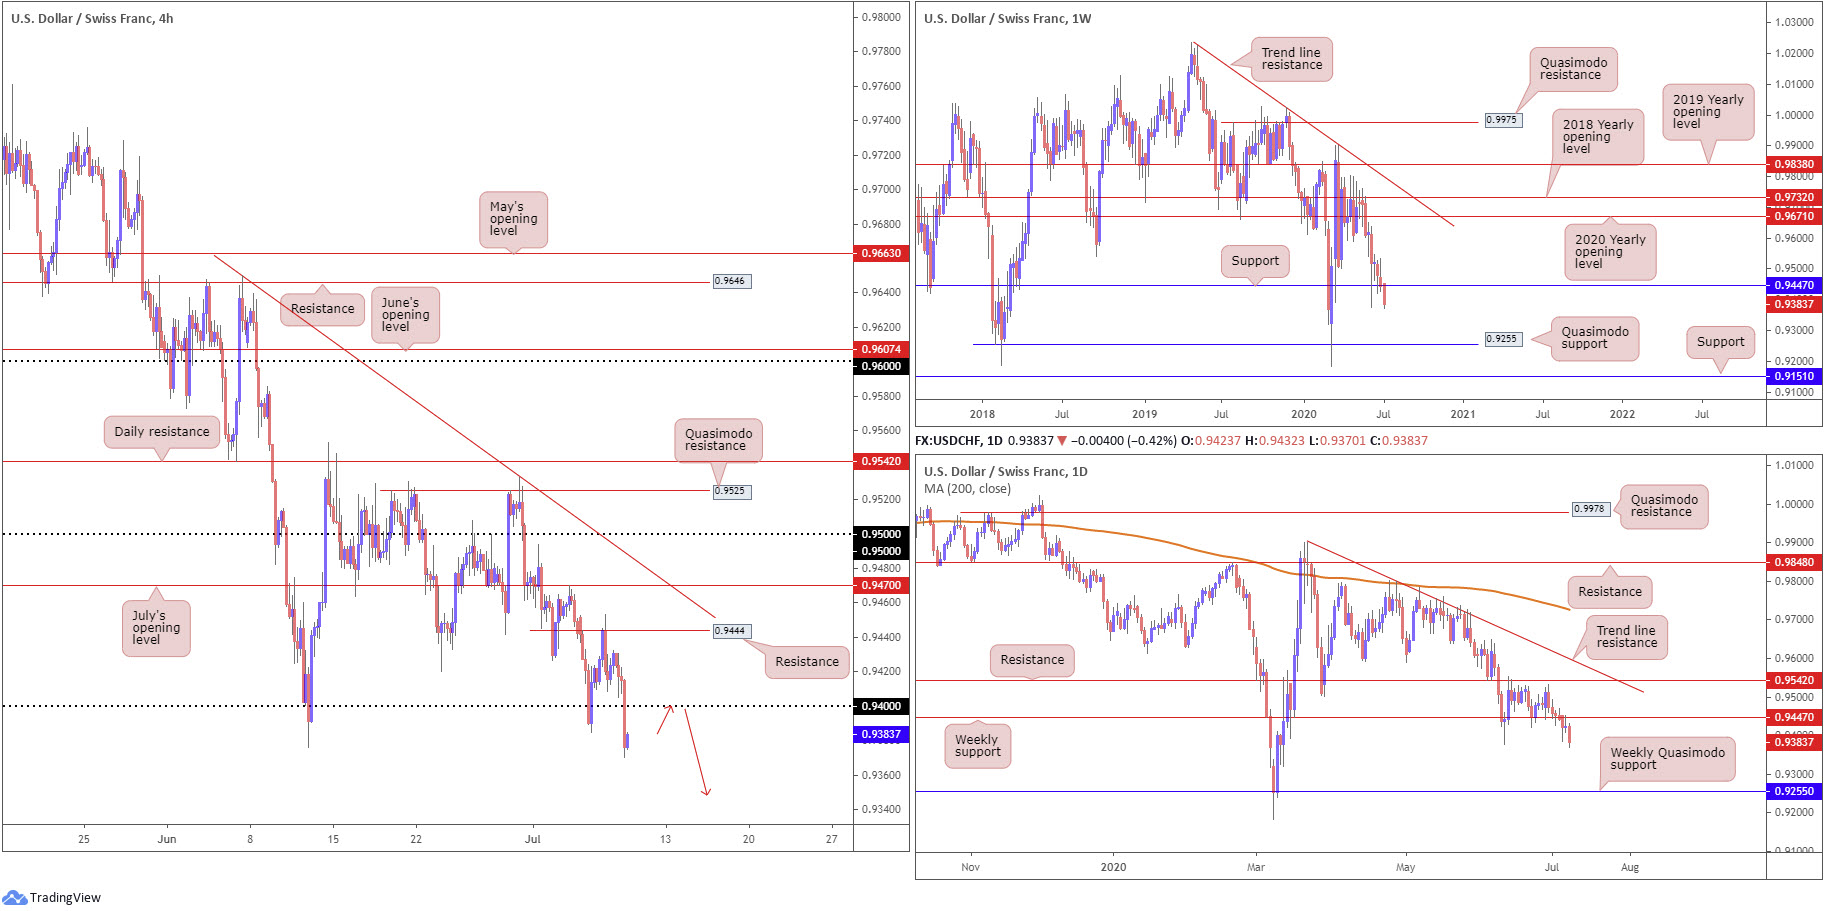
Buyers withdrew Wednesday as USD/CHF eased through the 0.94 handle on the H4 timeframe, weighed by DXY’s decline to territory south of 96.50.
Technically, the breach of 0.94 has shined the spotlight on lower levels – a H4 Quasimodo formation at 0.9324 is next on the hit list as visible support. In addition to this, both weekly and daily timeframes, after establishing firm position under weekly support at 0.9447, have eyes for weekly Quasimodo support coming in at 0.9255.
Areas of consideration:
H4 breakout sellers have already likely jumped on board sub 0.94, while conservative traders may be watching for the unit to retest 0.94 as resistance before committing (red arrows). A retest formed in the shape of a H4 bearish candlestick formation is likely to be regarded as a high-probability sell signal.
Irrespective of the entry method, the initial take-profit target rests at 0.9324, the H4 Quasimodo support underlined above.
Dow Jones Industrial Average:
Major US equity benchmarks finished higher Wednesday in spite of rising COVID-19 cases. The Dow Jones Industrial Average advanced 177.10 points, or 0.68%; the S&P 500 rallied 24.62 points, or 0.78%, and the tech-heavy Nasdaq 100 concluded higher by 142.69 points, or 1.36%.
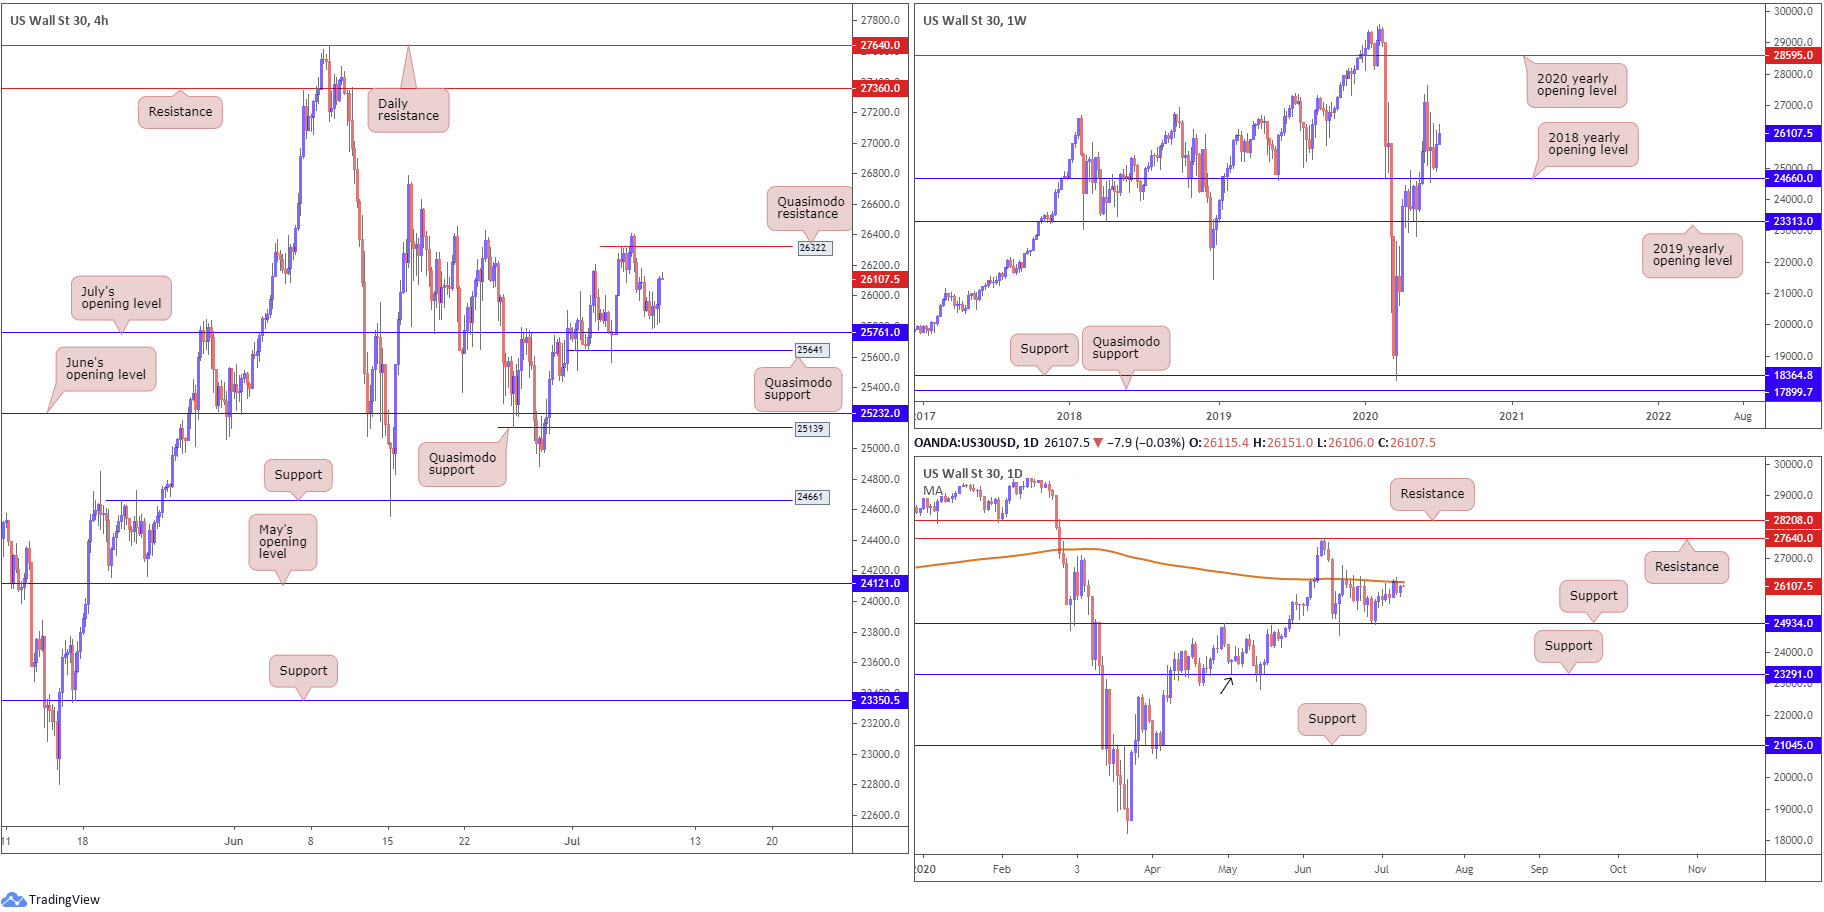
Price action, as evident from the H4 timeframe, pencilled in a tentative bottom just north of July’s opening level at 25761 in recent sessions (sited ahead of Quasimodo support at 25641), latching onto a reasonably modest bid into the close. This may have local Quasimodo resistance at 26322 move into view today, tailed closely by peaks around the 26428ish region.
The 2018 yearly opening level at 24660 remains an important base of support on the weekly timeframe, as price action continues to make progress north of the level. In the event buyers manage to keep their head above water here, we might pull in the 27638 high, followed by the 2020 yearly opening level at 28595.
Since June 15, price action on the daily timeframe has been ranging between the 200-day SMA (orange – 26247) and support from 24934. As evident from the chart, the aforementioned SMA continues to garner attention right now. A break of this barrier not only confirms upside strength on the weekly timeframe, it shines the spotlight on daily resistance from 27640.
Areas of consideration:
July’s opening level at 25761 on the H4 timeframe and Quasimodo support at 25641 remain points of interest, in the event we turn lower today. Buyers out of this region, however, are urged to consider waiting for additional confirmation to form before pulling the trigger as the 200-day SMA resistance is in play.
A daily close above the 200-day SMA, on the other hand, sends across a concrete bullish indication, with room to press as far north as daily resistance at 27640.
XAU/USD (GOLD):
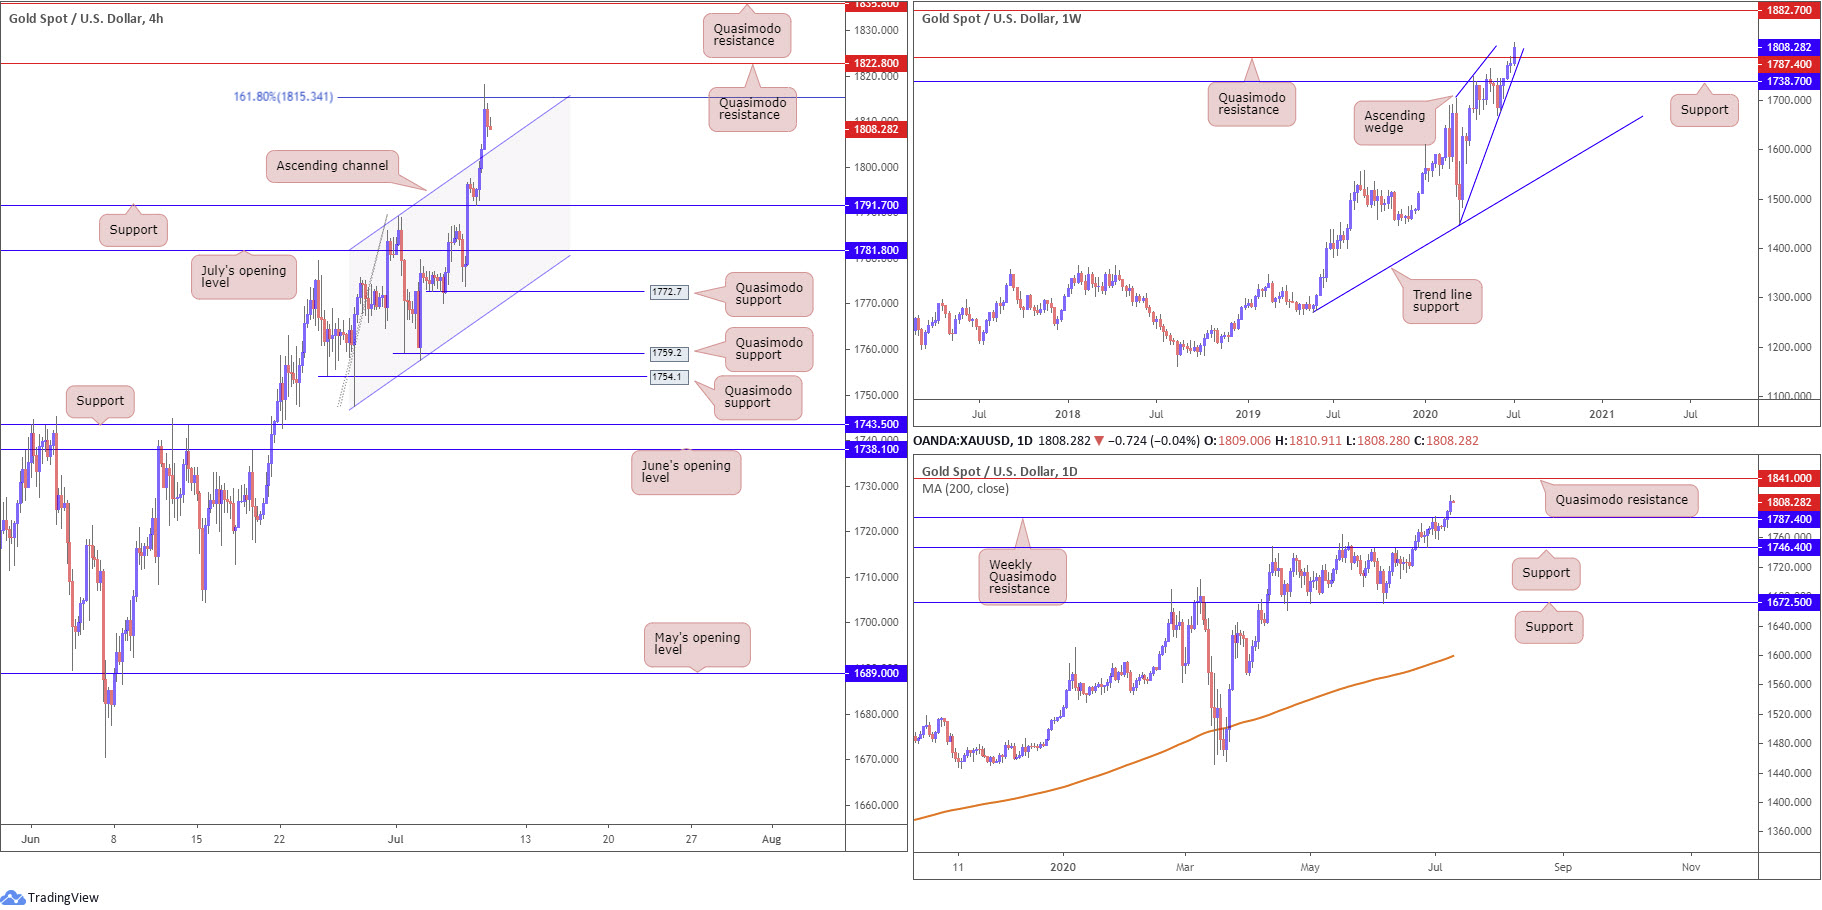
Gold prices rose to more than 1,800 an ounce Wednesday, reaching highs at 1818.0, levels not seen since September 2011. Widely favoured as a store of value in times of economic uncertainty, the technical picture on the higher timeframes suggest further upside could be on the cards.
From the weekly chart, we can see price action nudged above Quasimodo resistance at 1787.4. Breaking 1787.4, as the underlying trend suggested (trending higher since 2016), has laid the foundation for continuation buying to resistance stationed at 1882.7. Also of interest on the weekly timeframe is a potential ascending wedge pattern forming between 1451.4/1703.6.
Clearing weekly Quasimodo resistance at 1787.4 on the daily timeframe swings the pendulum in favour of a run to daily Quasimodo resistance at 1841.0.
Across the page on the H4 timeframe, traders may recall the following from Wednesday’s technical briefing (italics):
Today, meanwhile, traders may seek a retest at H4 support from 1791.7, targeting the 1800.0 region (127.2% Fibonacci extension point at 1800.7) as an initial take-profit zone.
As seen from the H4 chart this morning, price action did indeed retest support at 1791.7 before pushing to higher terrain. The move breached channel resistance, taken from the high 1789.2, and crossed swords with a 161.8% Fibonacci extension point at 1815.3. Absorbing offers at current price throws Quasimodo resistance at 1822.8 in the pot, followed by another layer of Quasimodo resistance at 1835.8.
Areas of consideration:
Noting both weekly and daily timeframes display room to extend gains above weekly Quasimodo resistance at 1787.4, H4 traders may explore bullish scenarios off H4 channel resistance-turned support (1789.2) today. Yet, conservative traders could pursue additional confirmation before taking action, in order to help avoid a fakeout.
Near-term targets from the aforementioned channel support are fixed at the 161.8% H4 Fibonacci extension point from 1815.3 and H4 Quasimodo resistance at 1822.8.
The accuracy, completeness and timeliness of the information contained on this site cannot be guaranteed. IC Markets does not warranty, guarantee or make any representations, or assume any liability regarding financial results based on the use of the information in the site.
News, views, opinions, recommendations and other information obtained from sources outside of www.icmarkets.com.au, used in this site are believed to be reliable, but we cannot guarantee their accuracy or completeness. All such information is subject to change at any time without notice. IC Markets assumes no responsibility for the content of any linked site.
The fact that such links may exist does not indicate approval or endorsement of any material contained on any linked site. IC Markets is not liable for any harm caused by the transmission, through accessing the services or information on this site, of a computer virus, or other computer code or programming device that might be used to access, delete, damage, disable, disrupt or otherwise impede in any manner, the operation of the site or of any user’s software, hardware, data or property.


