
Lower timeframe confirmation: simply means waiting for price action on the lower timeframes to confirm direction within a higher timeframe area. For example, some traders will not enter a trade until an opposing supply or demand area has been consumed, while on the other hand, another group of traders may only need a trendline break to confirm direction. As you can probably imagine, the list is endless. We, however, personally prefer to use the two methods of confirmation mentioned above in our trading.
EUR/USD:
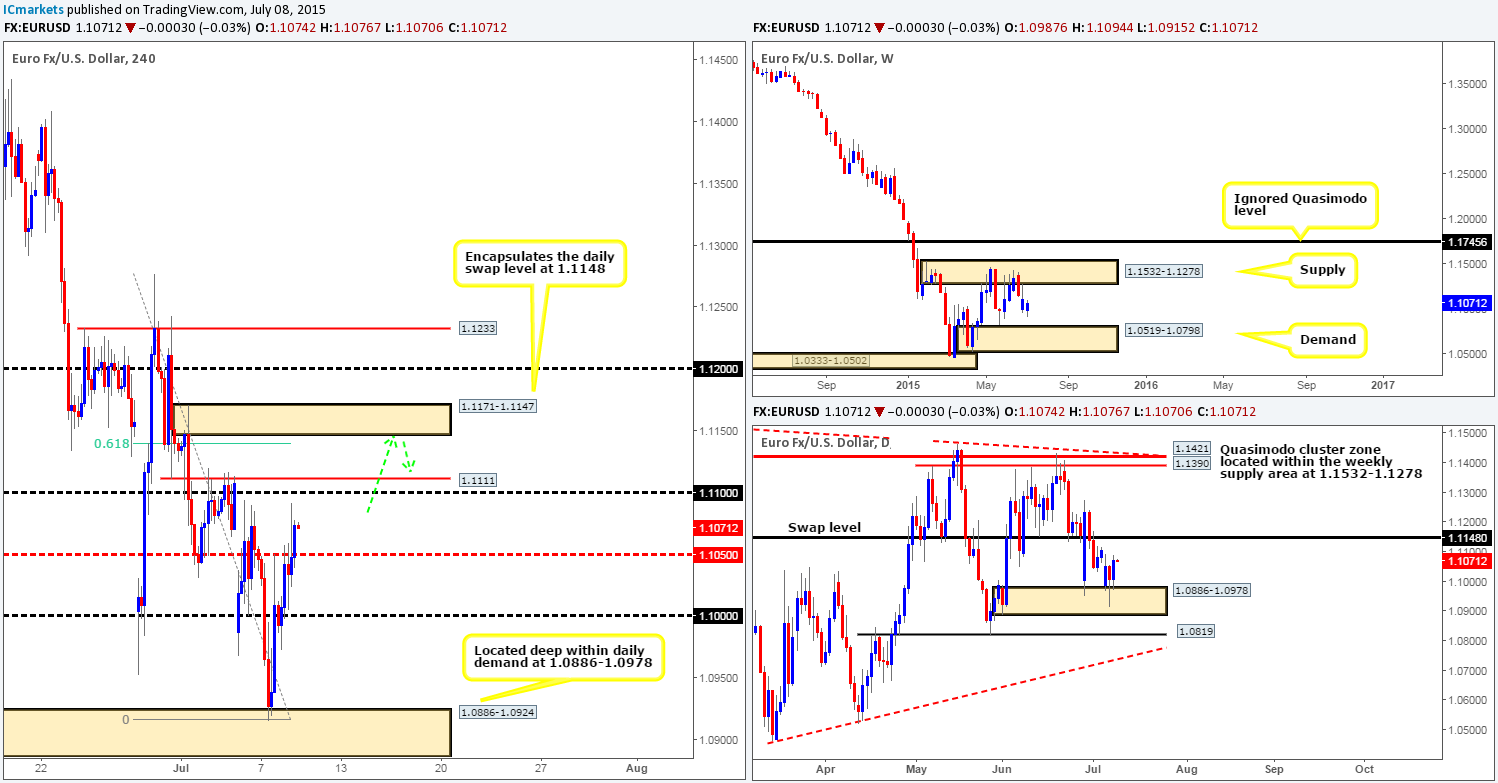
A conservative wave of buyers came into the market during Wednesday’s sessions from the 1.1000 region which pierced and eventually closed above the mid-level number 1.1050. This move, as you can see, has now very likely opened the gates for price to challenge the 1.1100/1.1111 area.
This small area of resistance does indeed look attractive, but with a fresh 4hr supply zone sitting just above it at 1.1171-1.1147, which not only encapsulates a daily swap level at 1.1148, but also converges with both a Fibonacci retracement value of 0.618% and the mid-level number resistance at 1.1150, this area is far more appealing to us today.
With that being said however, we will still need to see some sort of lower timeframe confirming signal at this 4hr supply zone before we consider risking capital to this idea. The reason for why simply comes from the ongoing Greek situation and the fact that we are seeing very little direction from the weekly timeframe at this point.
Levels to watch/live orders:
- Buys: Flat (Stop loss: N/A).
- Sells: 1.1171-1.1147 [Tentative – confirmation required] (Stop loss: 1.1176).
GBP/USD:
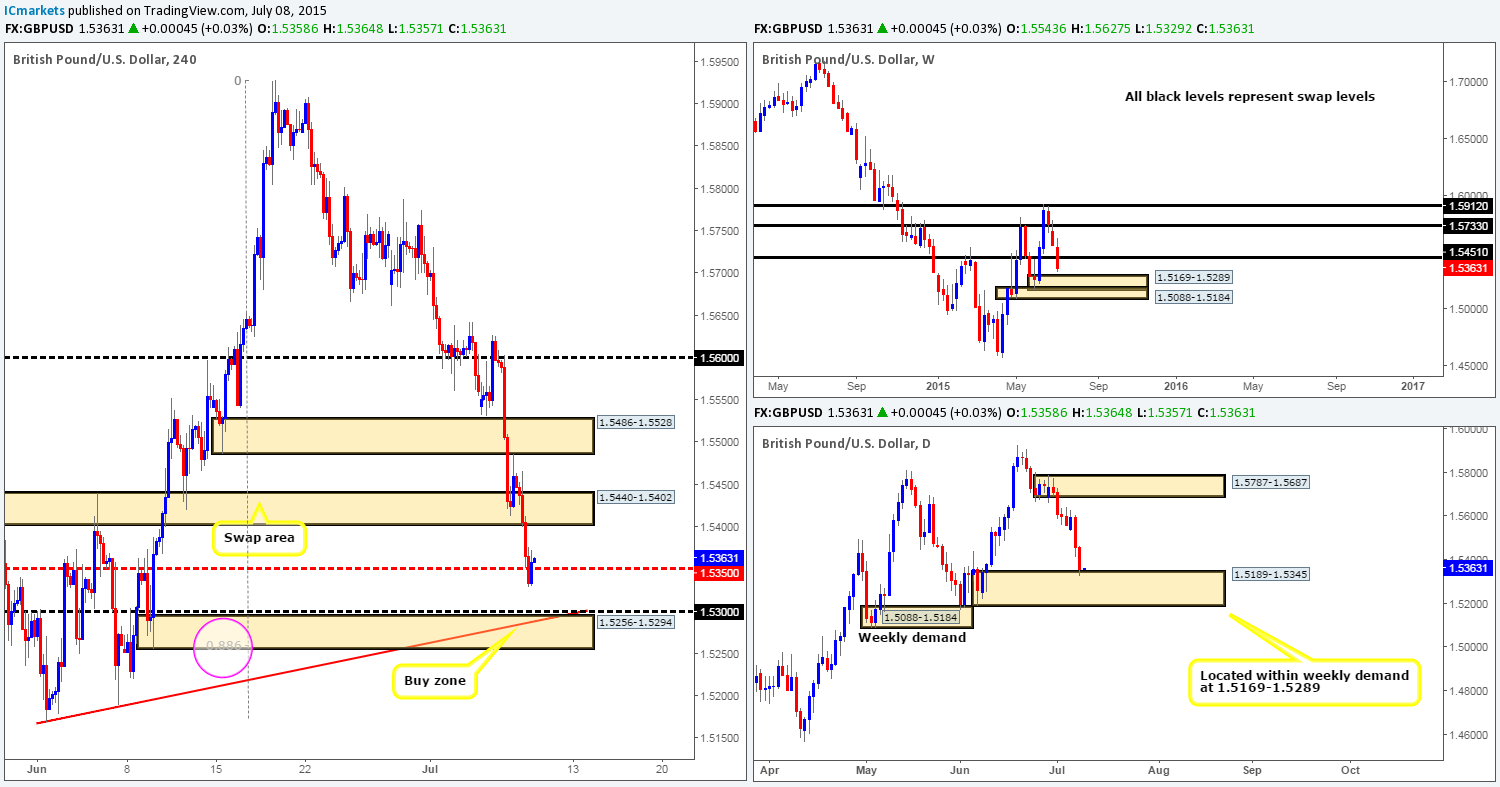
The GBP currency continued to decline in value during the course of yesterday’s trade, which saw price wipe out the 4hr swap area at 1.5440-1.5402 and connect up with the 1.5350 mid-level zone.
At current prices, our team has absolutely no interest in trading this pair. With that said however, should this market continue to fall and eventually cross swords with the 4hr demand area at 1.5256-1.5294, we intend on entering long here with 50% of our usual position size using a market order. The remaining 50% will be used if and only if we see lower timeframe confirming price action. The reasons for why we favor this 4hr demand area are as follows:
- It is located not only within weekly but also daily demand as well (1.5169-1.5289 – 1.5189-1.5345).
- Additional support from the round number 1.5300.
- Additional support from the deep Fibonacci retracement value 0.886.
- 4hr converging trendline taken from the low 1.5169.
Levels to watch/ live orders:
- Buys: 1.5256-1.5294 [50% of the position will be taken at market, the remaining 50% will need lower timeframe confirmation] (Stop loss: 1.5242).
- Sells: Flat (Stop loss: N/A).
AUD/USD:
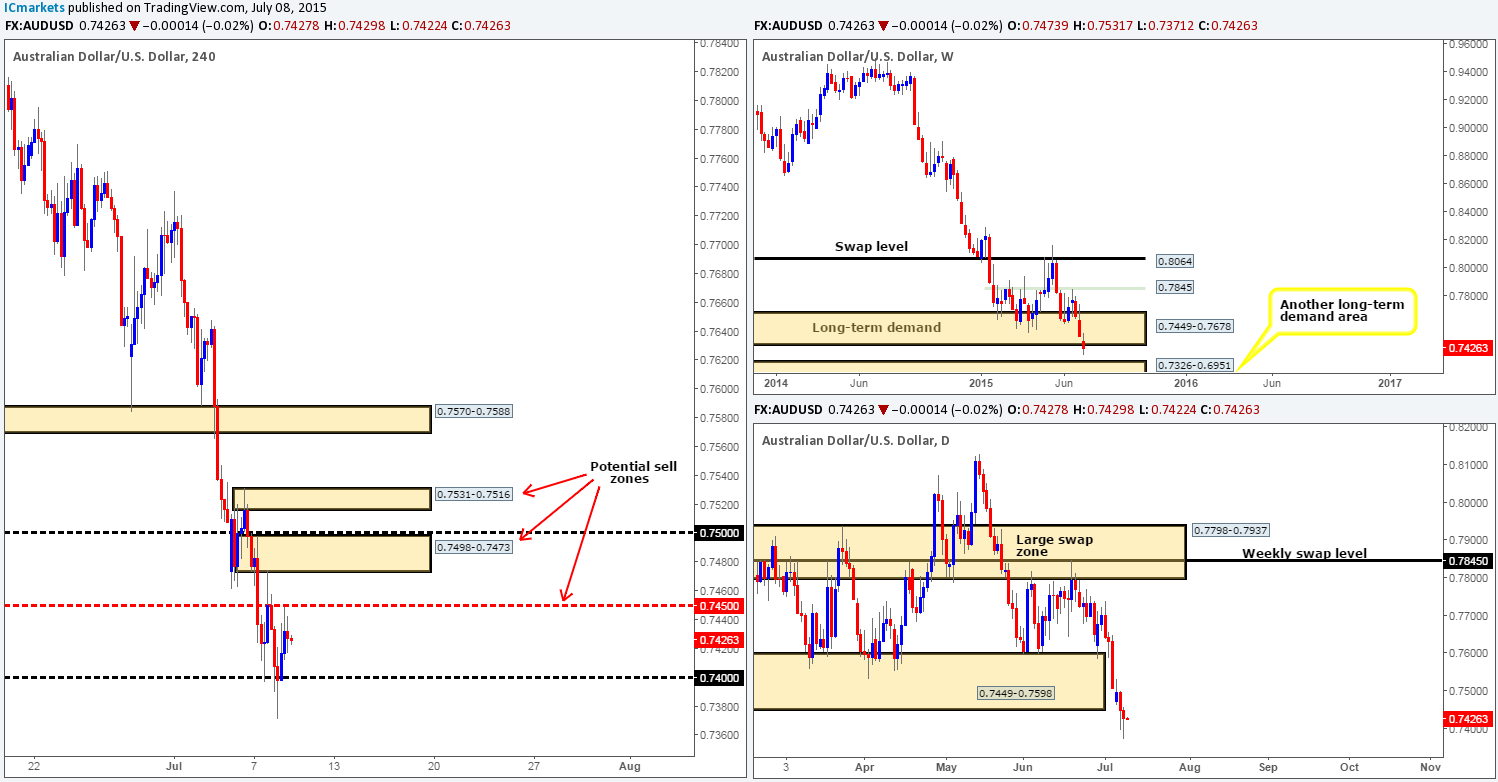
The Aussie pair spent yesterday’s sessions confined to the mid-level number 0.7450 and the round number 0.7400. Due to this, most of the following analysis will be similar to the previous.
The bigger picture shows that the long-term weekly demand area at 0.7449-0.7678, and its partner demand on the daily timeframe at 0.7449-0.7598 was recently violated. As far as we can see, the nearest higher timeframe support structure now is the long-term weekly demand area seen at 0.7326-0.6951. On that note, our attention will be primarily drawn toward shorts today/the rest of this week. Areas we currently have our eye on are as follows:
- 4hr supply at 0.7531-0.7516. This area could be used as a fakeout barrier for the supply area mentioned at number two.
- 4hr supply at 0.7498-0.7473.
- The current mid-level hurdle 0.7450.
Since there are three possible reactive zones, we are going to refrain from placing pending orders. Instead, we’re going to watch for confirming lower timeframe price action as this should help curb any losses that might otherwise be seen when using pending orders.
Levels to watch/ live orders:
- Buys: Flat (Stop loss: N/A).
- Sells: 0.7450 [Tentative – confirmation required] (Stop loss: dependent on where one confirms this level) 0.7498-0.7473 [Tentative – confirmation required] (Stop loss: 0.7502) 0.7531-0.7516 [Tentative – confirmation required] (Stop loss: 0.7535).
USD/JPY:
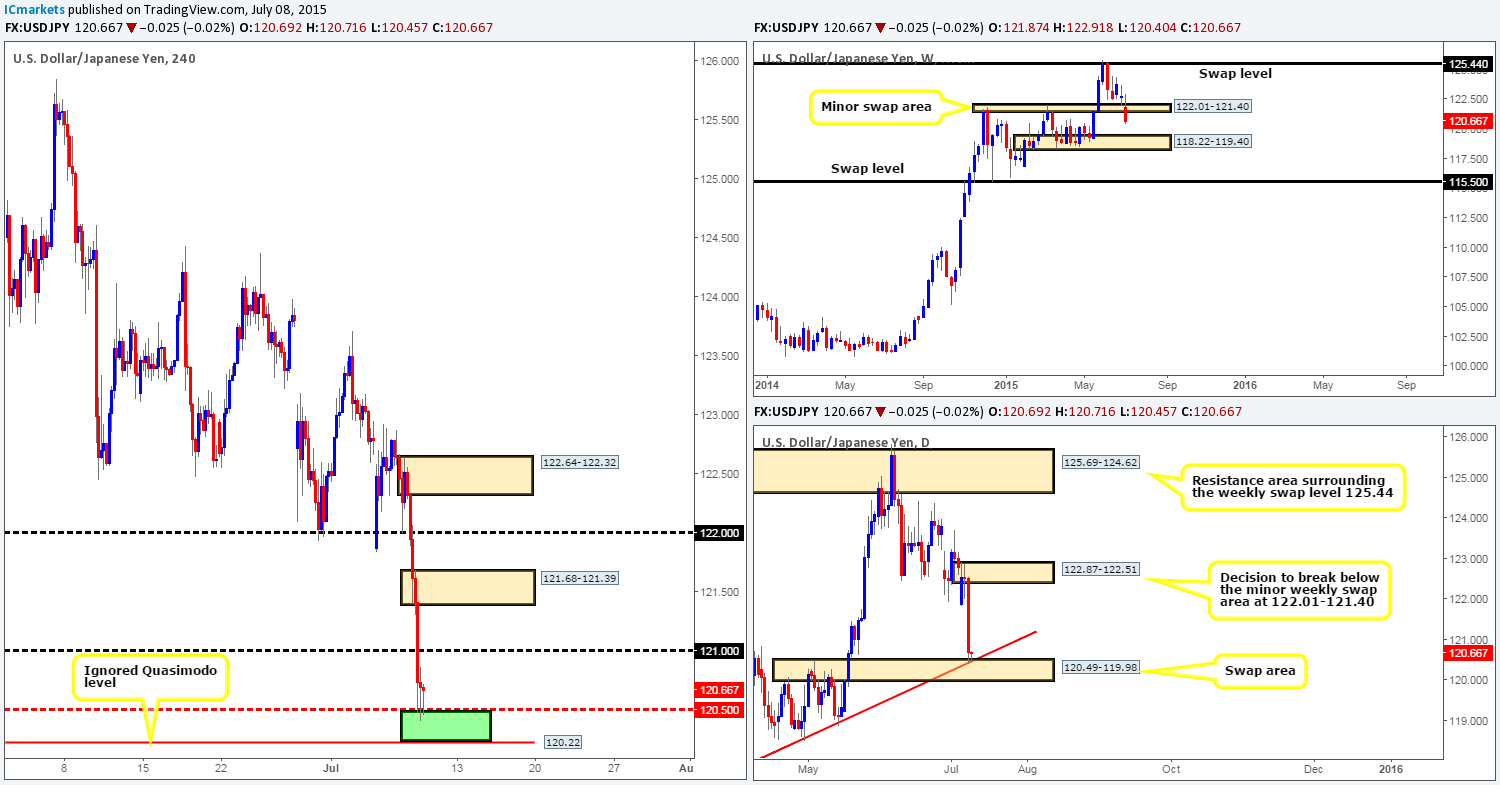
An unrelenting squeeze to the downside was seen on the USD/JPY pair yesterday, which saw price consume not only our live buy order taken at 122.090, but also several other 4hr technical levels along the way. It was only once price bumped heads with the mid-level hurdle 120.50 did we see any sort of stabilization take place.
This push lower also took out a minor weekly swap area at 122.01-121.40, and consequently forced price to connect with a daily swap area at 120.49-119.98, which as you can see also boasts daily trendline convergence from the low 115.84.
Therefore, with all of the above taken into consideration, we have decided to focus our attention on looking for (lower timeframe) confirmed longs between 120.50 and 122.22 – an ignored 4hr Quasimodo level (green zone). In the event that we do manage to spot a long entry here, there are three take-profit targets in mind:
- The round number121.00.
- The 4hr supply area seen at 121.68-121.39.
- The round number 122.00.
The reason for requiring confirmation around the aforementioned green zone simply comes from not seeing enough weekly timeframe support in the mix.
Levels to watch/ live orders:
- Buys: 120.22/120.55 [Tentative – confirmation required] (Stop loss: depends on where one confirms this area).
- Sells: Flat (Stop loss: N/A).
USD/CAD:
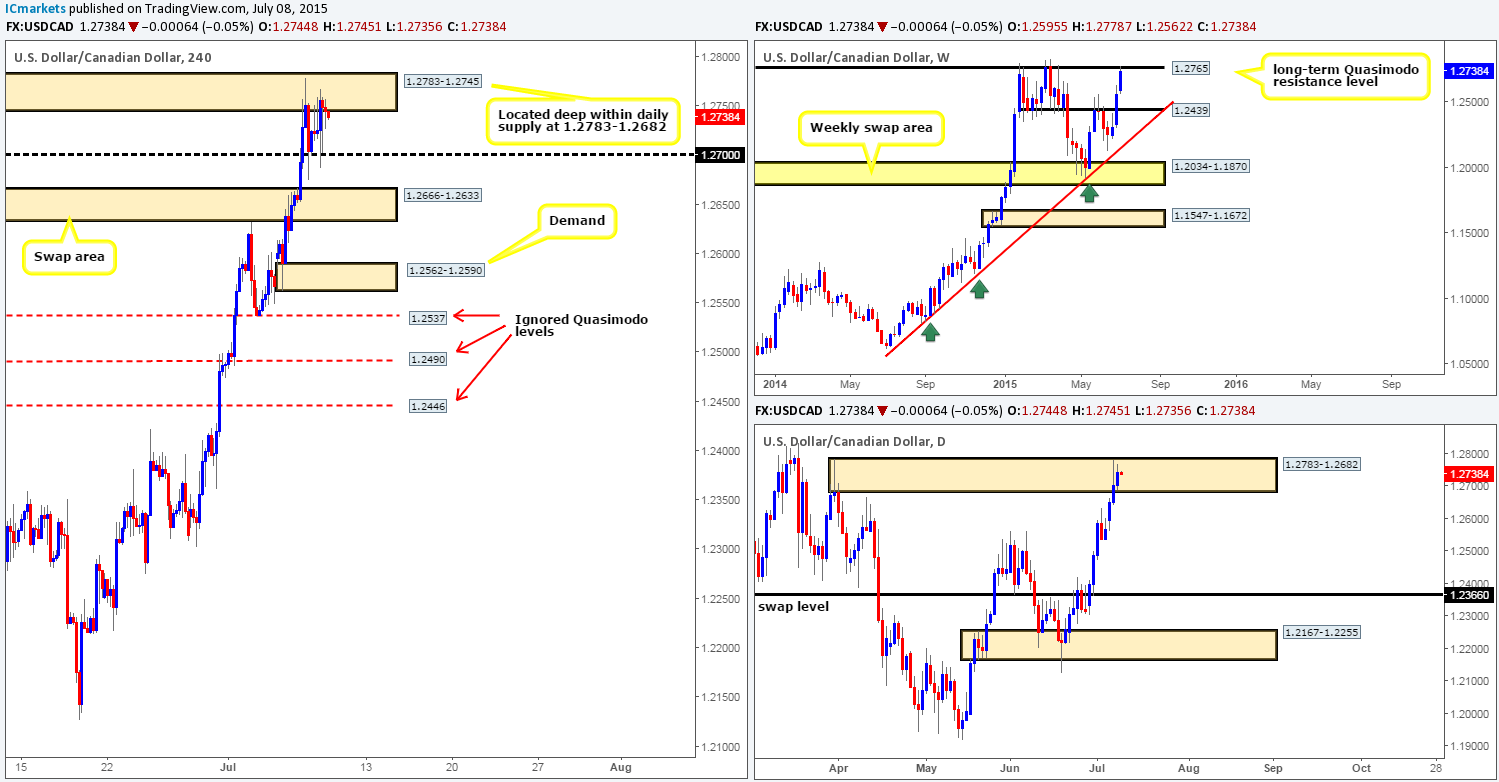
Throughout the course of yesterday’s sessions, we saw the buyers and sellers battling for position in between a 4hr supply area at 1.2783-1.2745 and the round number 1.2700. Overall, we do believe 1.2700 will eventually be consumed. Our rationale behind this idea comes from seeing price not only currently touching gloves with a long-term weekly Quasimodo resistance level at 1.2765, but also positioned deep within a daily supply zone at 1.2783-1.2682.
So, where do we go from here? Well, initially we were not going to risk shorting this pair, but seeing as price is presently trading around the underside of the aforementioned 4hr supply area, we may look to take a sell position as long as corresponding lower timeframe confirmation is also seen. Saying that we do manage to find a short entry here, the ride south will likely be a bumpy one due to the amount of 4hr supportive structures in our way. The first area of trouble will likely be 1.2700. If we manage to break the floor of bids here, we’ll then be looking down to the 4hr swap area at 1.2666-1.2633. Essentially, we plan to just follow/trail price action as it forms, taking profits as we go along. It will be interesting to see how this pans out.
Levels to watch/ live orders:
- Buys: Flat (Stop loss: N/A).
- Sells: 1.2783-1.2745 [Tentative – confirmation required (Stop loss: 1.2790).
USD/CHF:
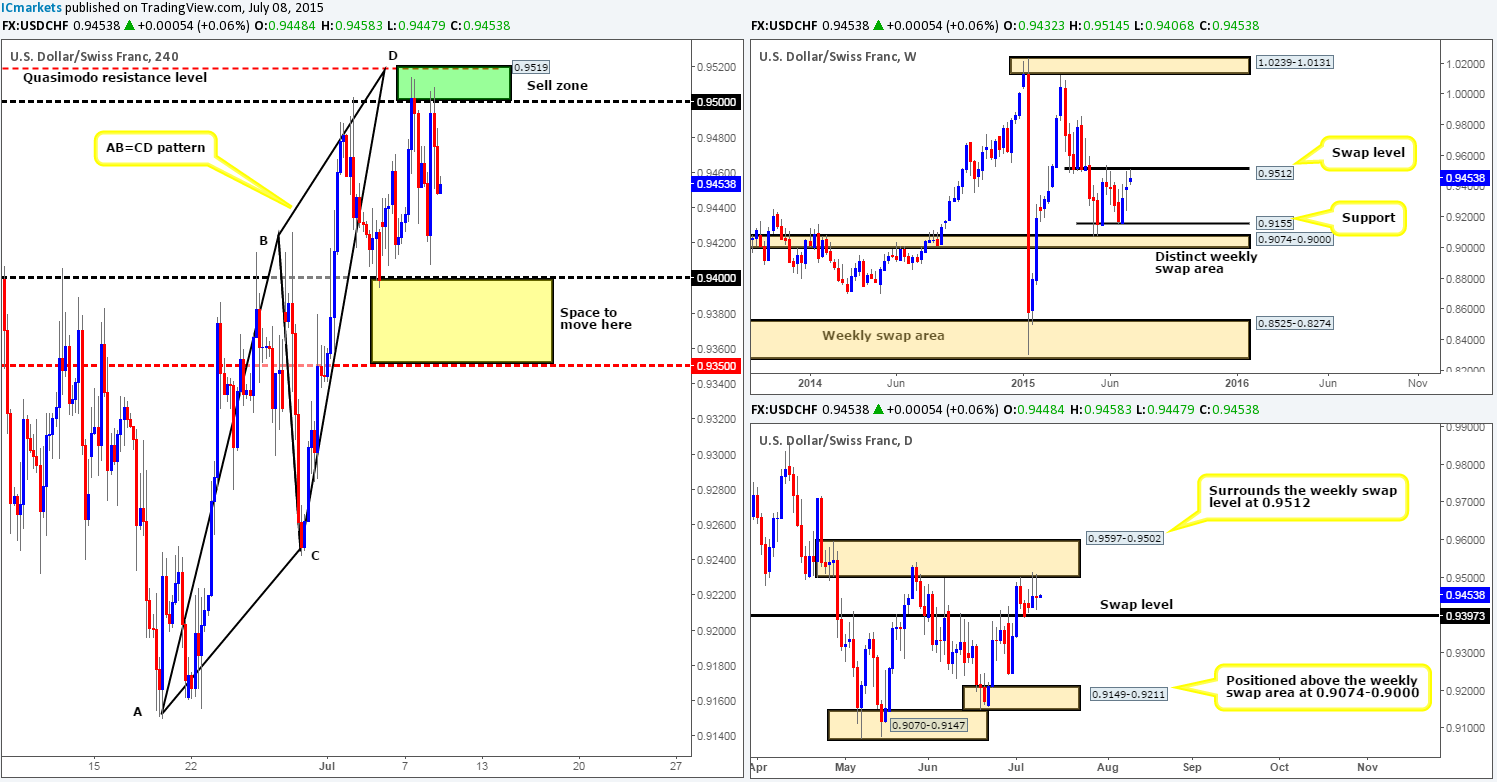
Yesterday’s action shows that this market gave traders a second chance to enter short at the green 4hr sell zone between 0.9500/0.9519 (positioned around a weekly swap level at 0.9512 and also located just within a daily supply zone coming in at 0.9597-0.9502). We’re currently kicking ourselves since there was also corresponding confirmation from the lower timeframes here and we missed it!
For those who did manage to get in short, great job! If we were short from there, we’d still be looking down to the 0.9400 handle as our first take-profit area, which if you look across to the daily chart, you’ll see it is essentially a daily swap level (0.9397).
Other than what we mentioned above, we do not see any immediate opportunity to trade this pair until price breaks below 0.9400, in which case the path south would likely be clear down to the mid-level barrier 0.9350.
Levels to watch/ live orders:
- Buys: Flat (Stop loss: N/A).
- Sells: Flat (Stop loss: N/A).
DOW 30:
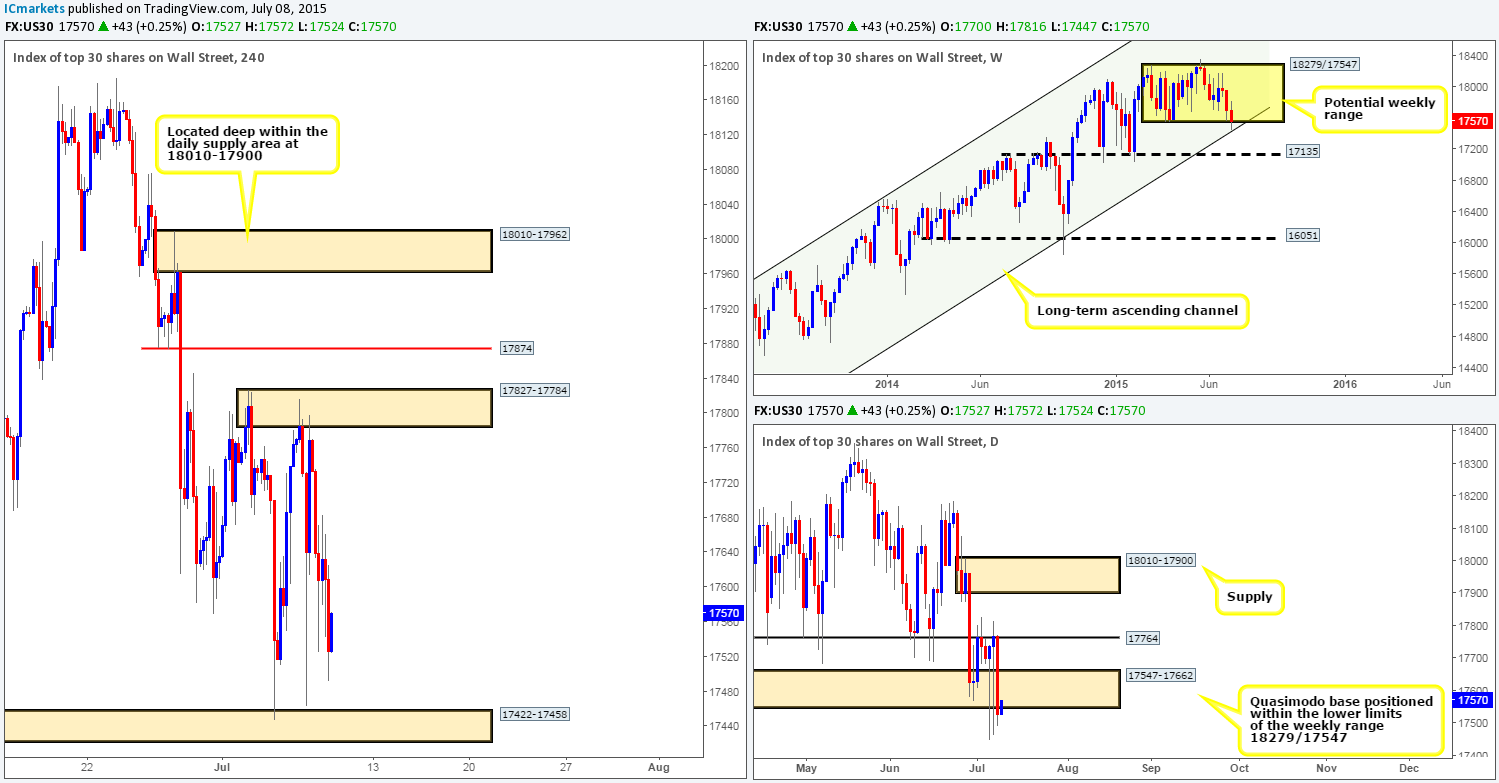
From the 4hr timeframe, we can see that price remains trading between a 4hr supply area at 17827-17784 and the 4hr demand area coming in at 17422-17458. Meanwhile, in the bigger picture, the weekly timeframe shows price still being supported by both the lower limits of a potential weekly range at 18279/17547and its converging long-term weekly ascending channel taken from the low 10402 and high 13270. The daily timeframe on the other hand, reveals a slightly different picture. Yesterday’s action forced price to close below the daily Quasimodo base at 17547-17662, which could suggest further downside towards a daily demand area at 17033-17355 (formed from reaction off of the weekly swap level 17135).
Given the points made above, our team sees little opportunity trade this index at the moment unless one is comfortable trading at the current 4hr supply and demand areas noted above. We for one are most certainly not. As such, here is what we have noted so far:
- In the event that price engulfs the 4hr demand area at 17422-17458, the pathway south should be ‘support free’ down to a fresh 4hr demand area seen at 17285-17331, which is actually located just within the daily demand area mentioned above at 17033-17355. A potential short trade on the break of 17422-17458 is a valid setup in our opinion as long as price retests this zone as supply and shows some sort of lower timeframe sell signal before continuing south.
- If on the other hand price breaks above the 4hr supply area at 17827-17784, we’d then begin watching for price to retest this violated zone. With that seen, we would need the lower timeframes to confirm strength here and try to enter with a tight stop, otherwise risk/reward would not be favorable here due to near-term 4hr resistance looming just above at 17878. Once/if price manages to consume 17878; it should then be relatively easy for price to connect with the 4hr supply area at 18010-17962 (positioned deep within the daily supply area at 18010-17900).
Levels to watch/ live orders:
- Buys: Flat (Stop loss: N/A).
- Sells: Flat (Stop loss: N/A).
XAU/USD: (Gold)
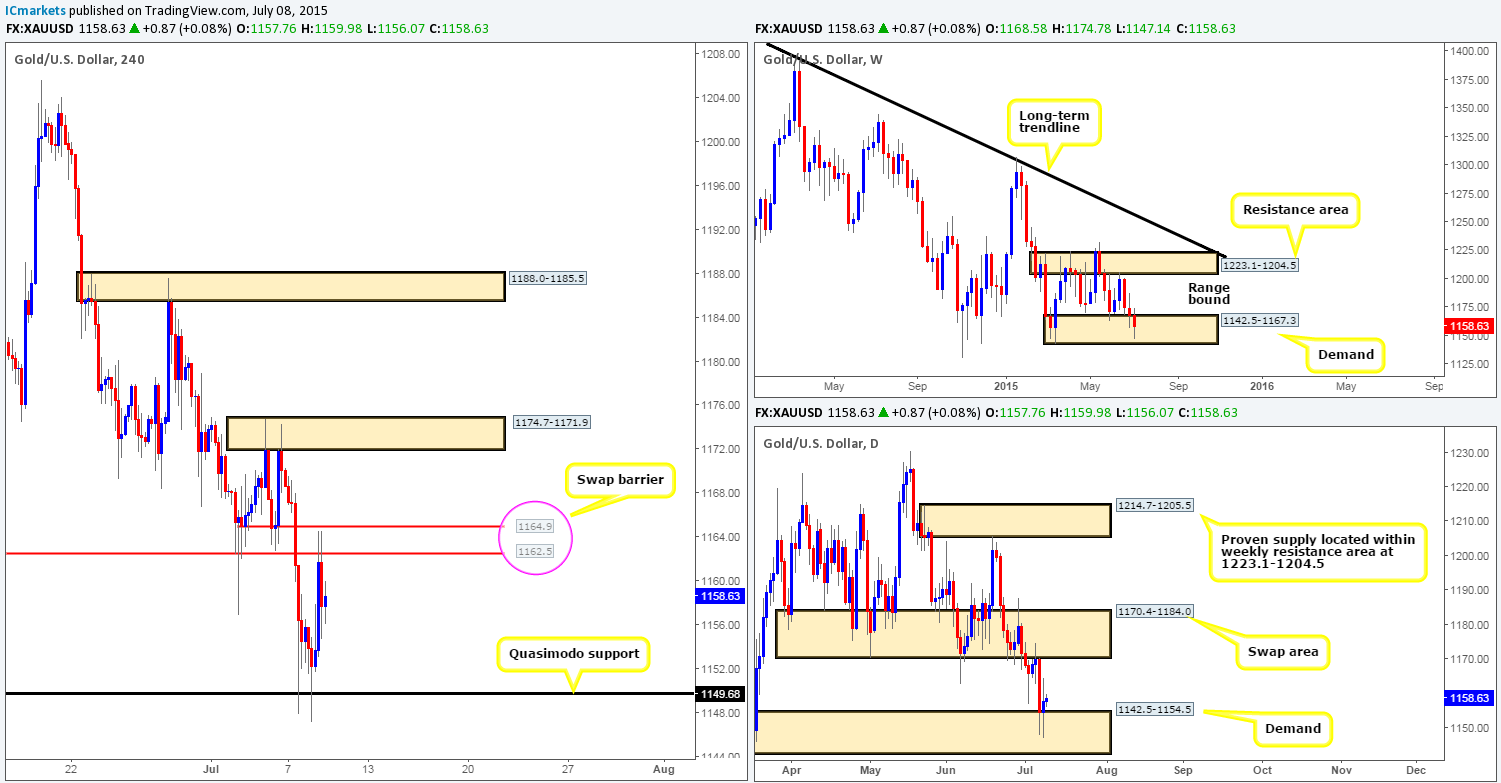
The Gold market rallied just beautifully from the 4hr Quasimodo support level at 1149.6 yesterday, resulting in price shaking hands with a 4hr swap barrier at 1164.9/1162.5.
With both the weekly and daily charts showing price trading side-by-side within demand (1142.5-1167.3 – 1142.5-1167.3) at the moment, we still feel that this market has potential to move higher yet. So, with direction coming from the higher timeframes, we have two possible buy zones to keep an eye on today/this week:
- The aforementioned 4hr Quasimodo support level. We know that price has already reacted off of this barrier already, but considering the market’s overall position on the higher timeframes (see above), it may get hit again. However, seeing as how this would be the second touch of this level, we would highly recommend NOT setting a pending buy order here, but rather waiting for the lower timeframes to prove strength exists before pulling the trigger.
- The second zone involves price breaking above the aforementioned 4hr swap barrier, as this will likely open the gates to further upside towards 1174.7-1171.9 – a 4hr resistance area. In order for us to be able to trade this move though, a retest of the violated area would need to be seen along with favorable lower timeframe confirming price action.
Levels to watch/ live orders:
- Buys: 1149.6 [Tentative – confirmation required] (Stop loss: dependent on where one confirms this level).
- Sells: Flat (Stop loss: N/A).


