
Key risk events today:
UK GDP m/m; OPEC Meetings; ECB Monetary Policy Meeting Accounts; Canada Employment Change and Unemployment Rate; US Unemployment Claims; US Core PPI m/m and PPI m/m; Fed Chair Powell Speaks; US Prelim UoM Consumer Sentiment.
(Previous analysis as well as outside sources – italics).
EUR/USD:
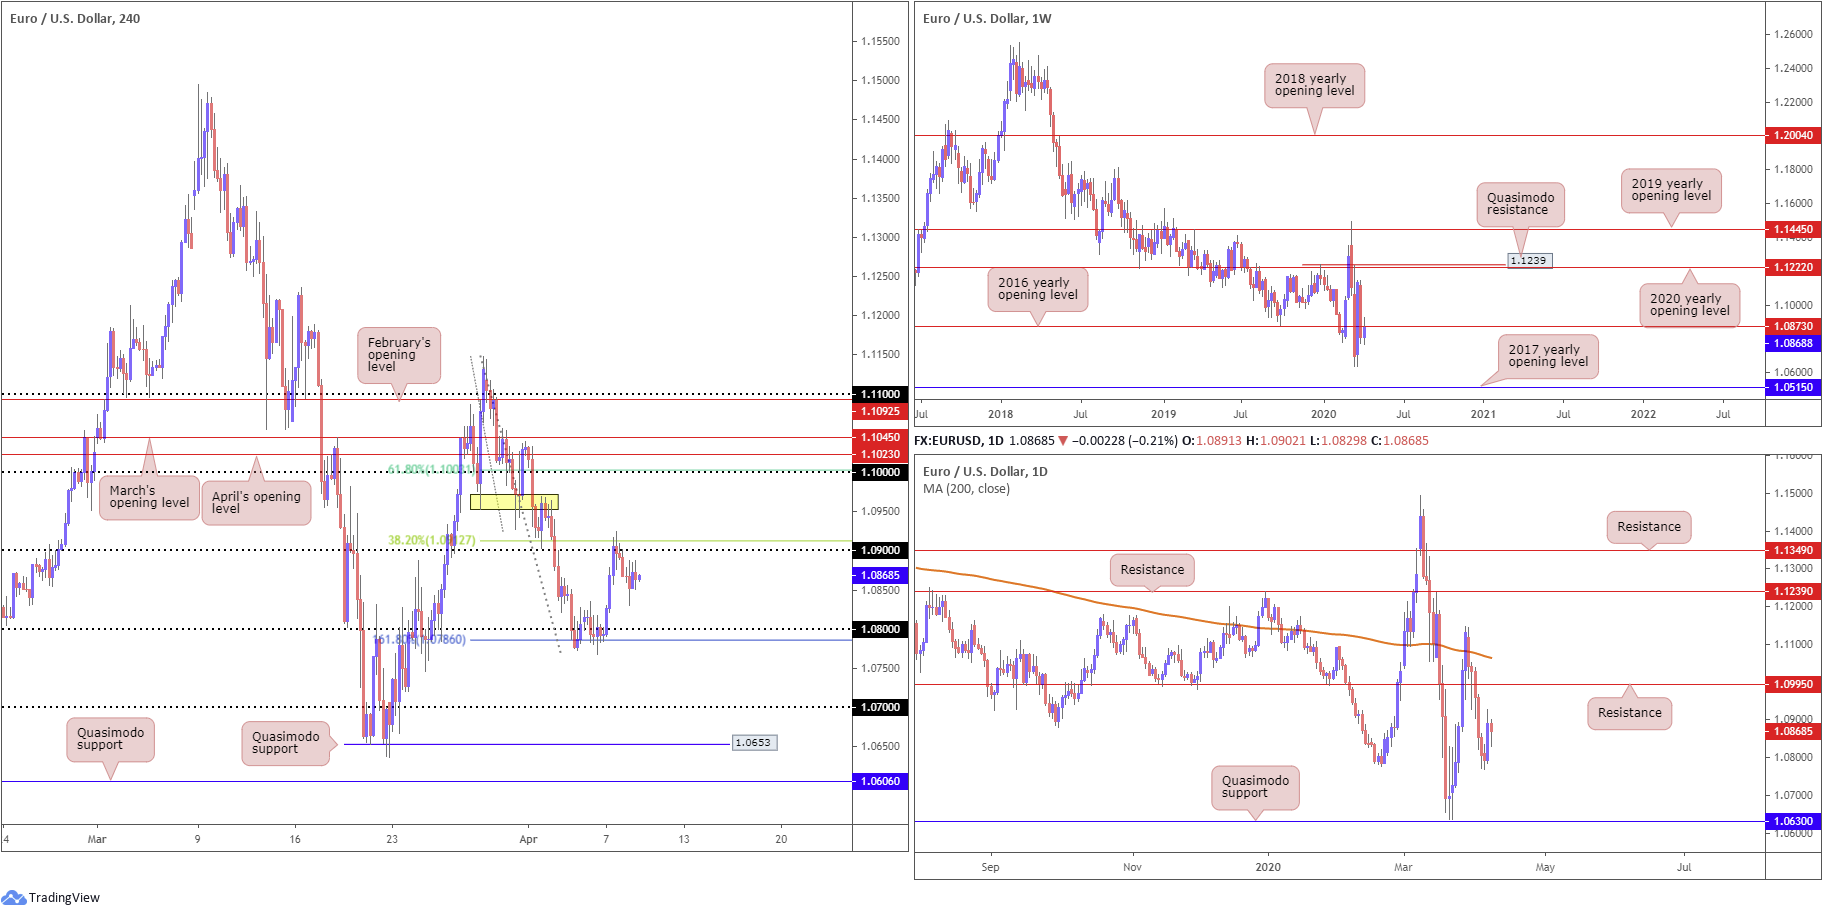
After failing to preserve an upside presence north of 1.09 on the H4 timeframe, capped by a 38.2% Fibonacci retracement ratio at 1.0912, Wednesday had EUR/USD dip to lows at 1.0830. The US dollar index, meanwhile, reclaimed 100.00+ status, though bulls remain lethargic.
North of 1.09, local resistance is present around 1.0950 (yellow), with a break highlighting 1.10, a 61.8% Fibonacci retracement ratio at 1.1003 and April and March’s opening level at 1.1023 and 1.1045, respectively. To the downside, current price has eyes on the 1.08 boundary, reinforced by a 161.8% Fibonacci extension point at 1.0786.
Higher-timeframe analysis reveals buyers and sellers battling for position around the underside of the 2016 yearly opening level at 1.0873 on the weekly timeframe. Skies above here are reasonably clear for a run to the 2020 yearly opening level at 1.1222, shadowed by a Quasimodo resistance at 1.1239. Still, a rejection could see multi-year lows at 1.0635 re-emerge.
From the daily timeframe, resistance at 1.0995, followed by the 200-day SMA (orange – 1.1064), is in view, while support can be seen by way of a Quasimodo formation at 1.0630.
Areas of consideration:
Having noted a presence of weekly resistance at 1.0873, downside to 1.08 on the H4 is certainly a possibility. Sellers, however, would likely want to see a retest at 1.09 play out before pulling the trigger, due to the lack of H4 resistance available to base a sell from.
Moves north of 1.09, despite weekly resistance, may entice breakout buying to the 1.0950ish threshold on the H4, with the possibility of reaching daily resistance at 1.0995 and the key figure 1.10.
GBP/USD:
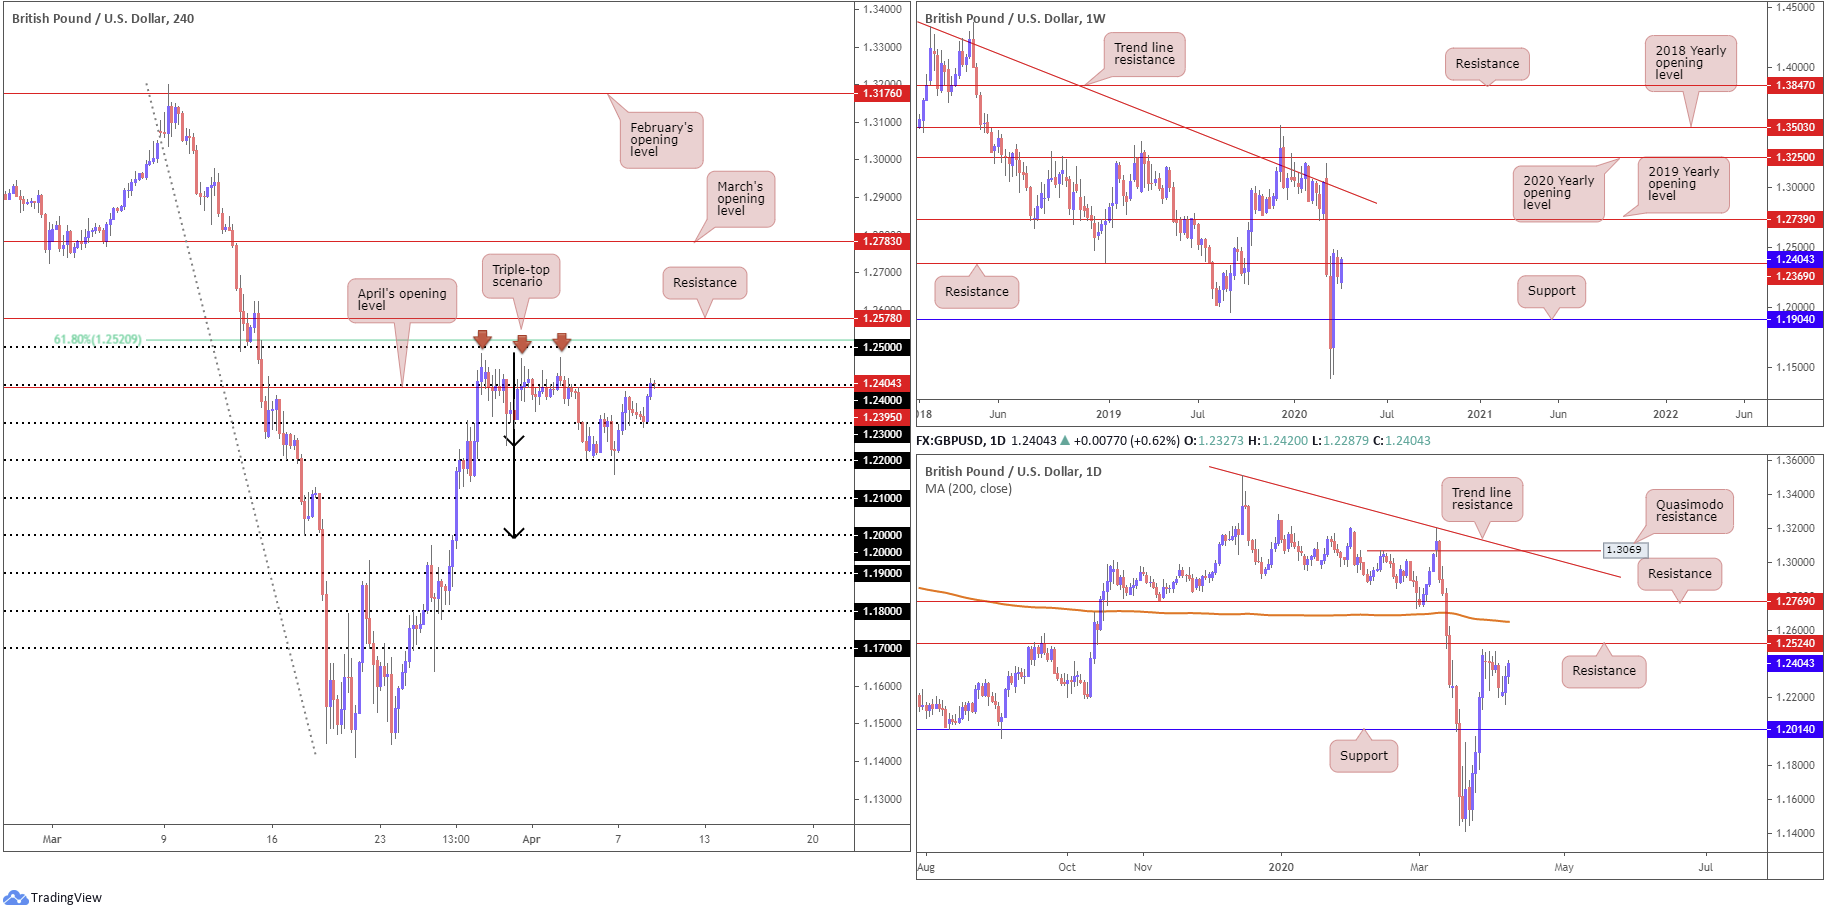
Sterling found an additional set of legs Wednesday, following a near-to-the-point retest off 1.23, reaching 1.24 and April’s opening level at 1.2395 into the closing hours. The move higher came on the back of news UK PM Johnson is in a stable condition and responding well to treatment, as well as a retreat from 100.43 on the US dollar index.
Previous analysis shined the spotlight on the formation of a H4 triple-top pattern around 1.2476ish, sited just beneath the 1.25 handle and a 61.8% Fibonacci retracement at 1.2520. The break of the lowest trough within the aforementioned triple-top pattern (1.2241) confirmed the formation as a potential contender for shorts, with a take-profit target (measured by taking the value between the highest peak to the lowest trough and adding this to the breakout point) set around the key figure 1.20 (black arrows). Technically speaking, this remains the case until the top edge of the said H4 pattern (1.2476) is engulfed.
From the weekly timeframe, longer-term flow has reconnected with resistance at 1.2369, with the possibility of a reversal forming towards support priced in at 1.1904. The next upside target beyond 1.2369 falls in around the 2019 yearly opening level at 1.2739, with a break exposing long-term trend line resistance, taken from the high 1.5930.
The story on the daily timeframe has price action hovering beneath resistance at 1.2524. The 200-day SMA (orange – 1.2649) lurks north of noted resistance, while support, aside from Tuesday’s low at 1.2163, resides around the 1.2014 neighbourhood.
Areas of consideration:
Having noted weekly movement testing resistance from 1.2369 as well as daily price displaying room to dip lower, the triple-top H4 pattern could still complete, in spite of the recent advance. Note also the said pattern’s take-profit target merges with daily support at 1.2014.
Technically, therefore, traders are still likely to consider shorts off 1.24 today. In light of recent upside, though, they may seek additional candlestick confirmation before committing.
AUD/USD:
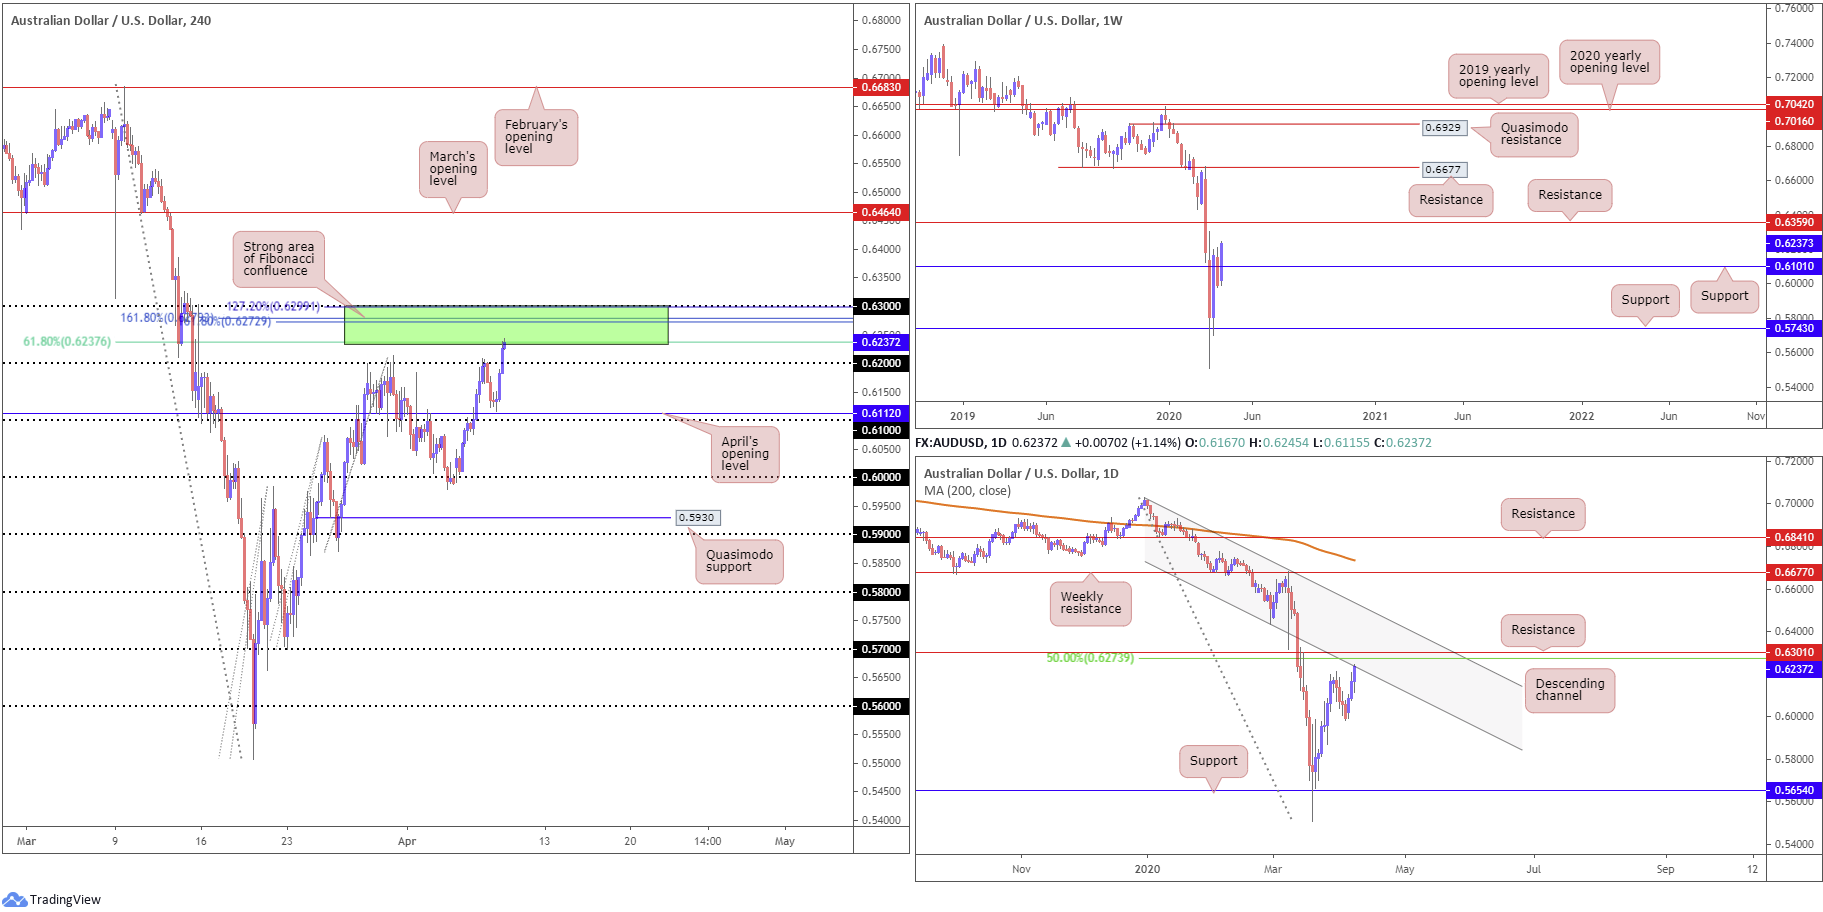
Eclipsing prior session highs around 0.6208, AUD/USD bulls outperformed for a third successive day, drawing Wednesday to highs of 0.6245.
As traders looked past the S&P revising its outlook to negative from stable for the still triple AAA rated sovereign, the H4 candles, reinforced by a dip in the US dollar index, overthrew 0.62 and entered the walls of an interesting area of Fibonacci studies – typically referred to as a Fibonacci cluster. 0.63/0.6237 is comprised of the 0.63 handle, two 161.8% Fibonacci extension points at 0.6272 and 0.6279, a 61.8% Fibonacci resistance point at 0.6237 and a 127.2% Fibonacci extension point at 0.6299.
Further afield, weekly movement recently crossed above resistance at 0.6101 (now labelled support) and is making its way towards resistance coming in at 0.6359. A closer examination of price action on the daily timeframe has the unit testing a channel support-turned resistance, extended from the low 0.6433. Traders will also note that directly above this point we have resistance plotted at 0.6301, which converges closely with a 50.0% retracement ratio at 0.6273.
Areas of consideration:
As in Wednesday’s technical briefing, all (technical) eyes are likely on 0.63/0.6237 today. Not only is it a H4 Fibonacci powerhouse, it connects with the noted daily resistance structures on the daily timeframe at 0.6273. In addition to this, buy stops positioned above 0.62, once filled, become buy orders, therefore providing liquidity to sell into.
Entry techniques, of course, will vary. Most, nonetheless, will favour an entry on a close back beneath 0.62 as this helps confirm seller intent; others may favour entry by way of candlestick confirmation.
USD/JPY:
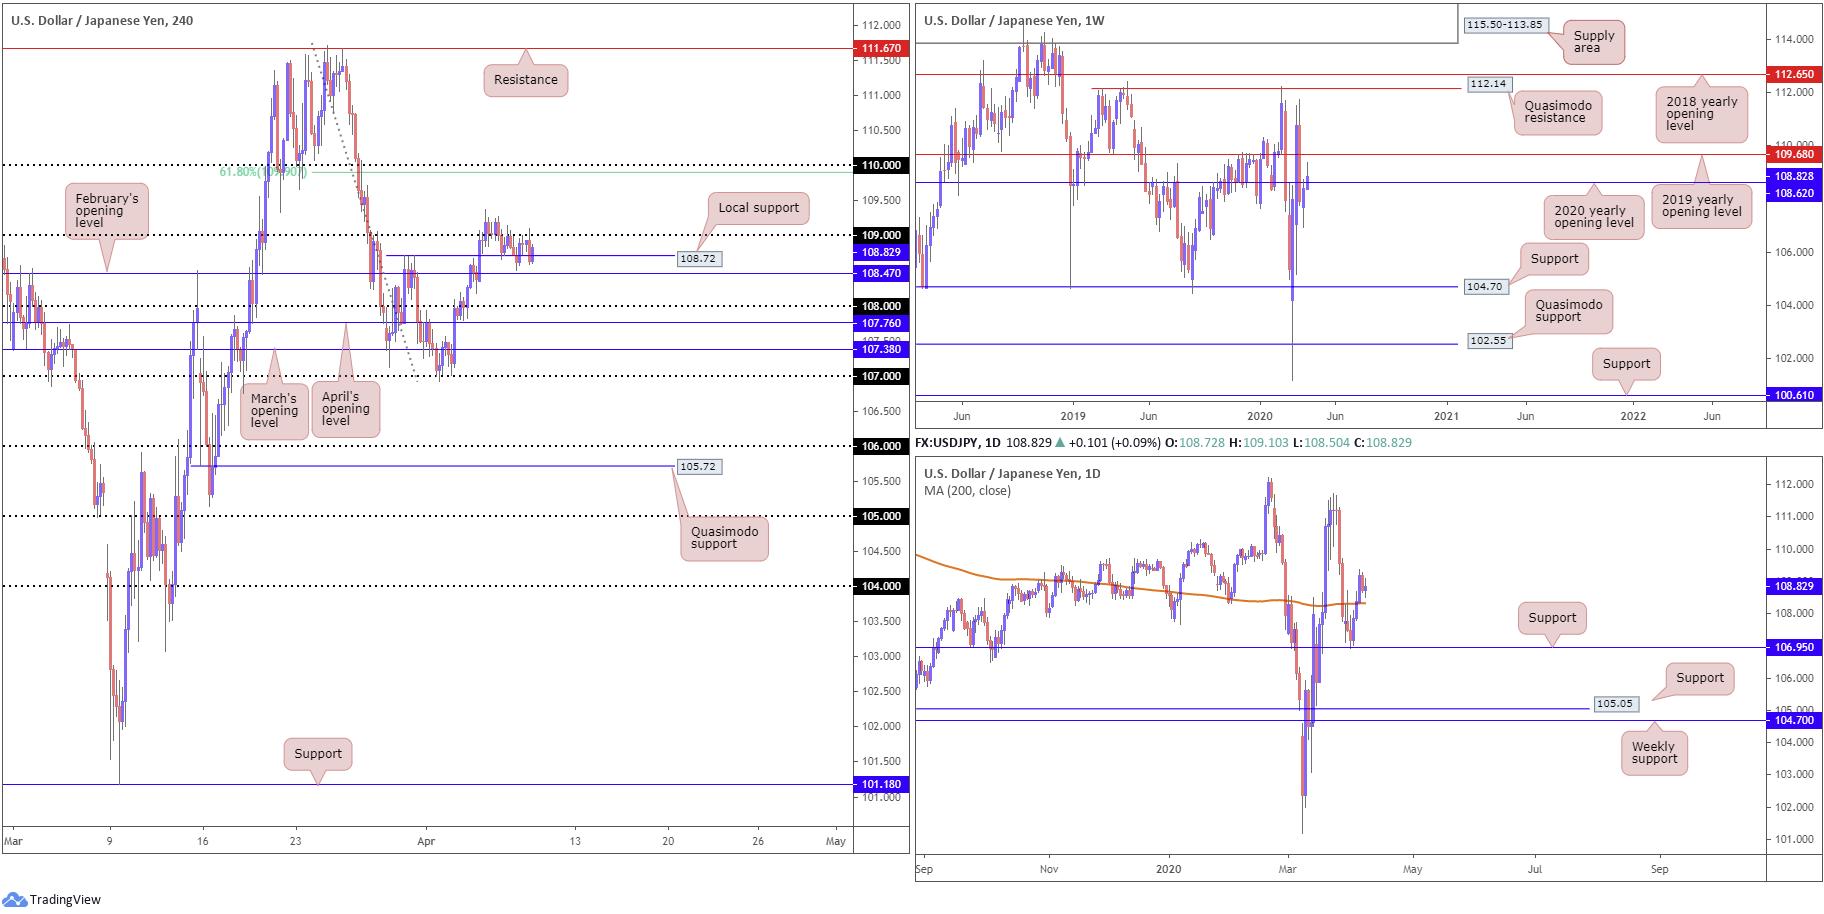
Overall, it was a muted session Wednesday.
USD/JPY H4 is seen bouncing between local support around 108.72 (sited just ahead of February’s opening level at 108.47) and the 109 handle, exhibiting a non-committal tone. Above 109, the 110 handle is seen as the next upside target, sited just north of a 61.8% Fibonacci retracement ratio at 109.90.
Recent movement pulled weekly price through its 2020 yearly opening level at 108.62, drawing the 2019 yearly opening level at 109.68 into sight as possible resistance. Lower on the curve, daily price toppled its 200-day SMA at 108.32, potentially providing an early cue we may be headed for 109.68 on the weekly timeframe. However, a retest of the said SMA value could be on the cards before exploring higher ground.
Areas of consideration:
Despite lacklustre trade, the research team still feels upside above 109 is possible, in light of the bigger picture showing scope for higher levels to at least 109.68 (weekly timeframe). As such, a H4 close back above 109 today may draw breakout buyers into the frame, with conservative traders possibly joining the party should a retest at 109 occur and hold in the form of a bullish candlestick pattern.
USD/CAD:
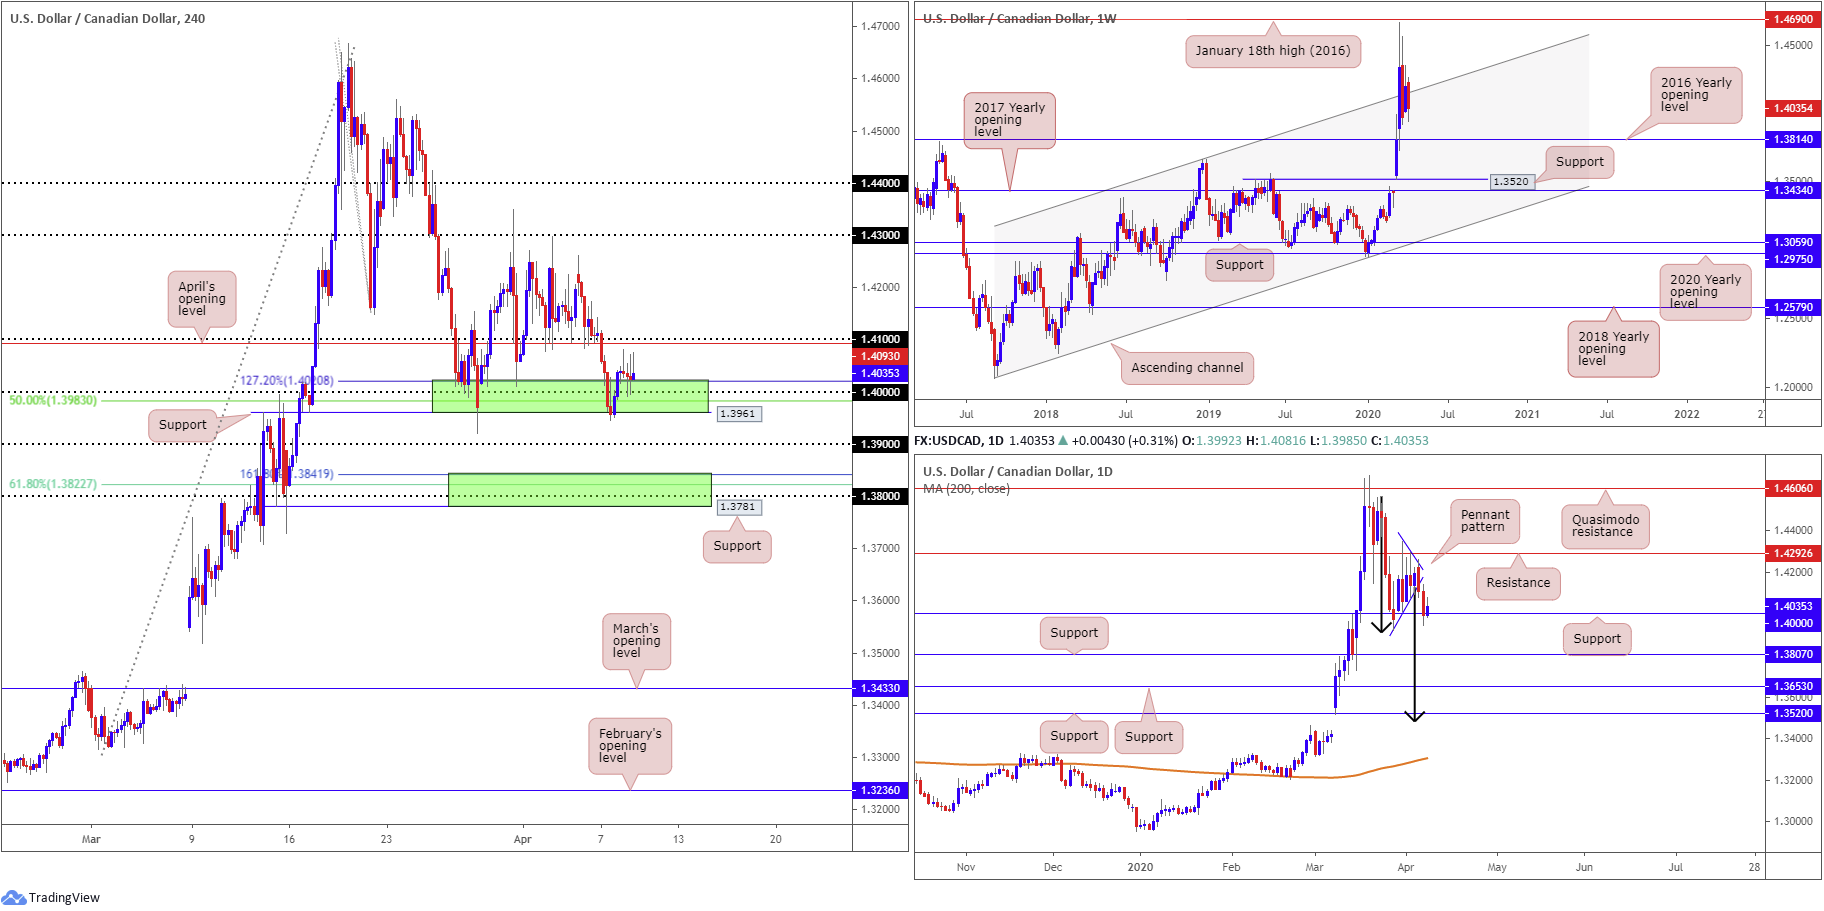
The H4 support zone between 1.3961-1.4020 (upper green zone), made up of a 127.2% Fibonacci extension base at 1.4020, the round number 1.40, a 50.0% retracement at 1.3983 and support coming in at 1.3961, held price action modestly higher on Wednesday. Price, however, failed to make much headway out of the zone as oil took to higher levels, with USD/CAD forming a number of shooting star candlestick configurations – generally considered a bearish signal.
In the event 1.3961-1.4020 fails to hold, 1.3781-1.3841 is next in the firing range, comprised of a H4 support level at 1.3781, the 1.38 handle, a 61.8% Fibonacci retracement ratio at 1.3822 and a 161.8% Fibonacci extension point at 1.3841 (lower green zone).
Across the page on the daily timeframe, pattern traders will recognise a bearish pennant formation (1.4349/1.4011) had its lower edge breached in recent movement, with daily support at 1.4000 welcoming price action, which for now, is holding firm. The take-profit target for the bearish pattern is set around 1.3482, measured by taking the preceding move prior to the pattern formation and adding this value to the breakout point (black arrows).
Higher up on the curve, weekly price is making space south of a channel resistance, extended from the high 1.3661, with the 2016 yearly opening level at 1.3814 noted as a possible downside target.
Areas of consideration:
1.3961-1.4020 on the H4 timeframe is unlikely to hold ground. Not only has it had its lower edge tested, along with price failing to print anything meaningful to the upside, weekly price shows room to approach 1.3814 and daily price recently broke out of a bearish pennant formation, with plenty of room seen to the downside until crossing swords with its take-profit target.
While daily support at 1.4000 has buyers attempting to hold things higher, sellers still appear to have the upper hand. For that reason, bearish scenarios off either 1.41 or beneath 1.40 on the H4 may be an option today, targeting 1.39 as the initial take-profit zone.
USD/CHF:
Following Tuesday’s precipitous near-1% decline, Wednesday staged a modest recovery alongside the US dollar index which tackled waters north of the 100.00 handle.
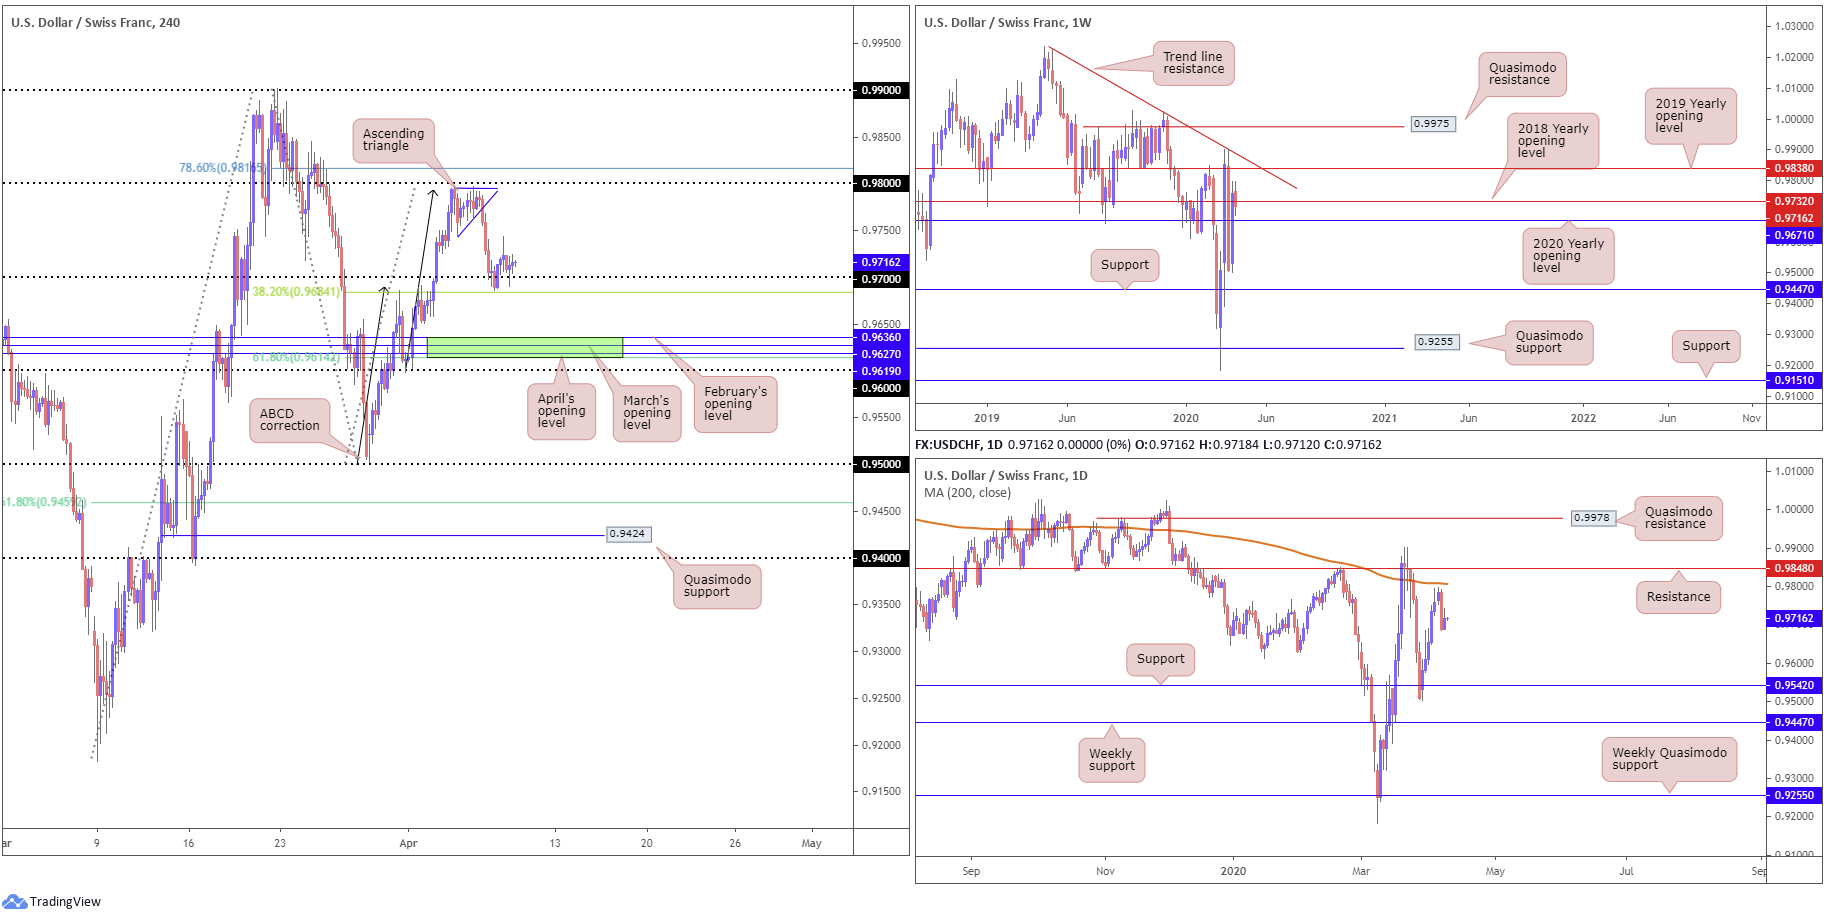
H4 price, after testing a H4 ABCD bearish completion (black arrows) from 0.9794, shattered the lower boundary of an ascending triangle formation and made a run for the 0.97 boundary, reinforced closely by a 38.2% Fibonacci retracement at 0.9684 (a traditional take-profit target out of ABCD formations). Should we navigate lower levels, an interesting combination of monthly opening levels from April, March and February form around 0.9619, 0.9627 and 0.9636, respectively. Note this area closely connects with the 61.8% Fibonacci retracement at 0.9614 – considered the second take-profit target out of the ABCD pattern.
As seen on the weekly timeframe, the current candle crossed back beneath the 2018 yearly opening level at 0.9732 in recent trading, consequently shifting focus back to the 2020 yearly opening level at 0.9671. Closer analysis of price action on the daily timeframe reveals USD/CHF holds beneath its 200-day SMA (orange – 0.9806), threatening the possibility of a run to support at 0.9542.
Areas of consideration:
Bearish setups south of 0.97 are an idea some may explore, given weekly price reclaiming 0.9732, targeting the 2020 yearly opening level on the weekly timeframe at 0.9671, followed by 0.9614/0.9636 on the H4.
0.9614/0.9636 is an interesting area of support also likely on the watchlists of many traders today (contains a number of monthly opening levels and a 61.8% Fibonacci support), not only as a take-profit target, but also as a platform for buyers to possibly enter the market. Traders are, however, urged to pencil in the possibility of a fakeout to 0.96 before serious buyers step in.
Dow Jones Industrial Average:
US equities rebounded Wednesday after Bernie Sanders ended his presidential campaign. The Dow Jones Industrial Average added 779.71 points, or 3.44%; the S&P 500 also gained 90.57 points, or 3.41%, and the tech-heavy Nasdaq 100 concluded higher by 108.24 points, or 2.24%.
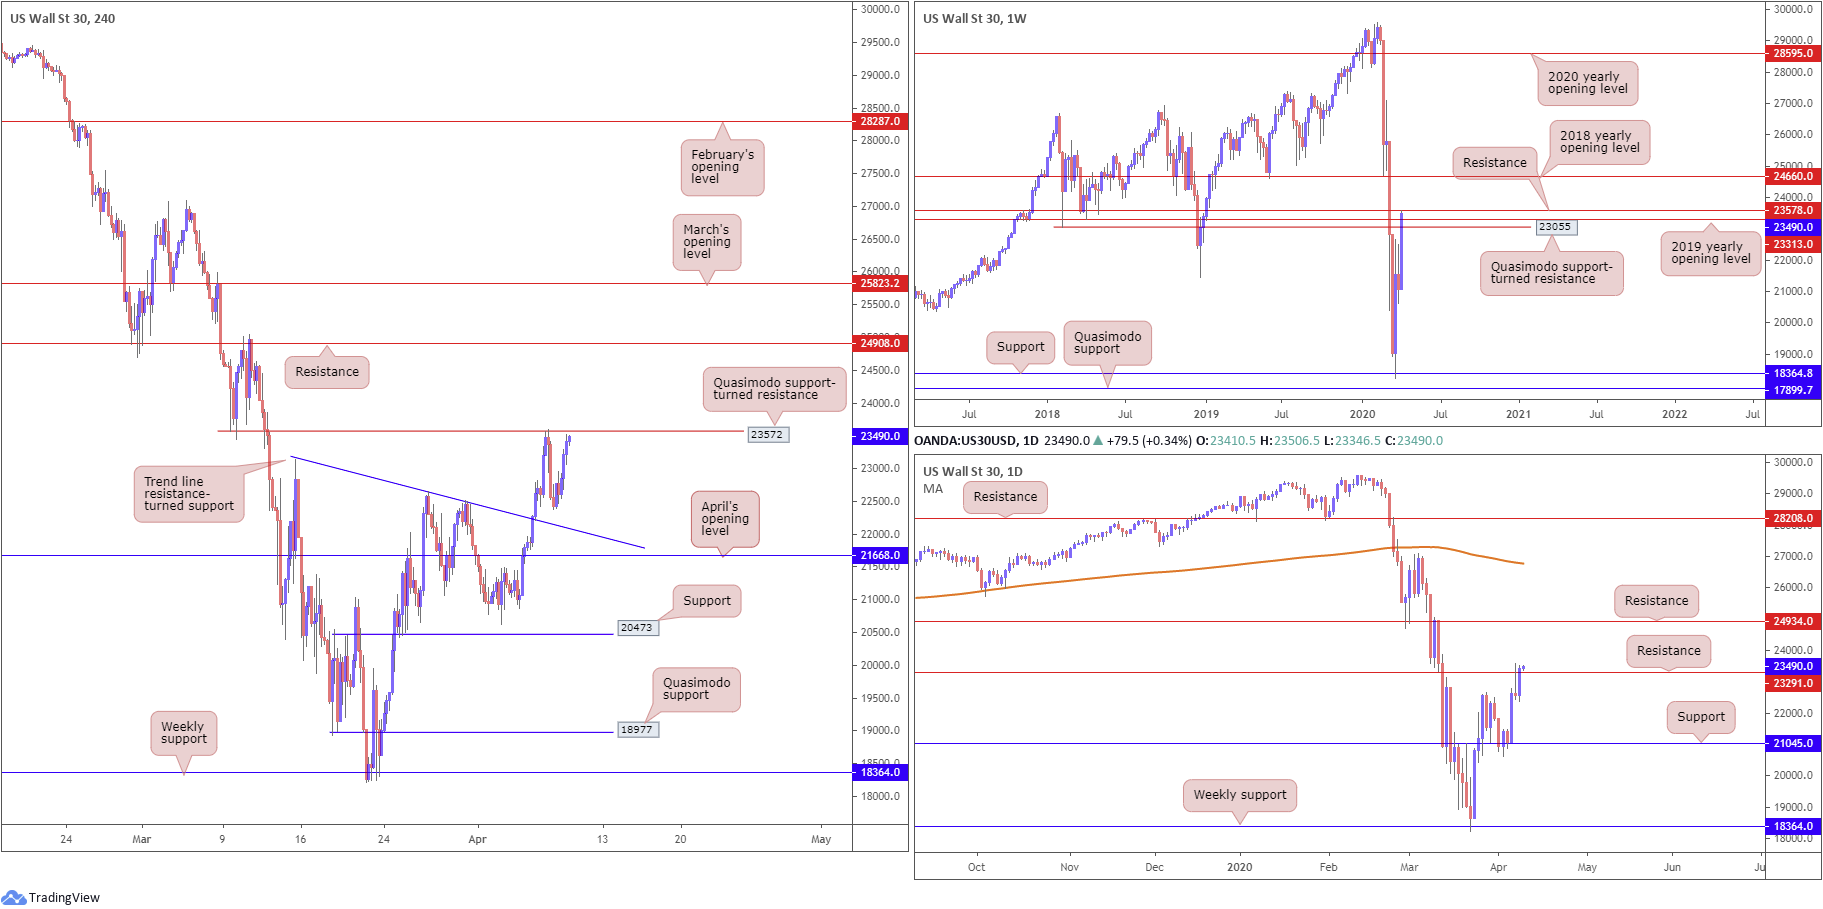
Kicking off from the weekly timeframe, we can see yesterday’s advance drew the current weekly candle back to within the walls of resistance, comprised of 23578, the 2019 yearly opening level at 23313 and a Quasimodo support-turned resistance at 23055.
Price action on the daily timeframe shows limited follow through took shape Wednesday, following Tuesday’s shooting star candlestick pattern off resistance at 23291. Daily flow concluded the session marginally over the said resistance, potentially setting the stage for a run to resistance at 24934.
A closer reading of price action on the H4 timeframe has flow testing waters just south of a familiar Quasimodo support-turned resistance at 23572. A rejection could form the basis for a double-top scenario, whereas a push through the level has resistance at 24908 to target.
Areas of consideration:
Although the US equity market has put in an impressive move to the upside so far this week, getting through the current weekly resistance area between 23758 and 23055 is likely to be a challenge. For that reason, resistance off 23572 on the H4 timeframe could be an area of interest for some traders today, though many will likely seek additional confirmation before pulling the trigger.
Downside targets from 23572 has yesterday’s session low at 22371 in view, followed by H4 trend line resistance-turned support, taken from the high 23145.
XAU/USD (GOLD):
Gold prices enter Thursday pretty much unmoved, spending the best part of Wednesday circulating around the lower edge of Tuesday’s range. In view of yesterday’s lacklustre performance, much of the following will echo thoughts put forward from Wednesday’s technical briefing.
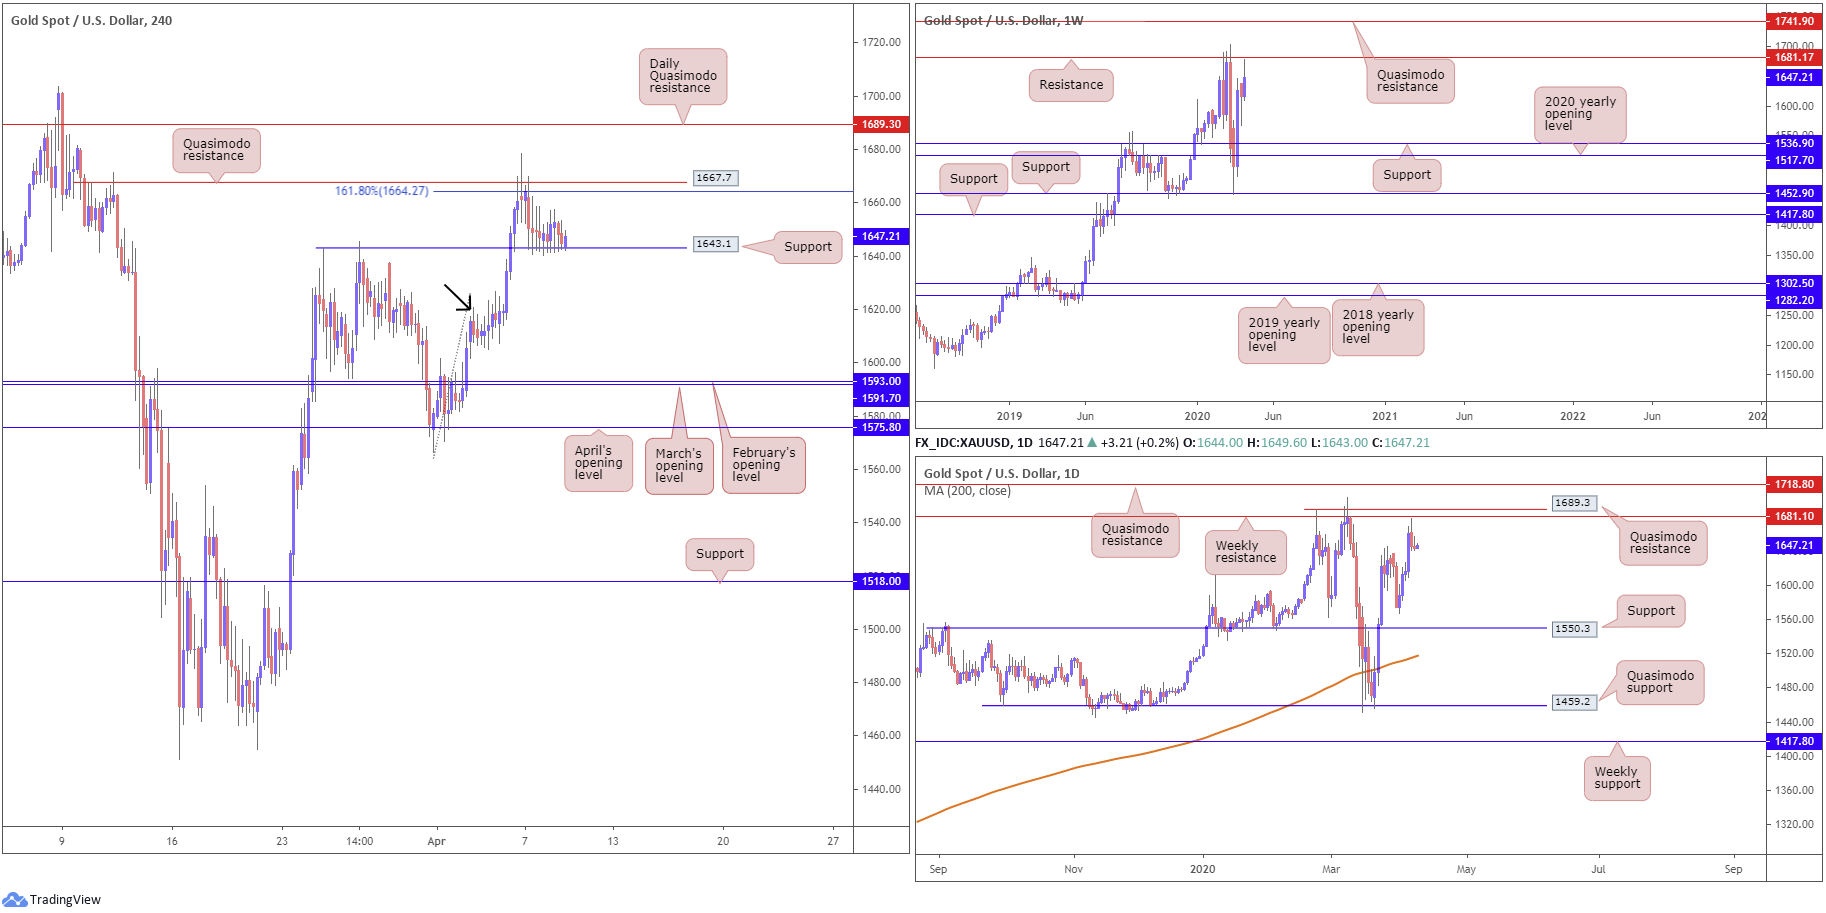
H4 Quasimodo resistance at 1667.7 remains in the field, as does the 161.8% Fibonacci extension at 1664.2. Recent action, however, nudged into local support at 1643.1, a prior Quasimodo support level. Should the level fail, demand is visible around 1617.0ish (black arrow), followed by March and April’s opening levels at 1591.7 and 1593.0, respectively.
Further out on the weekly timeframe, we have the current candle off best levels south of resistance at 1681.1, with a break of this base exposing Quasimodo resistance at 1741.9. As evident from the daily chart, price action is retreating a few points beneath weekly resistance at 1681.1, closely followed by daily Quasimodo resistance at 1689.3. Support on the higher timeframes is not expected to emerge until reaching a daily base coming in at 1550.3.
Areas of consideration:
Having noted higher-timeframe flow making a show close by weekly resistance at 1681.1, H4 action may look to step through current support at 1643.1 today.
While a decisive H4 close sub 1643.1 will lure breakout sellers into the market, conservative traders may seek additional confirmation, such as a retest of 1643.1, or even a retest that’s formed by way of a bearish candlestick signal. Irrespective of the entry, H4 support could develop off 1617.0 and also from March and April’s opening levels at 1591.7 and 1593.0.
The accuracy, completeness and timeliness of the information contained on this site cannot be guaranteed. IC Markets does not warranty, guarantee or make any representations, or assume any liability regarding financial results based on the use of the information in the site.
News, views, opinions, recommendations and other information obtained from sources outside of www.icmarkets.com.au, used in this site are believed to be reliable, but we cannot guarantee their accuracy or completeness. All such information is subject to change at any time without notice. IC Markets assumes no responsibility for the content of any linked site.
The fact that such links may exist does not indicate approval or endorsement of any material contained on any linked site. IC Markets is not liable for any harm caused by the transmission, through accessing the services or information on this site, of a computer virus, or other computer code or programming device that might be used to access, delete, damage, disable, disrupt or otherwise impede in any manner, the operation of the site or of any user’s software, hardware, data or property.


