
A note on lower timeframe confirming price action…
Waiting for lower timeframe confirmation is our main tool to confirm strength within higher timeframe zones, and has really been the key to our trading success. It takes a little time to understand the subtle nuances, however, as each trade is never the same, but once you master the rhythm so to speak, you will be saved from countless unnecessary losing trades. The following is a list of what we look for:
- A break/retest of supply or demand dependent on which way you’re trading.
- A trendline break/retest.
- Buying/selling tails/wicks – essentially we look for a cluster of very obvious spikes off of lower timeframe support and resistance levels within the higher timeframe zone.
- Candlestick patterns. We tend to stick with pin bars and engulfing bars as these have proven to be the most effective.
We search for lower timeframe confirmation between the M15 and H1 timeframes, since most of our higher-timeframe areas begin with the H4. Stops are usually placed 5-10 pips beyond confirming structures.
EUR/USD:
Recent action shows that the EUR/USD extended its bounce from the 1.07 neighborhood, consequently placing the H4 candles just ahead of a H4 Quasimodo resistance level at 1.0771. The move was reinforced by daily support coming in at 1.0710, which has remained a noteworthy level since 1998! Technically speaking, however, we do not imagine price progressing much past the H4 resistance at 1.0830/1.08 handle in the days ahead. Our reasoning lies within the weekly chart. Not only is there currently a long-term trendline resistance (taken from the low 0.8231) in motion, but a few inches beyond here sits the 2016 yearly opening level at 1.0873 and resistance drawn from 1.0819.
On account of the above, our desk has chalked up a H4 sell zone between the H4 resistance at 1.0830 and the 1.08 handle (green rectangle). Sandwiched between this area is a H4 38.2% Fib resistance level at 1.0808 (stretched from the high 1.1299), as well as the above noted weekly resistance level coming in at 1.0819.
Our suggestions: Of course, we cannot rule out the possibility of the H4 Quasimodo resistance at 1.0771 holding firm today, as let’s not forget that there is a weekly trendline resistance in play right now! Be that as it may, our prime focus today will be a little higher on the curve at the aforementioned H4 sell zone. While we believe a reaction is likely to be seen from this region, traders also need to be prepared for the possibility of a fakeout higher to the yearly opening level mentioned above at 1.0873. For that reason, waiting for at least a H4 bearish close to form within the H4 sell zone before pulling the trigger is, at least in our view, the safer river to swim.
Data points to consider: EUR Minimum bid rate at 12.45pm, ECB Press conference at 1.30pm as well as the weekly US Jobless claims also at 1.30pm GMT.
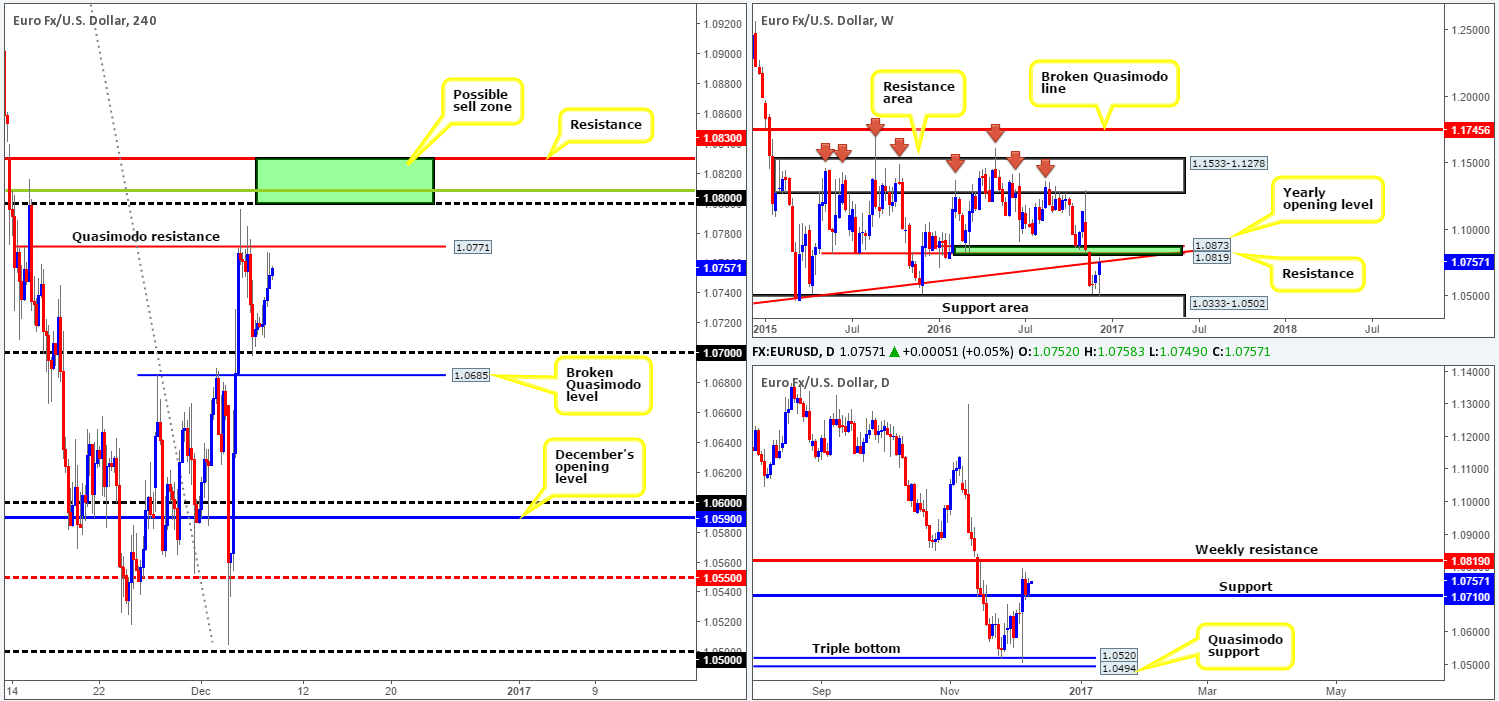
Levels to watch/live orders:
- Buys: Flat (stop loss: N/A).
- Sells: 1.0830/1.08 ([reasonably sized H4 bearish close required prior to pulling the trigger] stop loss: ideally beyond the trigger candle).
GBP/USD:
Yesterday’s UK factory production report came in lower than expected, forcing the GBP into further losses. The move saw price slip below bids at 1.26 and eventually test the nearby H4 demand seen at 1.2559-1.2581. The response from this demand has so far been positive, pushing the unit back above the 1.26 boundary into the closing bell.
Although the technical landscape on the H4 picture reflects a rather bullish stance at the moment, how do things stand on the higher timeframes? Well, over on the weekly scale, there’s scope for this market to continue rallying at least until we reach resistance chiseled in at 1.2938. Looking down to the daily candles we can see that price recently came within reaching distance of connecting with a broken Quasimodo line at 1.2557 (located just below the current H4 demand), and as a result produced an end-of-day correction.
Our suggestions: Given all three timeframes sport somewhat of a bullish posture, our desk will be watching for price to retest the 1.26 psychological support today as per the black arrows. To avoid the possibility of a fakeout through this level, similar to what was seen yesterday, waiting for a H4 bull candle to print is, at least for the team here, a prerequisite prior to a trade being permitted.
Data points to consider: US Jobless claims at 1.30pm GMT.
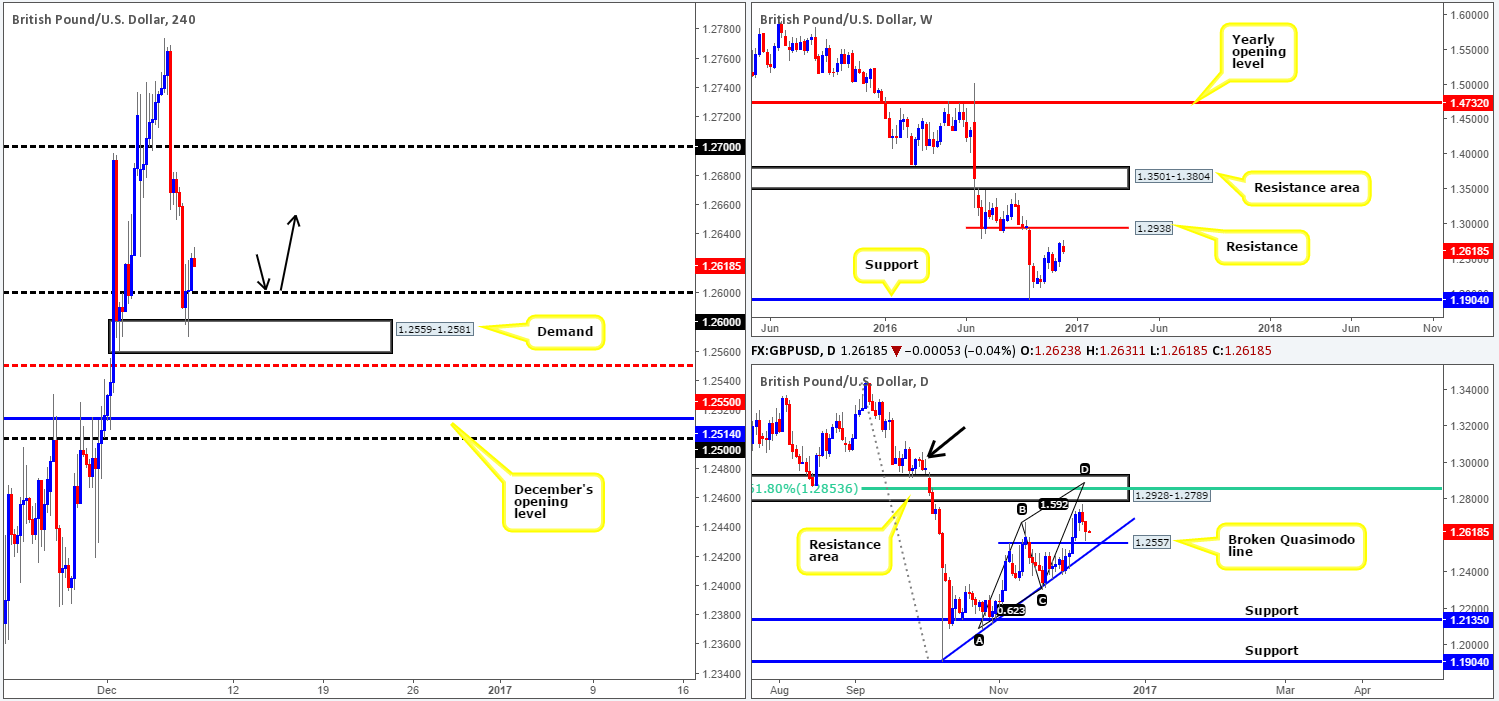
Levels to watch/live orders:
- Buys: 1.26 region ([reasonably sized H4 bullish close required prior to pulling the trigger] stop loss: ideally beyond the trigger candle).
- Sells: Flat (stop loss: N/A).
AUD/USD:
The commodity currency fell sharply in early trading yesterday on the back of disappointing Q3 GDP data. Despite this, the downside move was a short-lived one! After a few hours basing around lows of 0.7417 during Asia, the pair reversed the majority of the morning’s losses amid the London morning segment and went on to punch higher as US traders entered the fray. This has, as you can see, placed the Aussie back within the clutches of a H4 supply zone marked at 0.7500-0.7477.
As discussed in yesterday’s report, the main focal point remains between the current H4 supply zone and September’s opening level at 0.7518 (upper green zone). The zone is considered, at least by our desk, to be a fakeout area. Our reasoning simply stems from the amount of stops likely positioned above the current H4 supply, hence the expectation of a fakeout/stop run. What’s more, this region intersects beautifully with the daily trendline resistance stretched from the low 0.7407. As tempting as this area is though, one must also acknowledge weekly action currently trading from a support area at 0.7438-0.7315, thus a drive through the H4 sell zone is a possibility.
Our suggestions: As there is risk of weekly bulls pushing this market higher (see above), we would recommend waiting for a H4 bear candle to confirm seller interest at 0.7518/ 0.7500-0.7477 before pressing the sell button.
Data points to consider: Aussie Trade balance at 12.30am, Chinese Trade balance (tentative). US Jobless claims at 1.30pm GMT.
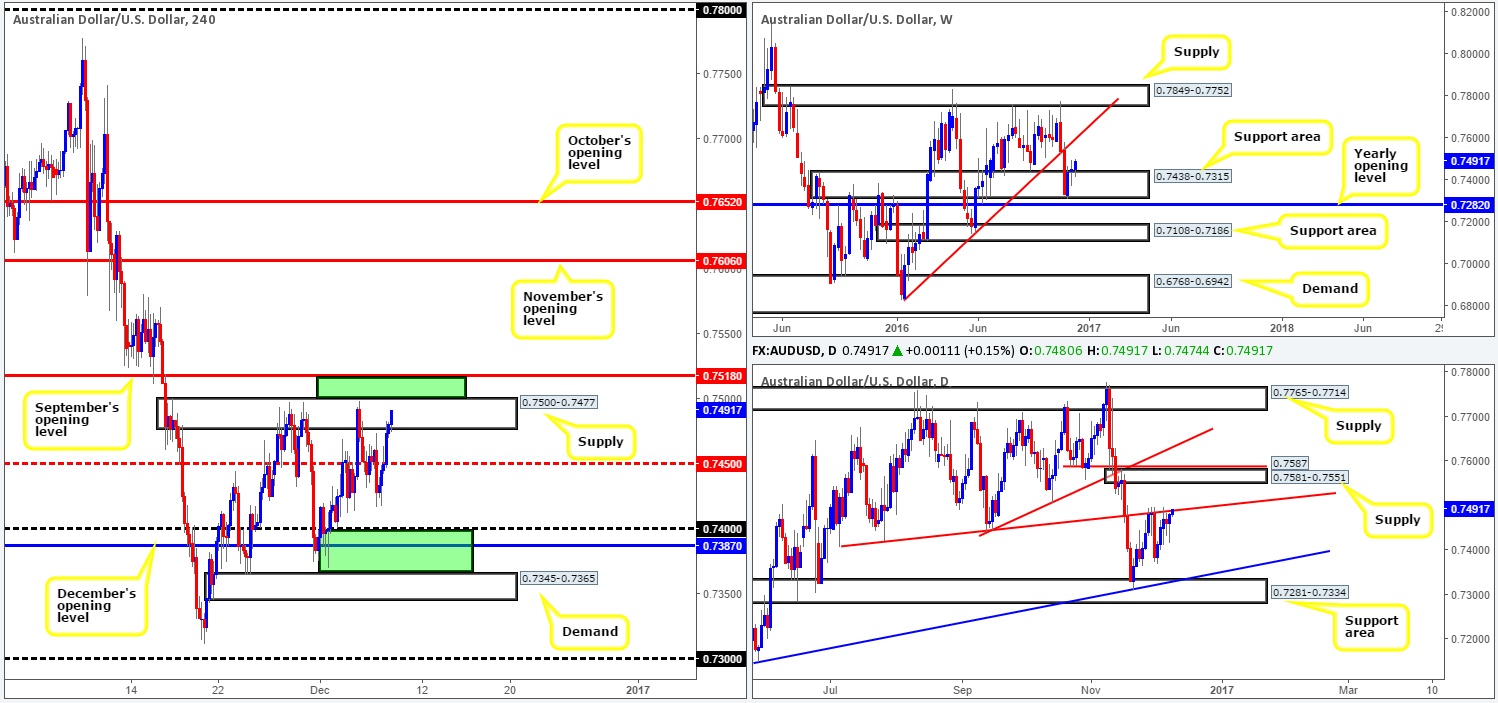
Levels to watch/live orders:
- Buys: Flat (stop loss: N/A).
- Sells: 0.7518/0.75 ([reasonably sized H4 bearish close required prior to pulling the trigger] stop loss: ideally beyond the trigger candle).
USD/JPY:
Kicking this morning’s report off with a look at the weekly chart, the candles are seen struggling to sustain gains beyond the 114.55 level. A continued rejection off this boundary could inspire further downside to demand formed at 111.44-110.10. Looking a little lower on the curve, daily demand at 113.80-113.16 appears to be on the verge of giving way. Little bullish interest has been registered from this area since Monday. The next downside hurdle beyond this region can be seen at 111.35-112.37: a demand zone that is bolstered by a trendline support drawn from the low 105.54.
The above points – coupled with the fact that the H4 candles have just breached a H4 trendline support extended from the low 109.80, could lead to the 113 handle being brought into view today. An attractive setup from current prices would be to see price pullback and retest the 114 barrier as resistance. Of course, by trading short from this number, you’d effectively be selling into a daily demand, albeit a weak-looking one! The flipside, of course, is that you’d be selling in line with weekly flow from the current resistance at 114.55.
Our suggestions: 114 is of interest to our desk this morning. We would, as long as price printed a H4 rejection candle off this level, look to trade short this market, targeting 113 as an immediate take-profit zone. However, to be clear, the rejection candle would have to be of reasonable size – a bearish engulfing candle would be textbook!
Data points to consider today: US Jobless claims at 1.30pm GMT.
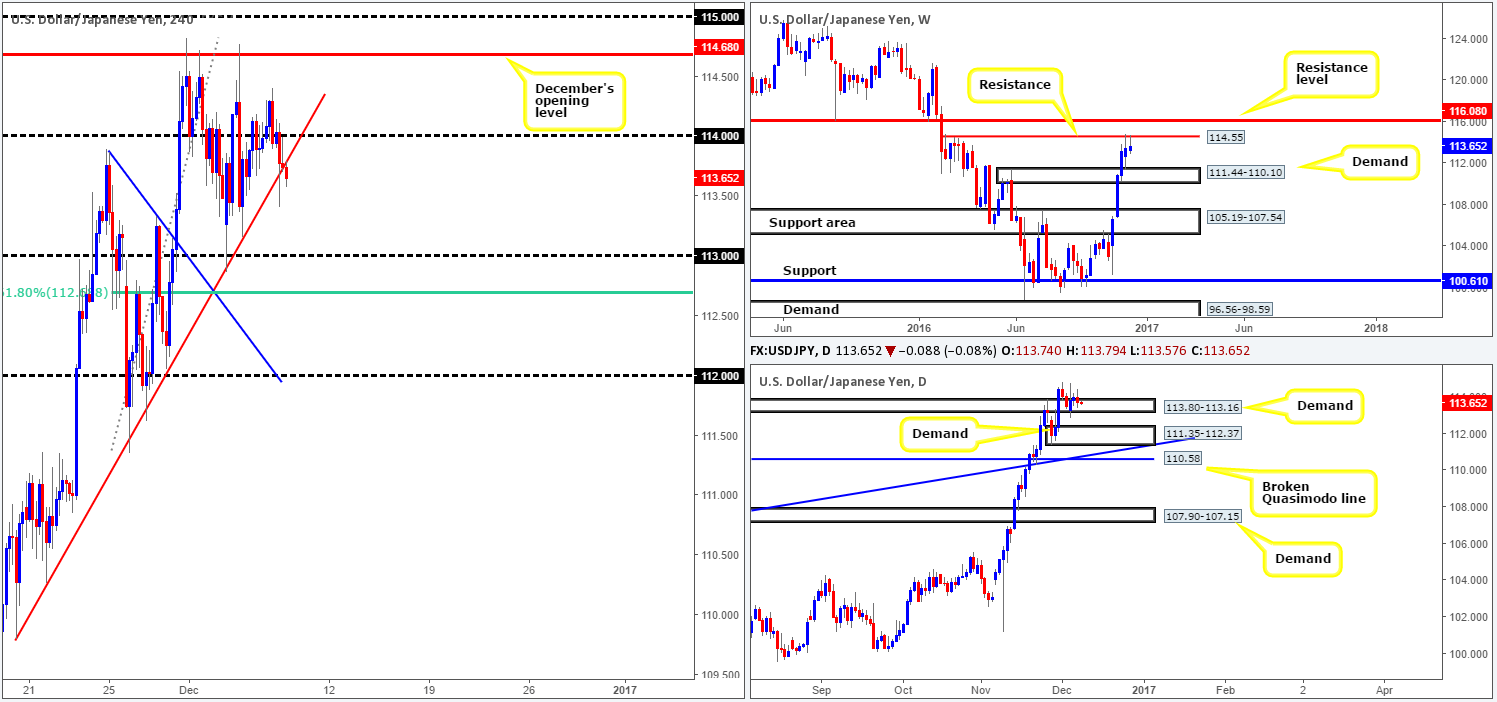
Levels to watch/live orders:
- Buys: Flat (stop loss: N/A).
- Sells: 114 region ([reasonably sized H4 bearish close required prior to pulling the trigger] stop loss: ideally beyond the trigger candle).
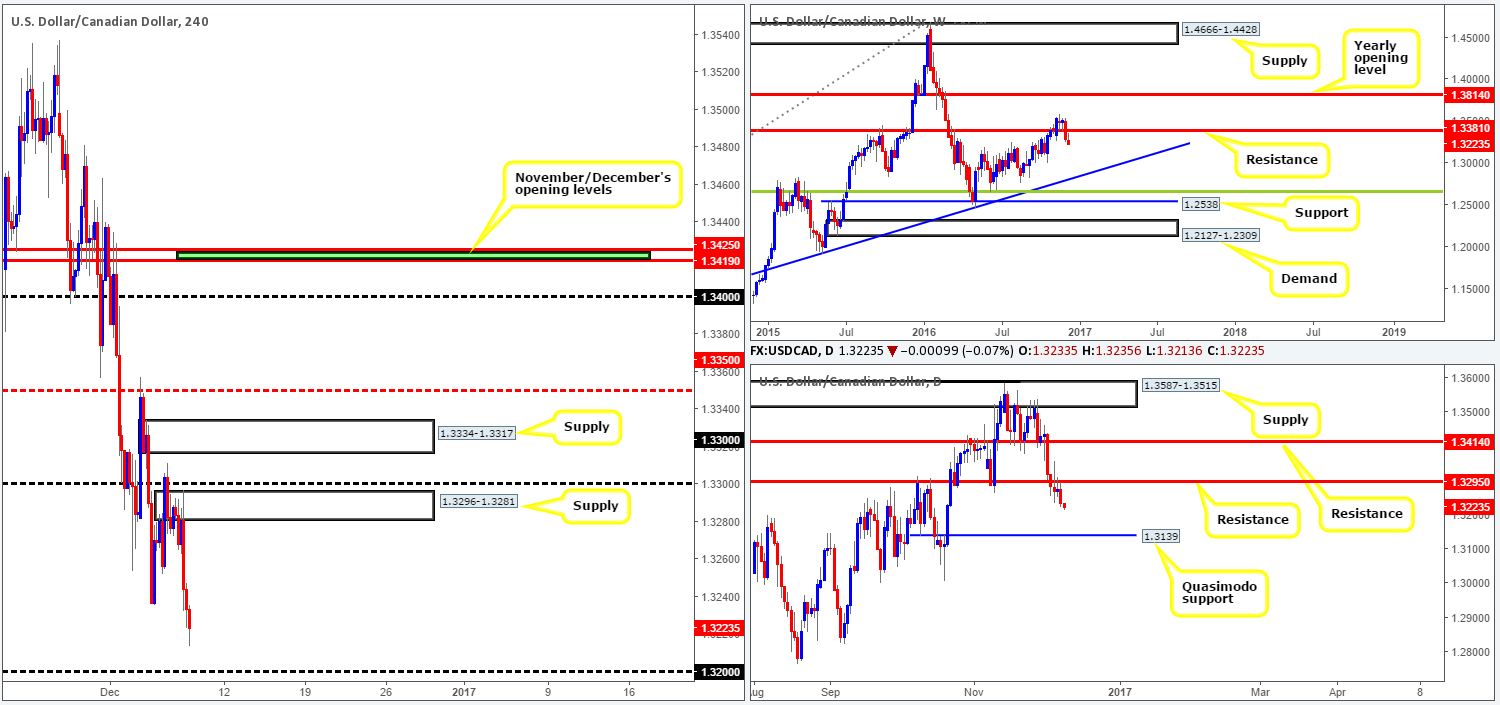
USD/CAD:
Leaving the psychological resistance at 1.33 unchallenged, the pair spiraled south amid the early hours of yesterday’s US session on the back of the BoC leaving interest rates unchanged. As a result, the pair is seen trading just ahead of the psychological support level at 1.32. From our perspective, this level has struggled as a support/resistance barrier in recent months, and as such may not hold should it be tested today. The next hurdle seen beyond this level is the H4 mid-way support at 1.3150, followed closely by October’s opening level at 1.3120.
Daily resistance at 1.3295, as you can see, held steady for a third consecutive day yesterday, but in this instance managed to close on a bearish note. Thus, this could up the possibility for a drive down to the daily Quasimodo support at 1.3139 (located 20 pips above the aforementioned October opening level). Meanwhile, up on the weekly chart, the next downside target from current resistance at 1.3381 can be seen much lower at a trendline support taken from the high 1.1278.
Our suggestions: To our way of seeing things at the moment, the pair certainly reflects somewhat of a bearish stance at present. Nevertheless, our desk has noted that no short trades are permitted until a H4 close has been seen below the 1.32 handle. A close below this number, followed by a retest and a reasonably sized H4 bearish close would, if you ask us, be sufficient enough to justify a sell, targeting the H4 mid-way support mentioned above at 1.3150 as a first take-profit target.
Data points to consider today: Canadian housing data at 1.30pm alongside the US Jobless claims report also at 1.30pm GMT.
Levels to watch/live orders:
- Buys: Flat (stop loss: N/A).
- Sells: Watch for a H4 close to form below the 1.32 level and then look to trade any retest seen thereafter ([H4 bearish candle close required following the retest] stop loss: ideally beyond the trigger candle).
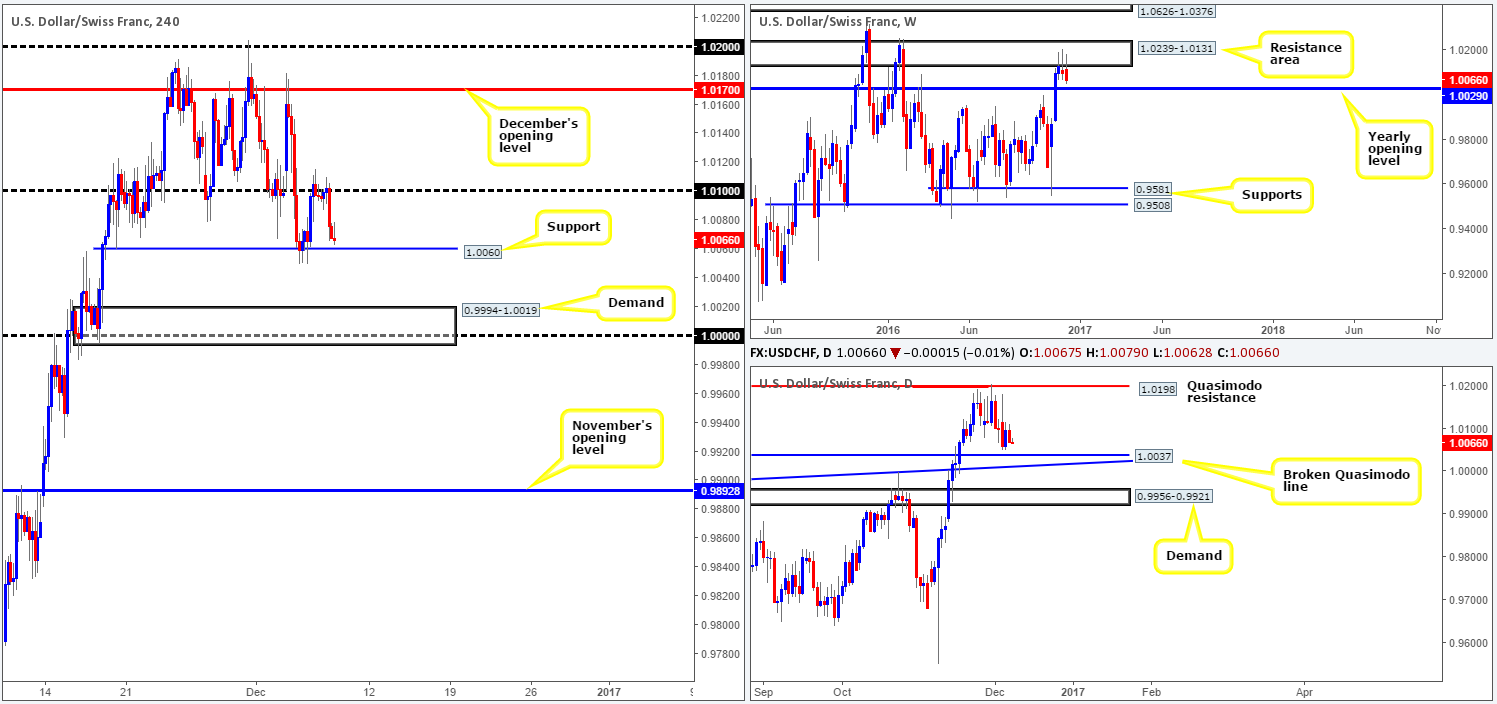
USD/CHF:
Strengthened by the recent EUR/USD rally and an overall weaker dollar, the USD/CHF sold off from the 1.01 handle going into yesterday’s US morning segment, consequently bringing price to within an inch of striking H4 support at 1.0060. The weekly resistance area at 1.0239-1.0131 continues to cap upside, with the next downside objective seen at 1.0029: the 2016 yearly opening level. Sitting less than 10 pips above this yearly level is a daily broken Quasimodo support level coming in at 1.0037, which happens to be placed nearby a daily trendline support extended from the high 0.9956.
Therefore, even with a H4 close below the current H4 support that would, according to the H4 timeframe, likely open up the possibility of further selling down to a H4 demand at 0.9994-1.0019 (holds parity), trading short this market would be problematic given how close by the above mentioned higher-timeframe supports are positioned. However, trading long from the above noted H4 demand is interesting. Granted, this would mean entering long against weekly flow, but considering that there is a nearby yearly opening level a bullish rotation from the H4 area is high probability.
Our suggestions: Evident from the nearby higher-timeframe supports, entering short beyond the H4 support is not something that we would be comfortable with. A long from the current H4 demand is, however, worthy of a buy, in our opinion. Nevertheless, seeing as this zone houses parity, this number could become a magnet to price, strengthening the chances of a fakeout below this level and by extension the H4 demand area. Waiting for a H4 bull candle to form is necessary before looking to press the buy button!
Data points to consider today: US Jobless claims at 1.30pm GMT.
Levels to watch/live orders:
- Buys: 0.9994-1.0019 ([reasonably sized H4 bullish close required prior to pulling the trigger] stop loss: ideally beyond the trigger candle).
- Sells: Flat (stop loss: N/A).
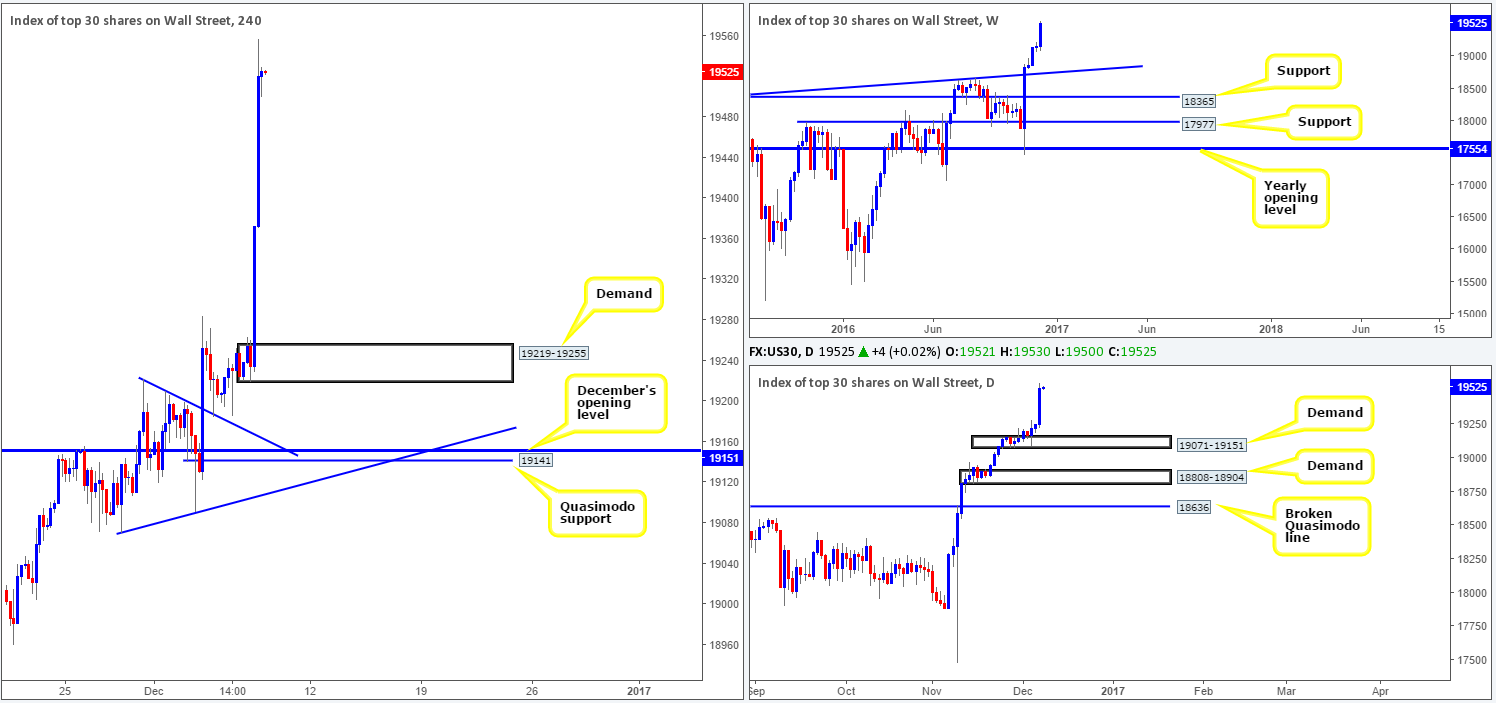
DOW 30:
Equities soared to all-time highs of 19557 yesterday as the US session got under way. According to Bloomberg, all but three of its thirty stocks advanced! This begs the question, how long can the bulls sustain this Trump-induced momentum!?
Of course, we would absolutely love to buy this market, but given that there is very little support seen nearby at the moment, it is proving difficult. The closest barrier of support comes in at 19219-19255: a H4 demand area. Meanwhile, below this is a daily demand zone seen at 19071-19151. The top edge of this area represents December’s opening level at 19151, while 10 points below (within the daily area) is a Quasimodo support seen at 19141.
Our suggestions: For those who require structure to trade, as we do, you could be a little out of luck today. As of this point, we see no alternative but to sit on the sidelines and watch until new structure is formed.
Levels to watch/live orders:
- Buys: Flat (stop loss: N/A).
- Sells: Flat (stop loss: N/A).
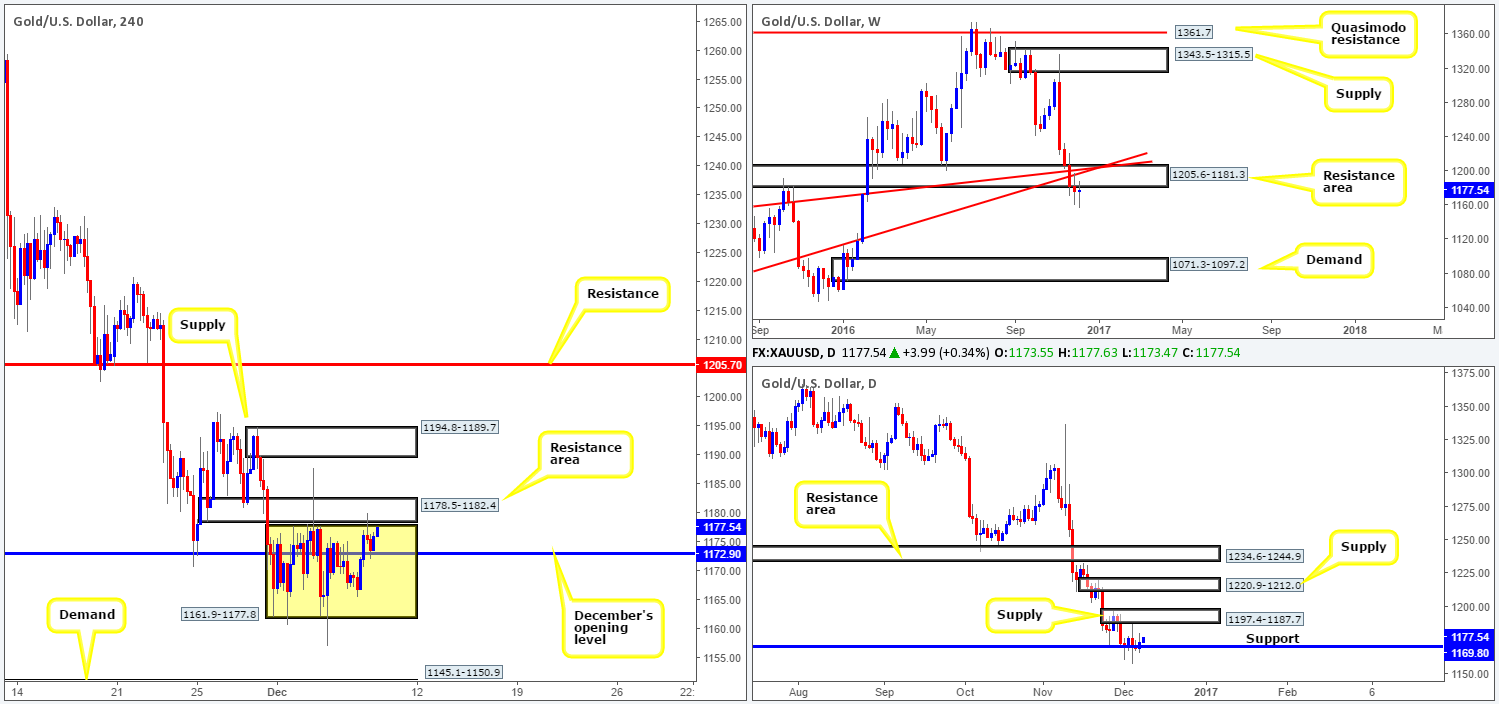
GOLD:
As can be seen from the H4 chart this morning, gold prices are effectively unchanged as far as structure is concerned. Since the beginning of the month, the yellow metal has been seen trading within the walls of a H4 consolidation fixed at 1161.9-1177.8. The top edge of this consolidation is bolstered by a H4 resistance area drawn from 1178.5-1182.4, which was tested during yesterday’s US morning session. A breakout south of this H4 range, nevertheless, likely clears the path south for price to test H4 demand at 1145.1-1150.9.
Now, considering that the weekly candles remain beneath the resistance area at 1205.6-1181.3, there’s a chance we may see a continuation move south from current price. However, to confirm bearish strength from the current weekly resistance area, a DECISIVE daily close below daily support at 1169.8 would be is needed. The close, in our estimation, would likely open up a void down to 1108.2-1117.8: a daily demand.
Our suggestions: Based on the above points, our team is looking for a H4 close to be seen beyond December’s opening level at 1172.9 (within the above noted H4 consolidation). Should this come into view, and price retests the underside of this level as resistance, it could signify the end of the daily support! Going short on the basis of this move is, nonetheless, still considered a risk. The safer, more conservative route to take would be to wait for a H4 close below the current H4 range. Followed up with a retest to the underside of this area as resistance along with a reasonably sized H4 bearish candle, would be sufficient enough for our team to sell, targeting the H4 demand at 1145.1-1150.9 as a first take-profit zone.
Levels to watch/live orders:
- Buys: Flat (stop loss: N/A).
- Sells: Watch for a H4 close to form below the current H4 consolidation zone at 1161.9-1177.8 and then look to trade any retest seen thereafter ([H4 bearish candle close required following the retest] stop loss: ideally beyond the trigger candle).


