
Key risk events today:
Australia Trade Balance; China Caixin Services PMI; New Zealand Inflation Expectations q/q; China Trade Balance; BoE Monetary Policy Report, MPC Official Bank Rate Votes, Monetary Policy Summary and Official Bank Rate; US unemployment Claims; ECB President Lagarde Speaks.
(Previous analysis as well as outside sources – italics).
EUR/USD:
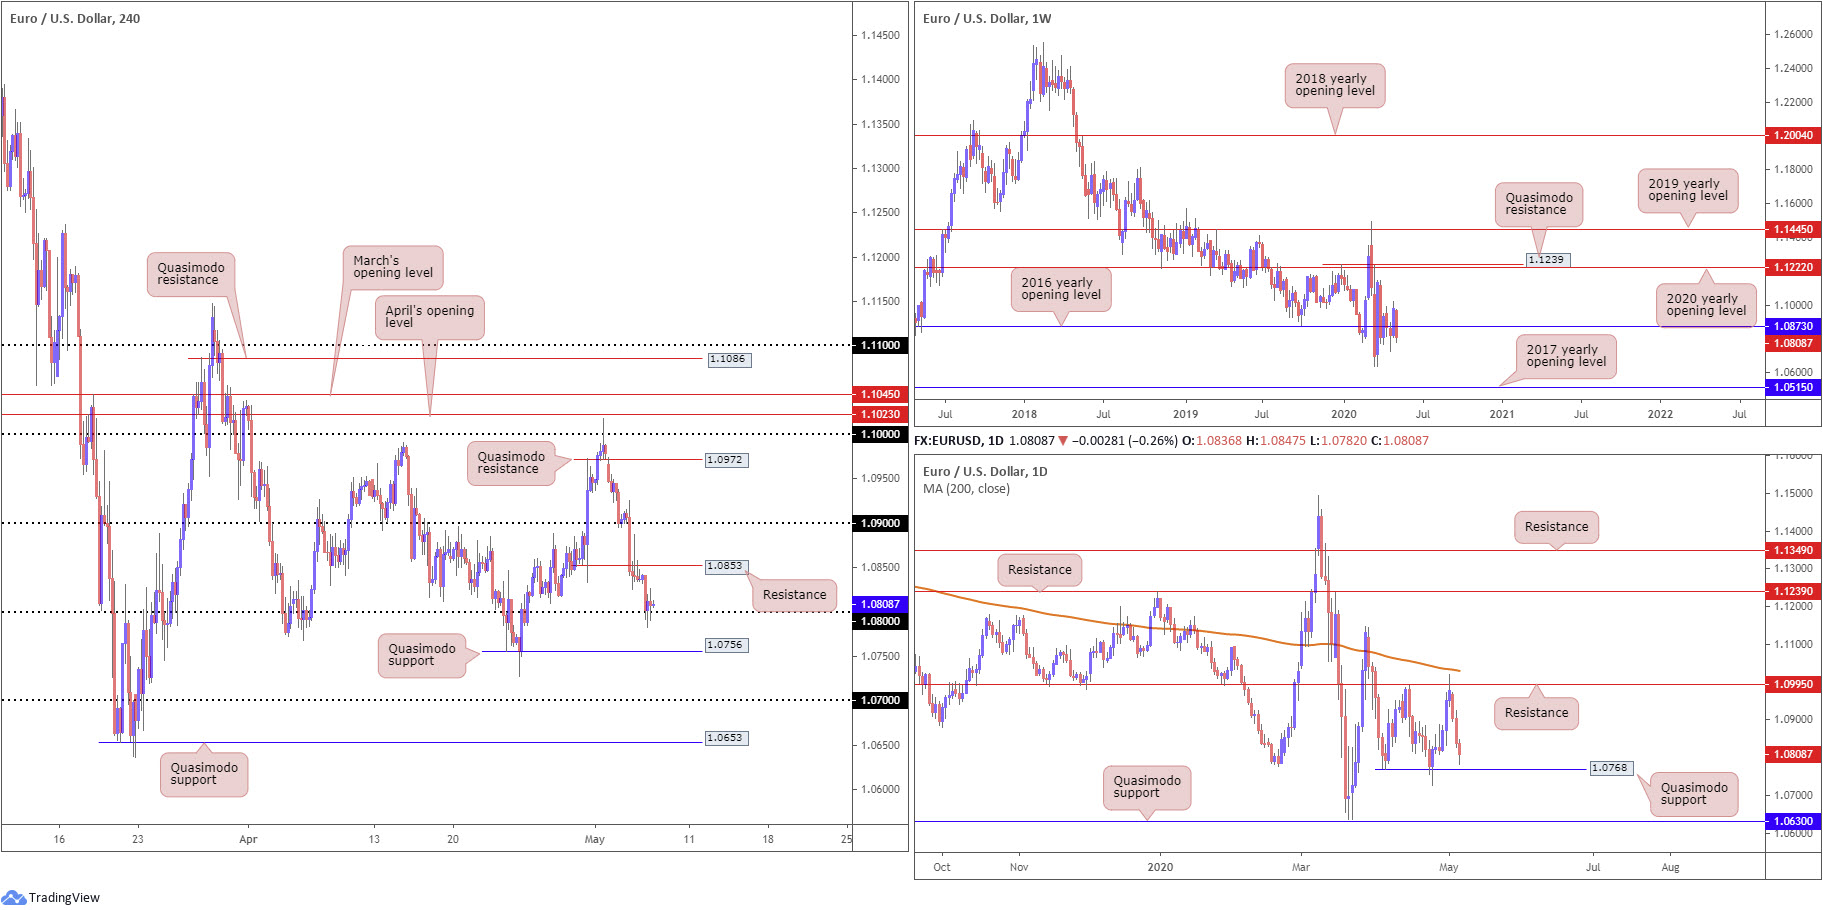
Europe’s single currency upheld its offered tone against the US dollar Wednesday, extending losses south of H4 resistance at 1.0853 and registering its third consecutive daily loss.
1.08 welcomed price action into the mix going into London hours, whipsawing through intraday sell-stops beneath lows at 1.0816. Although 1.08 holds ground, it appears buyers may not have the fire power to defend it much longer, given the lack of H4 bullish candles. Quasimodo support at 1.0756 rests as a possible ‘floor’ under 1.08, with a break revealing 1.07.
Analysis on the higher timeframes has weekly price trading around its 2016 yearly opening level at 1.0873. This has been a level of interest on the weekly chart since April. A nudge lower could see multi-year lows enter sight at 1.0635, while firming may eventually witness the 2020 yearly opening level at 1.1222 elbow its way into the limelight.
The story on the daily timeframe reveals price action faded resistance at 1.0995 Friday and has since been starved of support, with Wednesday clocking lows at 1.0782 and highlighting possible support at a Quasimodo formation from 1.0768.
Areas of consideration:
1.08 offers little in terms of confluence, and H4 candle action displays a lack of passion from the bulls thus far. For that reason, longs from this region may be in for a rough time.
Breakout sellers south of 1.08 also have limited room to manoeuvre, having noted daily Quasimodo support resides at 1.0768. On that note, the combination of the daily Quasimodo support and H4 Quasimodo support from 1.0756 may test the will power of sellers should we reach this far south. We may, therefore, see trade attempt to claw back a portion of recent losses from here and offer intraday buyers a potential platform.
GBP/USD:
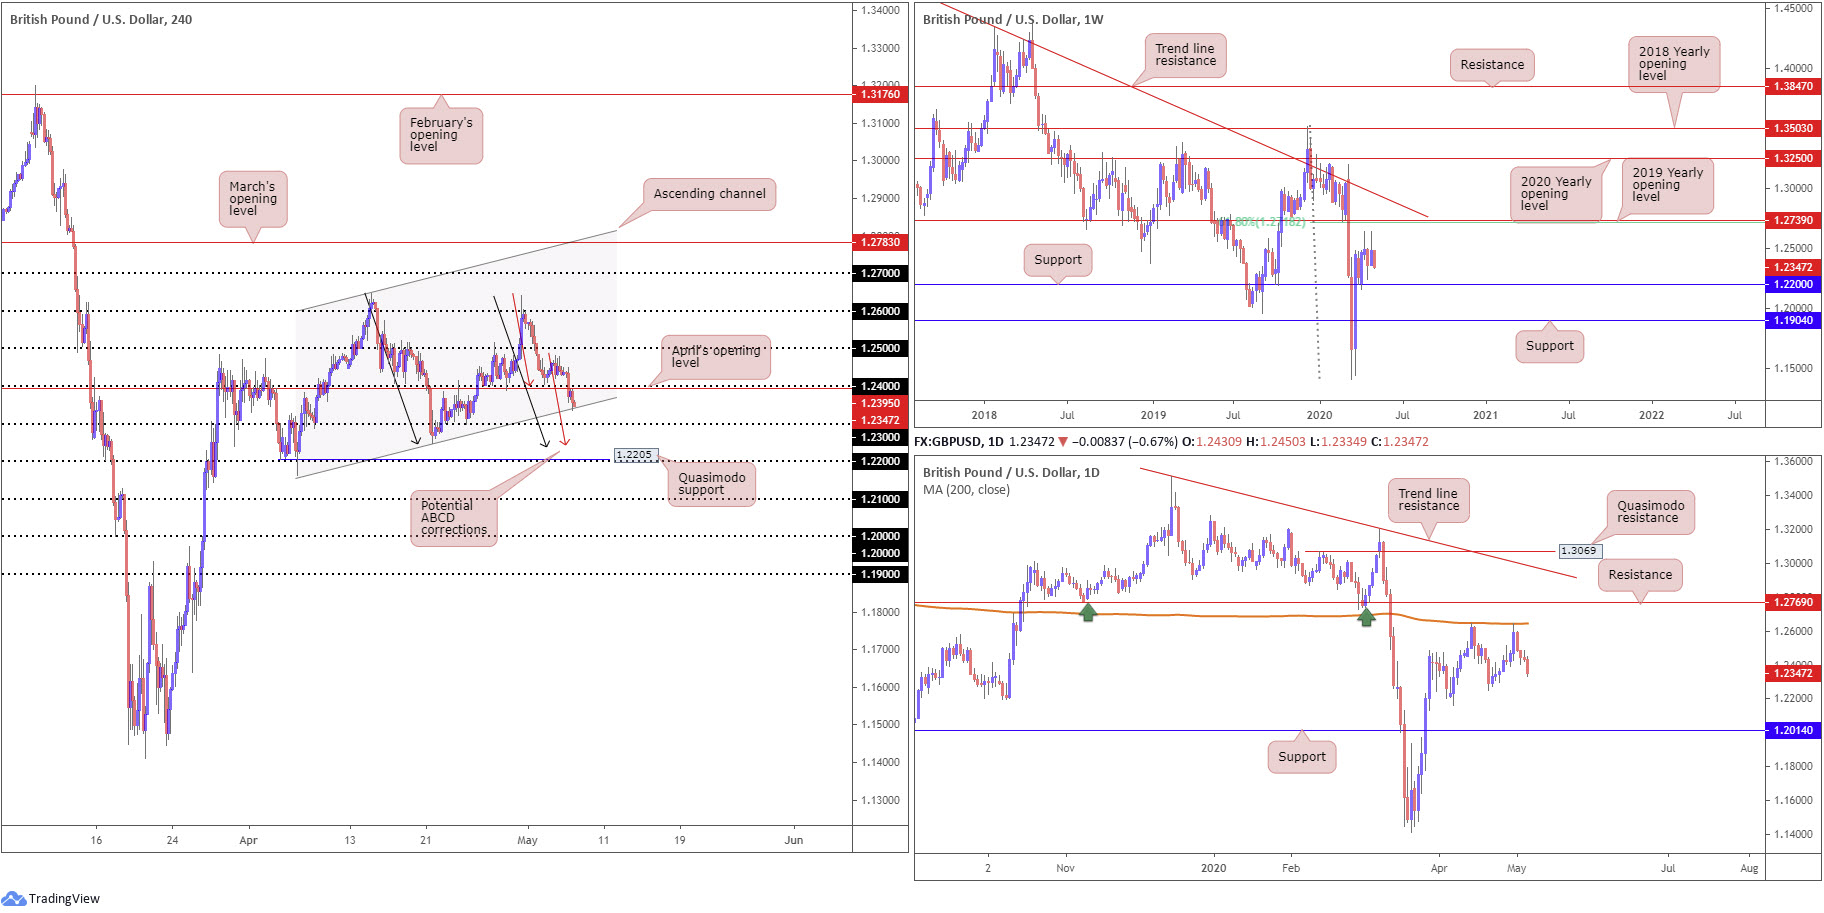
The British pound retained a heavy tone vs. the buck Wednesday, cementing its fourth consecutive losing session. Orders from 1.24 and April’s opening level at 1.2395 did little to turn the dial, with H4 movement reaching channel support, extended from the low 1.2163, shortly after. Technically speaking, it’s unlikely we’ll see the said channel support hold, given the 1.23 handle calling for attention just south of the base, along with a potential ABCD correction (red arrows) point at 1.2240 and a Quasimodo support at 1.2205. In addition, traders may also note another (larger) potential ABCD correction point (black arrows) at 1.2240.
From the weekly timeframe, support at 1.2200 remains a pivotal base, holding price action higher since the beginning of April. Scope to explore higher ground is also visible until reaching the 2019 yearly opening level at 1.2739, which aligns closely with a 61.8% Fibonacci retracement ratio at 1.2718. A break of the aforementioned levels reveals a long-standing trend line resistance, taken from the high 1.5930. Additionally, we can also see the pair pulling back from historic lows at 1.1409, therefore sellers could eventually make a run for fresh lows. Note the primary trend remains facing south in this market.
The 200-day SMA (orange – 1.2645) remains a dominant fixture on the daily timeframe, providing resistance on two occasions in April. Support is expected to form off the 1.2247 April 21 low. A break of this level, though, could confirm a possible double-top pattern from peaks around 1.2639.
Areas of consideration:
All three timeframes indicate we may navigate lower today and possibly even Friday, despite the current channel support on the H4 timeframe and 1.23 handle.
1.22 is likely to act as a magnet as a downside target, having seen it converge not only with a number of H4 structures, but also weekly support as well.
Selling the break beneath H4 channel support is an option, as is breakout selling sub 1.23. Hitting 1.22ish will likely entice an unwinding of short positions, followed by a recovery.
AUD/USD:
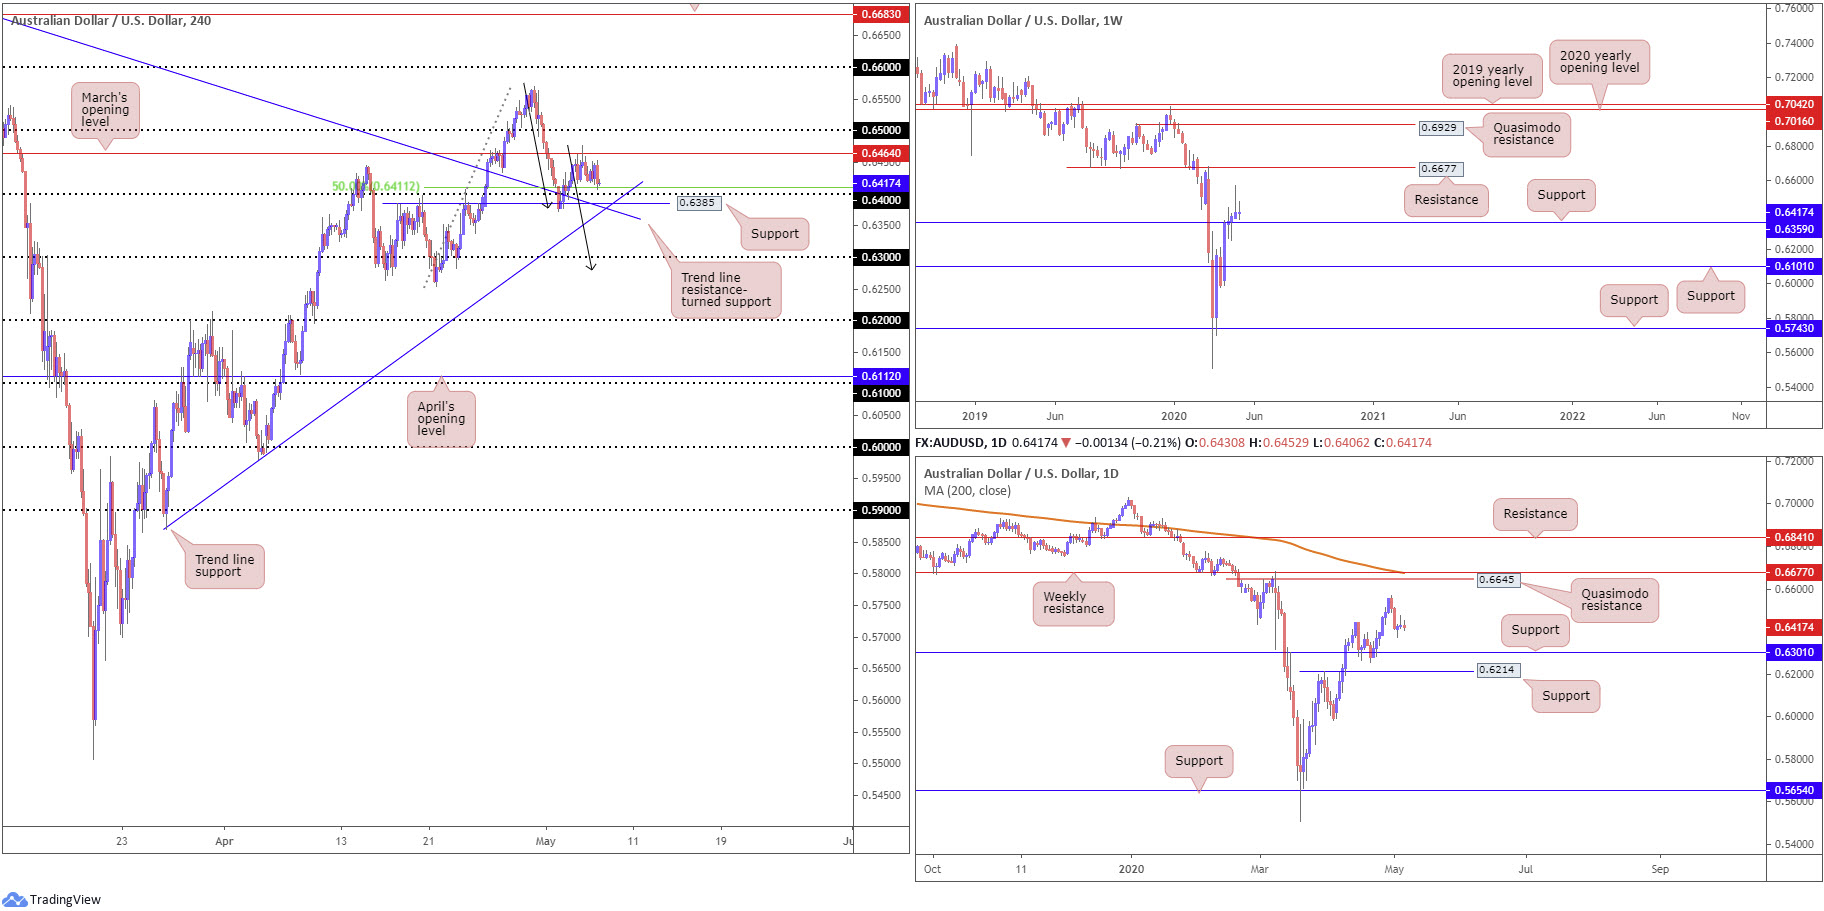
As USD buyers continue to strengthen their grip, on top of mounting concerns surrounding the US/China relationship, AUD/USD eked out modest losses Wednesday.
March’s opening level on the H4 timeframe at 0.6464 maintained position, guiding the candles back to within striking distance of the 0.64 handle. 0.64 also comes together with a notable trend line resistance-turned support, taken from the high 0.7031, a Quasimodo resistance-turned support at 0.6385, a 50.0% retracement value at 0.6411 and another trend line support (etched from the low 0.5870. South of the said structures boasts limited support until crossing swords with the 0.63 handle, which also represents daily support at 0.6301 (the next downside target on that scale). Breaking lower may also imply the completion of an ABCD correction at 0.6277 (black arrows).
The technical story on the weekly timeframe has price circling above support at 0.6359 in the shape of a doji indecision candle, following last week’s shooting star candlestick configuration. Although last week’s candlestick signal is a mark of seller intent, price is finding difficulty attracting sellers due to noted support. With that being the case, pencilling in resistance at 0.6677 may be an idea in the event we pop higher.
From the daily timeframe, support at 0.6301 may eventually come under fire, with support at 0.6214 also perhaps entering the mix. With respect to resistance, aside from the April 30 high at 0.6569, a Quasimodo formation at 0.6645 is in sight, parked just ahead of the weekly resistance level mentioned above at 0.6677 and the 200-day SMA (orange – 0.6675).
Areas of consideration:
Today’s technical spotlight is focused on 0.64 as potential support, having noted the H4 confluence surrounding the psychological level. Traders are also urged to pencil in the possibility of a fakeout through 0.64 to bring in the noted H4 trend line supports before turning higher. Upside targets from 0.64, nonetheless, remain at 0.6464, closely shadowed by 0.65.
USD/JPY:
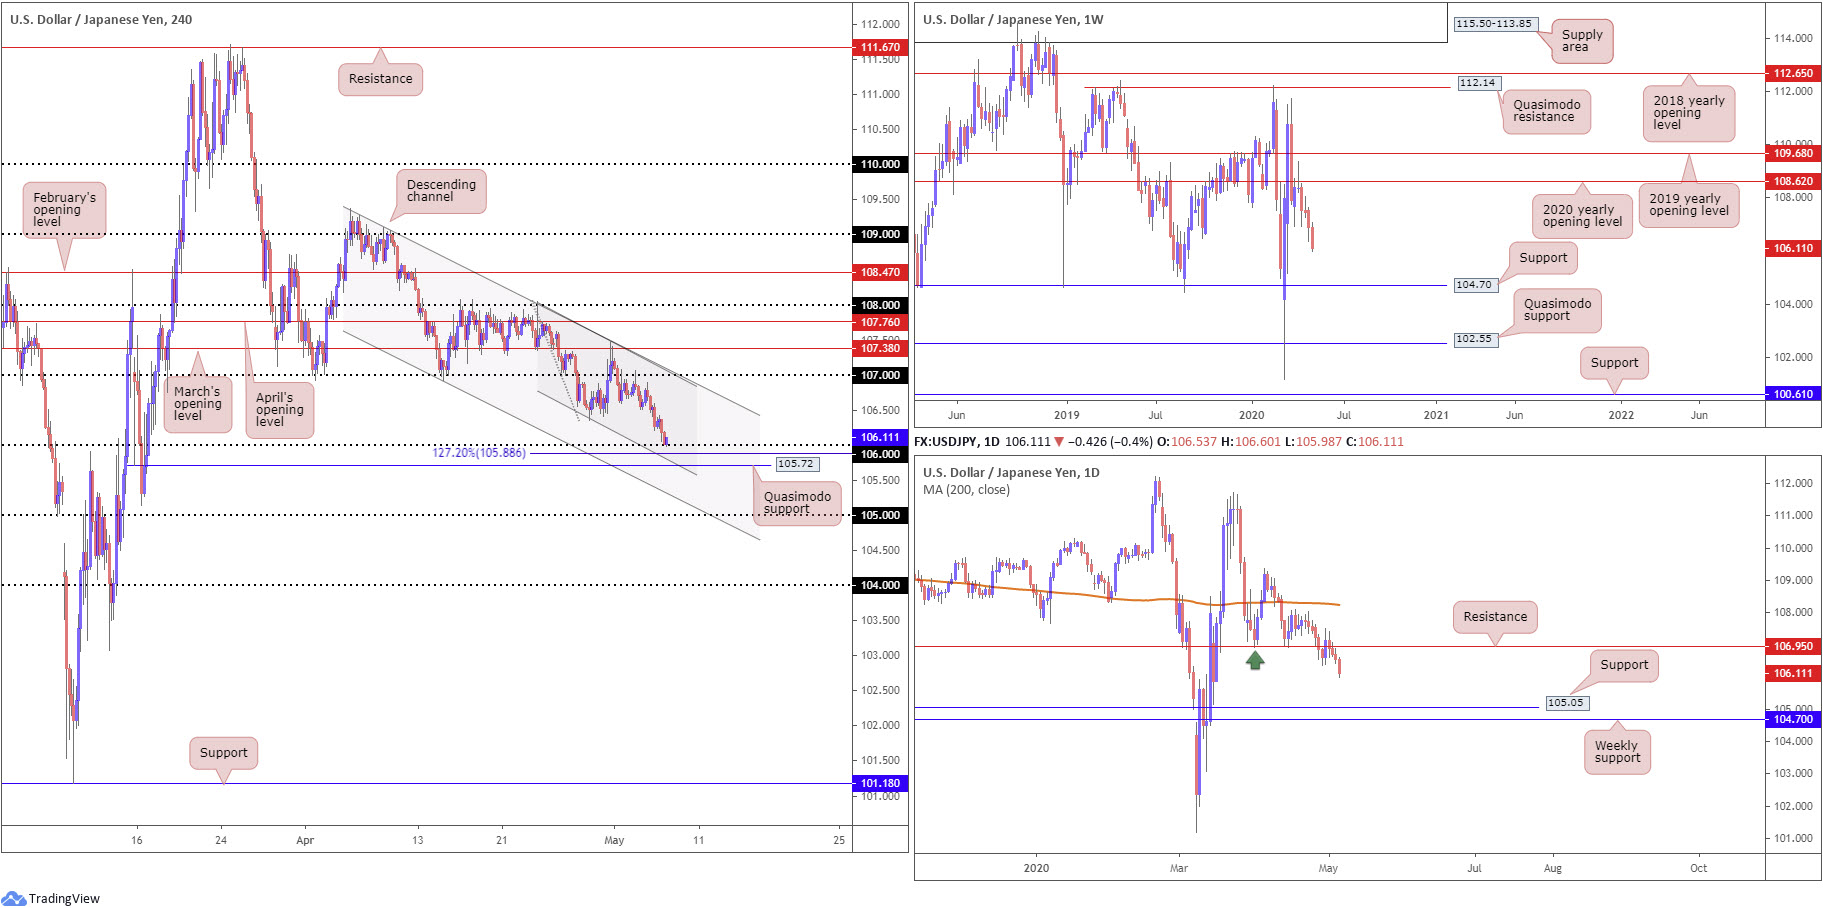
Buyers took a back seat Wednesday as USD/JPY chalked up its fourth consecutive losing session, unmoved by the US dollar index firming north of 100.00. In recent hours, 106 nudged into view, which may attract short-covering. H4 movement is also entrenched within two descending channel patterns. The larger of the two is formed between 109.38/106.92 with the local version sitting between 108.04/106.35. Sub 106, traders will note the presence of a 127.2% Fibonacci extension at 105.88, local channel support and Quasimodo support at 105.72.
The weekly timeframe continues to emphasise a bearish tone south of the 2020 yearly opening level at 108.62. Last week, as you can see, extended losses to lows of 106.35, with support not expected to emerge until reaching 104.70.
Resistance at 106.95 maintains a presence on the daily timeframe.106.95 boasts notable history, therefore moves south of the base could see an approach form to support at 105.05. Additional resistance is not seen on this timeframe until reaching the 200-day SMA (orange – 108.24).
Areas of consideration:
A fakeout through orders at 106 to Quasimodo support at 105.72 is a scenario worth underlining. A whipsaw through 106 followed up with a H4 close north of the round number could signal buyers want to take things higher and fill the local descending channel.
However, this would unfortunately entail going up against daily and weekly directional flow.
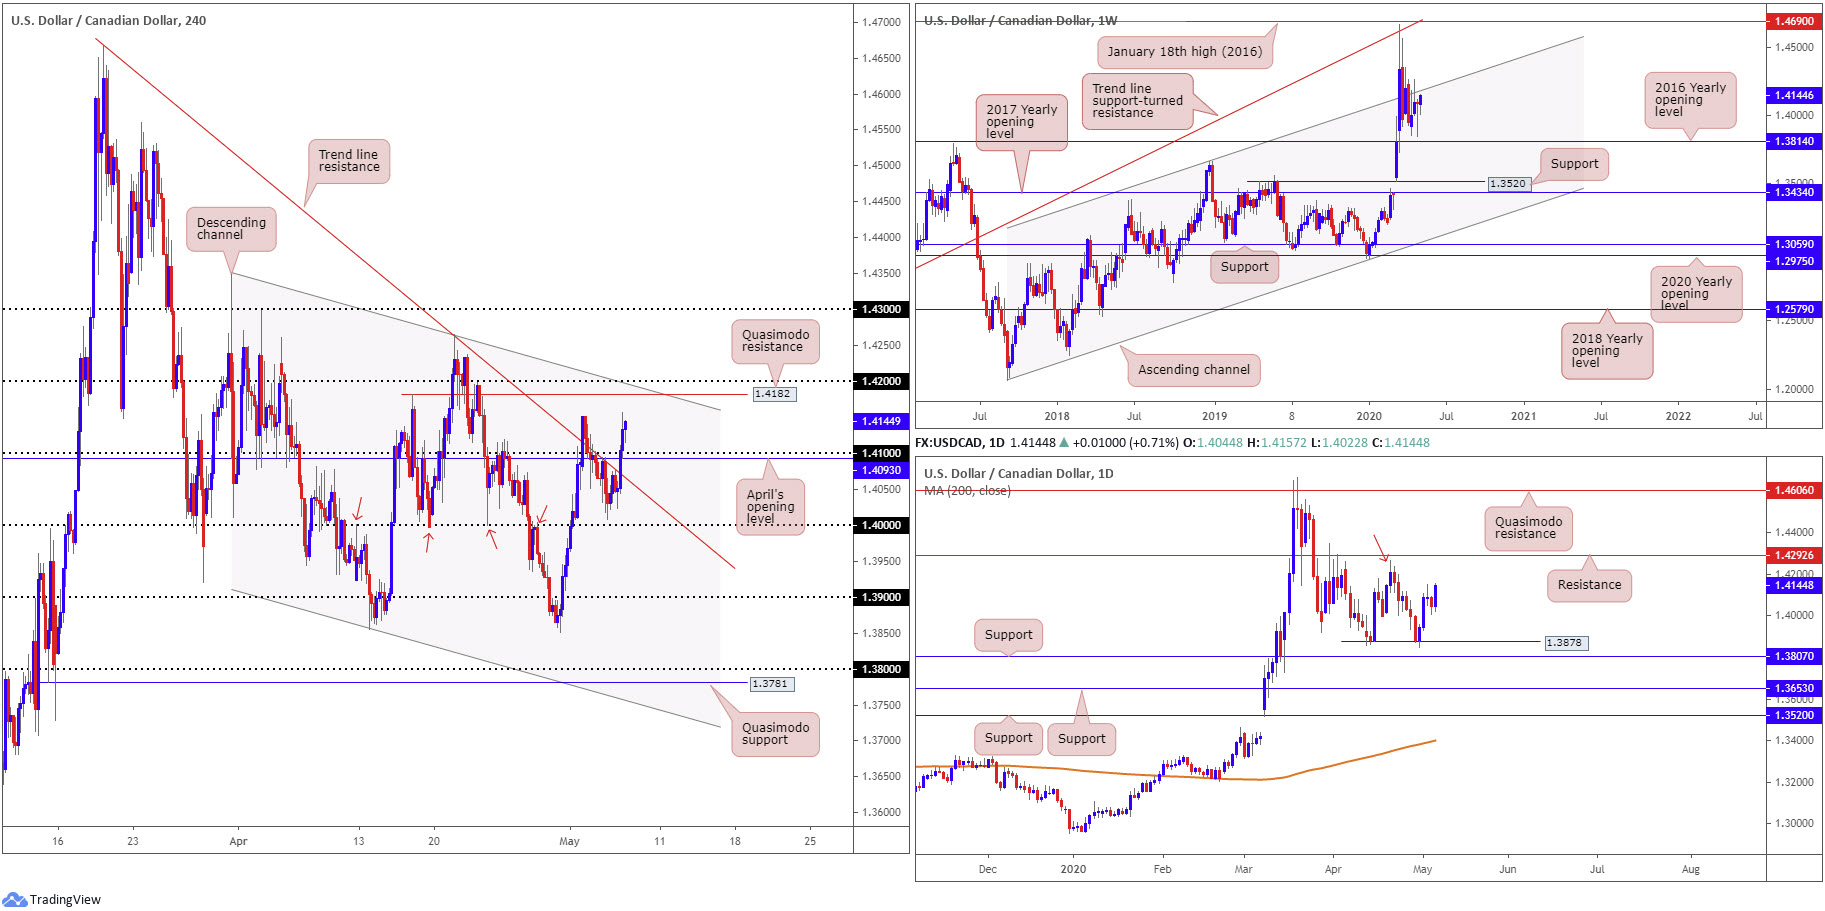
USD/CAD:
A pullback in WTI prices, one which snapped a six-day bullish phase, and the US dollar index regaining a footing above 100.00, sent USD/CAD above a number of key H4 technical resistances Wednesday, including a trend line formation from 1.4667 and the 1.41 handle.
This positions H4 Quasimodo resistance at 1.4182 in sight, closely followed by channel resistance, extended from the high 1.4349 and the round number 1.42, as well as a long-term channel resistance, etched from the high 1.3661, on the weekly timeframe.
Price action on the daily timeframe is close to confirming a double-bottom support at 1.3878. Traditional interpretation would have the peak at 1.4265 engulfed (red arrow) before confirming the formation. This would also entail overturning resistance at 1.4292.
Areas of consideration:
Should we continue to push higher today and overthrow the 1.4152 May 3 high, H4 Quasimodo resistance at 1.4182 will likely make a show. Not only does 1.4182 come with H4 confluence, the noted weekly channel resistance also intersects with the H4 levels; this is enough to likely tempt sellers into the fight.
Conservative sellers will likely seek additional candlestick confirmation before committing, while aggressive traders may feel positioning protective stop-loss orders above the H4 channel resistance could be sufficient.
A pullback from 1.4182 may draw 1.41 back into the fold, sited just ahead of April’s opening level at 1.4093.
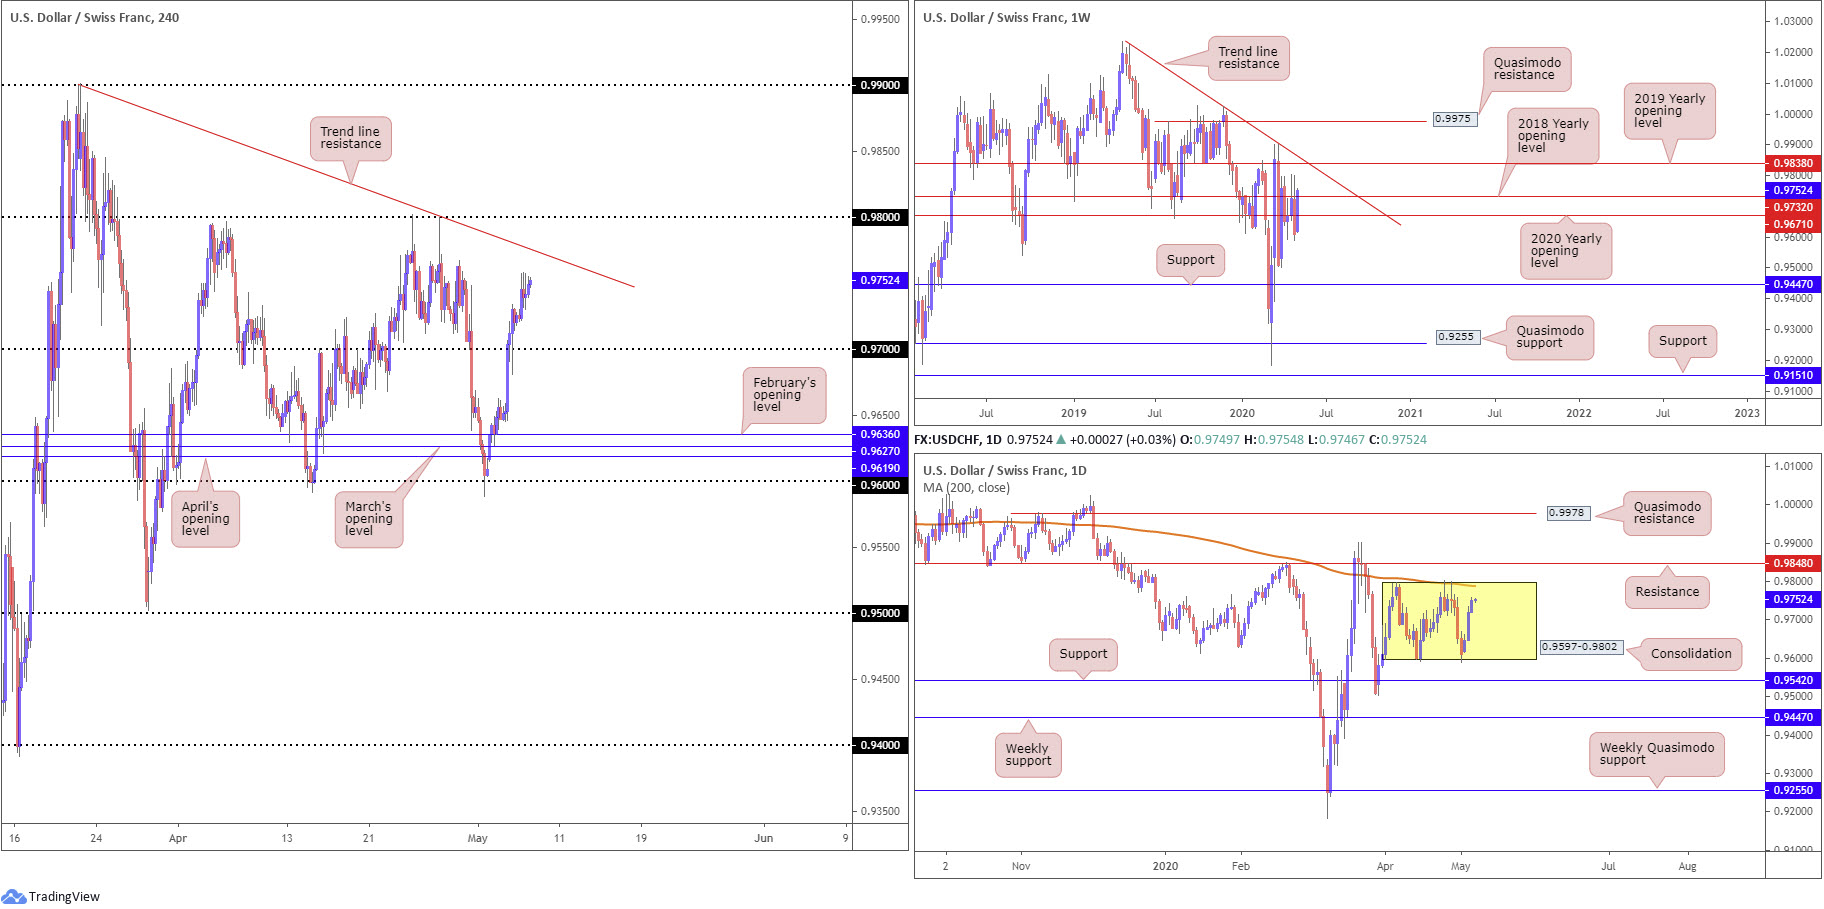
USD/CHF:
The US dollar built on recovery gains Wednesday, sending the Swiss franc lower for a third consecutive session.
0.97 is all but a distant memory at this point, with H4 trend line resistance, extended from the high 0.9900, on the horizon today, followed by the 0.98 handle. Space above 0.98 appears relatively unrestricted until shaking hands with 0.99.
Interestingly, movement based on the daily timeframe shows price closing in on the upper boundary of a month-long range between 0.9597-0.9802. Note the 200-day SMA (orange – 0.9788) is also seen clinging to the upper edge of the said range. Outside of the area, we can see resistance forms at 0.9848 while support can be found at 0.9542.
Meanwhile, technical development on the weekly timeframe shows the pair lacks firepower off the 2018 yearly opening level at 0.9732 as a resistance. This throws light on a possible rally to trend line resistance, extended from the high 1.0226, along with the 2019 yearly opening level at 0.9838.
Areas of consideration:
Owing to daily price showing room to advance towards the upper edge of its range at 0.9802, which comes with a 200-day SMA value, the 0.98 handle on the H4 timeframe may spark interest today as resistance. This would, of course, entail overthrowing H4 trend line resistance. Additionally, any shorts from 0.98 will potentially be going against the tide as weekly flow points to 0.9838 as the next upside limit.
Owing to the above, a break of 0.98 may prompt intraday breakout buying, targeting 0.9838 on the weekly timeframe, closely trailed by daily resistance at 0.9848.
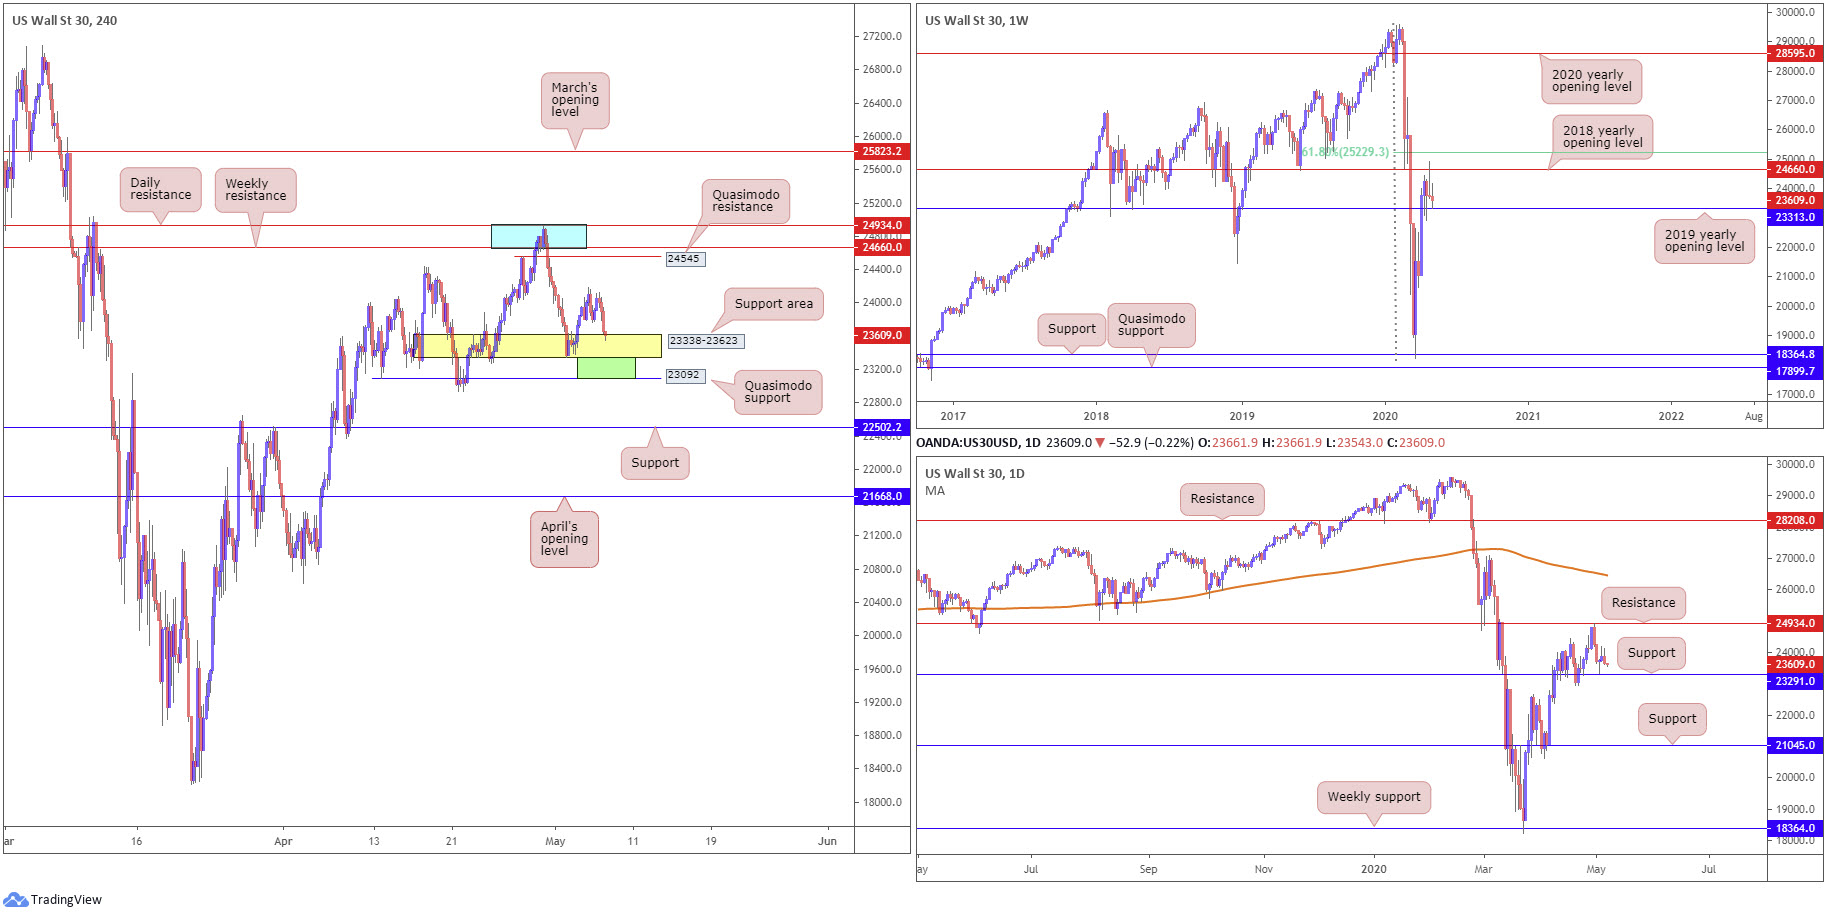
Dow Jones Industrial Average:
US equities wrapped up Wednesday mostly lower as investors digested another spike in joblessness. The Dow Jones Industrial Average erased 218.45 points, or 0.91%; the S&P 500 lost 20.02 points, or 0.70%, while the tech-heavy Nasdaq 100 concluded higher by 54.24 points, or 0.61%.
24934/24660, an area (blue) marked on the H4 timeframe that’s made up of daily resistance at 24934 and weekly resistance at 24660 (the 2018 yearly opening level), capped upside in recent trade.
Recent research went on to highlight the possibility of a reaction forming out of the H4 support area at 23338-23623, which, as you can see, has occurred. Upside, nonetheless, slackened yesterday, triggering a revisit to 23338-23623.
Technical action on the weekly timeframe bottomed just ahead of the 2019 yearly opening level at 23313 in recent trading, following last week’s rejection off the 2018 yearly opening level at 24660. From the daily timeframe, we can see price trading within touching distance of support at 23291.
Areas of consideration:
Traders short 24934/24660 have likely liquidated their position around the H4 support zone at 23338-23623.
In the event of a fakeout through the current H4 support area, we’re then dealing with both weekly and daily supports at 23313 and 23291, with the possibility of also bringing in neighbouring H4 Quasimodo support at 23092. The green base, then, could be an area another wave of buying materialises.
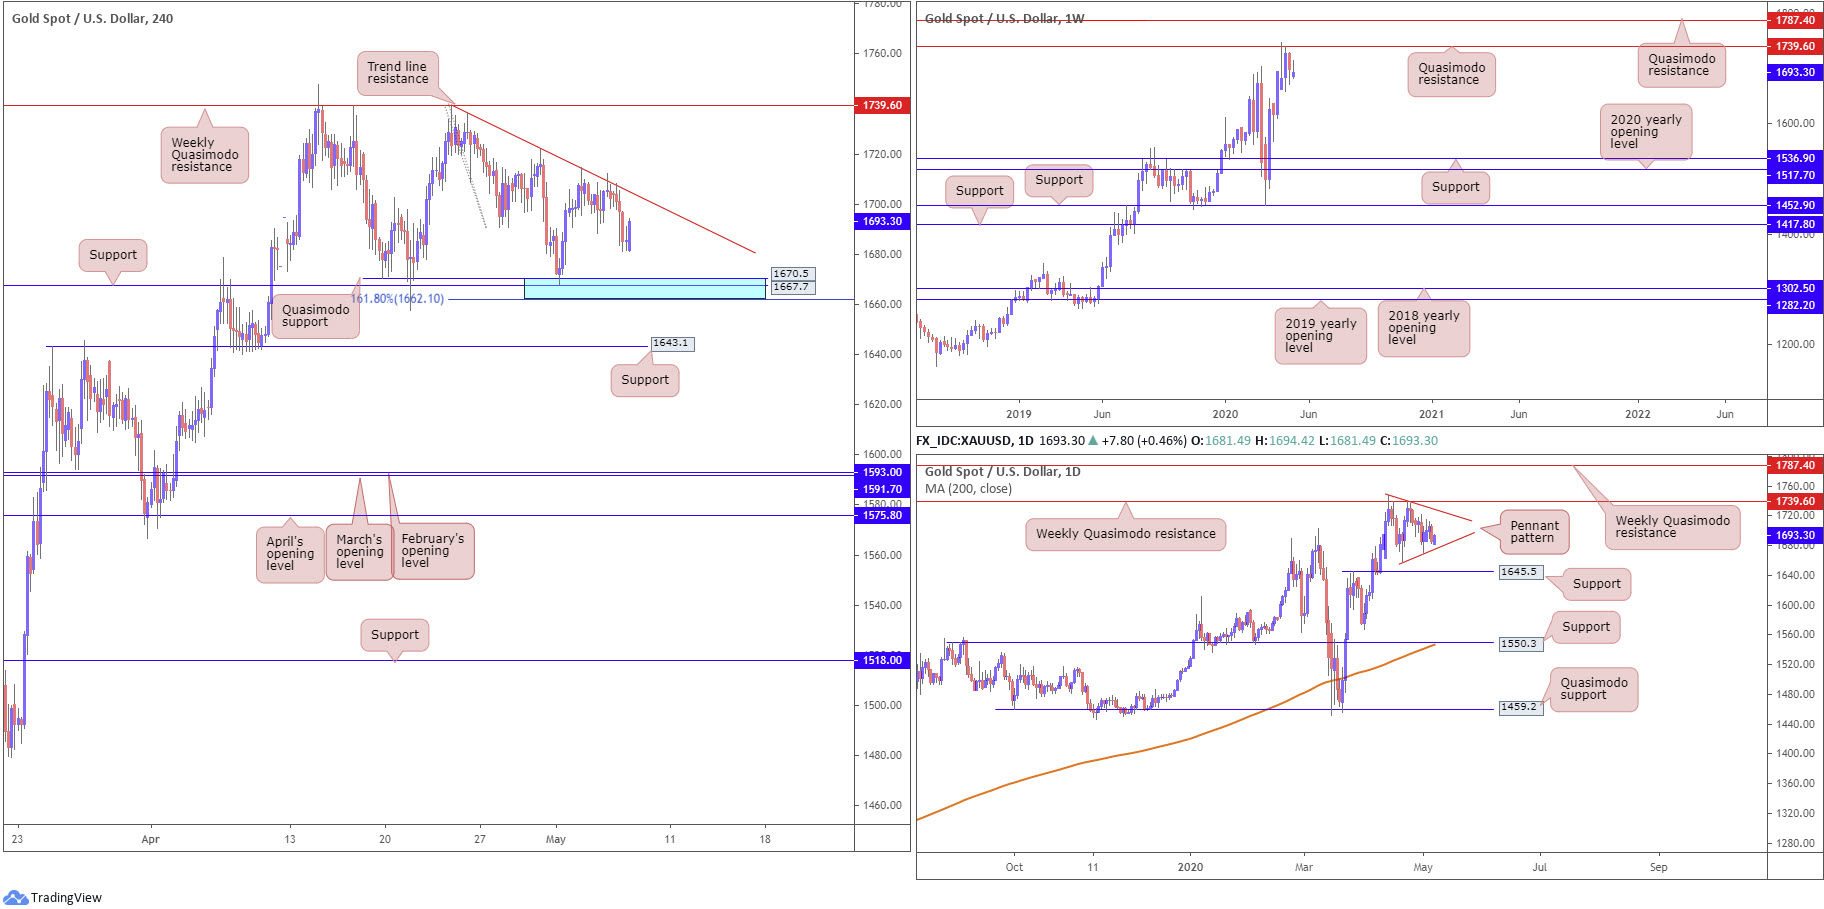
XAU/USD (GOLD):
Bullion trades off Wednesday’s lows against the buck in early trade Thursday, after having dipped from a peak of 1708.2, aided by increased USD demand and H4 trend line resistance, taken from the high 1739.1.
A push through trend line resistance today potentially sets the stage for a rally to weekly Quasimodo resistance at 1739.6. In terms of support, we have an area formed by way of a 161.8% Fibonacci extension point at 1662.1, support at 1667.7 and Quasimodo support at 1670.5 (blue) in sight.
Further afield on the higher timeframes, we can see buyers and sellers squaring off around the underside of a weekly Quasimodo resistance at 1739.6. Downside from this region echoes the possibility of reaching support at 1536.9, while a breach of 1739.6 shifts focus towards another layer of Quasimodo resistance at 1787.4. It may also interest some traders to note the primary trend on gold has faced a northerly trajectory since 2016.
In similar fashion to the weekly timeframe, the weekly Quasimodo formation at 1739.6 is also posted as prominent resistance on the daily chart. The difference can be seen with reference to supports: the next support target on the daily timeframe falls in at 1645.5. Pattern traders may also acknowledge a forming pennant pattern at the underside of the weekly Quasimodo base, created from a high of 1747.7 and a low of 1658.1.
Areas of consideration:
Intraday bulls are currently bidding yesterday’s dip. A H4 close north of the current H4 trend line may be interpreted as a signal to add to long positions, targeting weekly Quasimodo resistance at 1739.6.
As stated in Wednesday’s technical briefing:
Printing a H4 close above 1739.6 will likely see breakout buyers make a show, taking aim at weekly Quasimodo resistance from 1787.4. This would also likely seal a daily close above the upper boundary of the current daily pennant pattern, adding fuel to any upside.
The accuracy, completeness and timeliness of the information contained on this site cannot be guaranteed. IC Markets does not warranty, guarantee or make any representations, or assume any liability regarding financial results based on the use of the information in the site.
News, views, opinions, recommendations and other information obtained from sources outside of www.icmarkets.com.au, used in this site are believed to be reliable, but we cannot guarantee their accuracy or completeness. All such information is subject to change at any time without notice. IC Markets assumes no responsibility for the content of any linked site.
The fact that such links may exist does not indicate approval or endorsement of any material contained on any linked site. IC Markets is not liable for any harm caused by the transmission, through accessing the services or information on this site, of a computer virus, or other computer code or programming device that might be used to access, delete, damage, disable, disrupt or otherwise impede in any manner, the operation of the site or of any user’s software, hardware, data or property.


