
EUR/USD:
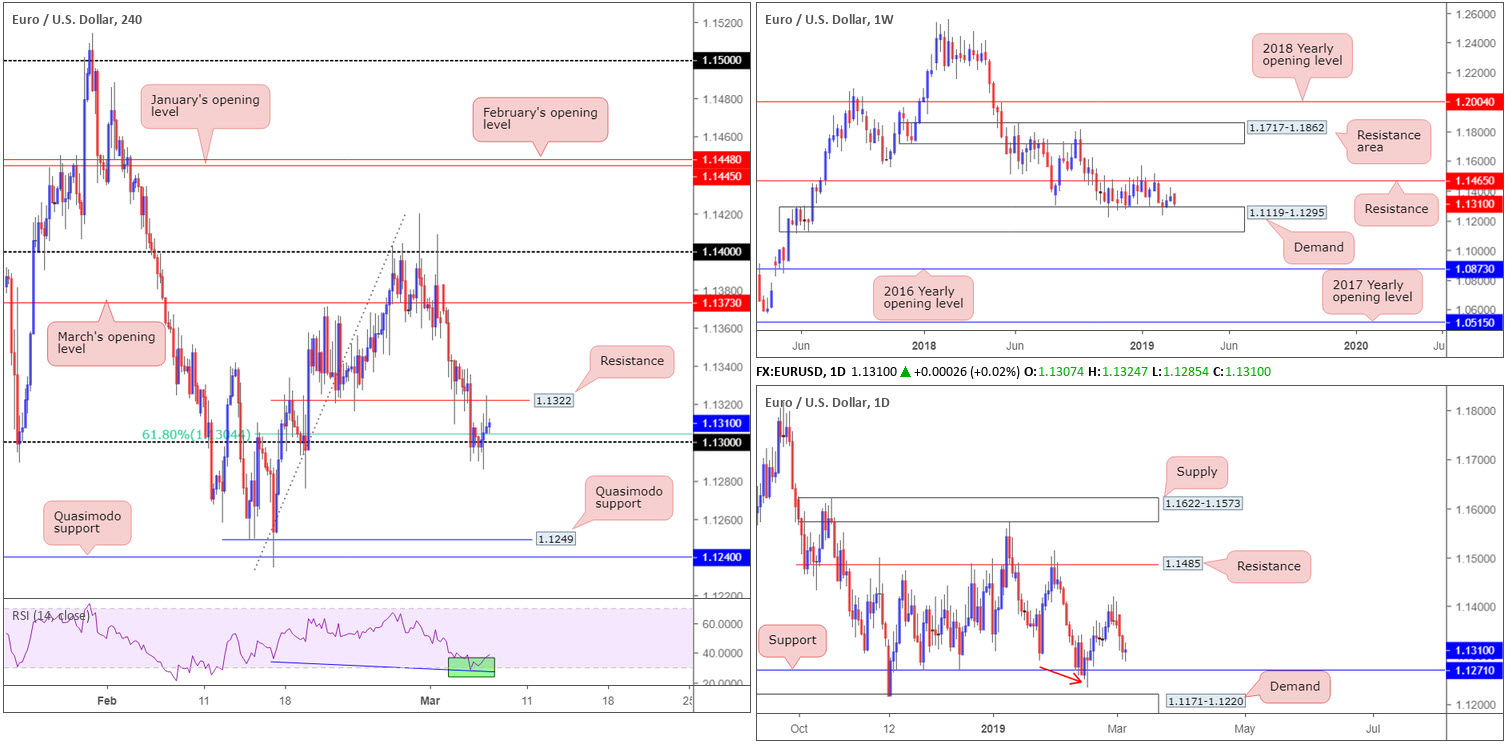
The top edge of weekly demand at 1.1119-1.1295 elbowed its way into the limelight in recent trade. Since October 2018, this demand and a long-standing support/resistance at 1.1465 have compressed price action into a tight range. Overall, though, the trend continues to face a southerly direction on the weekly timeframe, with the possibility of a subsequent lower low forming in the future.
The story on the daily timeframe shows the unit has support at 1.1271 in view. Concerning trend structure, however, the chart demonstrates potential to push beyond the noted support (given the recent lower low at 1.1234 [red arrow]), possibly into the walls of demand plotted at 1.1171-1.1220.
Across on the H4 timeframe, 1.13 remains supportive, as does the 61.8% Fibonacci at 1.1304. Note a few pips sub 1.13, 1.1295 – the top edge of the current weekly demand area – is also in play. Nearby resistance at 1.1322 also appears defensive, capping upside amid early US trading Wednesday. What’s also notable is the H4 RSI indicator seen displaying an oversold/divergence reading (green).
On the data front, US ADP non-farm employment change increased by 183,000 from January to February (on a seasonally adjusted basis), missing market consensus of 190,000.
Areas of consideration:
The 1.13 handle, as underlined in Tuesday’s analysis, is an area buyers clearly have an interest in. As a reminder, 1.13 converges closely with a 61.8% H4 Fibonacci mentioned above at 1.1304, and is further bolstered by the top edge of weekly demand at 1.1295.
A long from 1.13 would, according to our technical studies, have an initial upside target of 1.1373 (March’s opening level), though clearing 1.1322 is the first port of call, and possibly a cue to consider reducing risk to breakeven.
In regards to entry, the research team felt 1.1295 was high probability, with a stop-loss placement at 1.1274 (beneath the 1.1276 Feb 19 low). Well done to any of our readers who remain long from here as price is, at the time of writing, in profit and poised to potentially challenge 1.1322 for a second time.
Today’s data points: ECB Main Refinancing Rate and Monetary Policy Statement; ECB Press Conference; FOMC Member Brainard Speaks.
GBP/USD:
After shaking hands with 1.31 Tuesday, Wednesday’s sessions observed a resurgence of GBP bidding off session lows at 1.3124. In the event further buying is seen on the H4 timeframe, the completion of an AB=CD bearish pattern (black arrows) may come to fruition a few pips north of 1.32. What’s also interesting here is the fusing 38.2% Fibonacci resistance value at 1.3197. According to this timeframe’s confluence, a sell from here is reasonably high probability.
The outlook on the weekly timeframe supports 1.32 as a potential sell zone today, as the pair continues to engage with the lower edge of supply pictured at 1.3472-1.3204 (positioned just south of the 2018 yearly opening level at 1.3503). The only grumble to a short in this market, however, apart from the fact the pair is entrenched within a relatively strong uptrend at the moment, is daily price responding from a 38.2% Fibonacci support value at 1.3134, which is considered the first take-profit target for those short the ABCD bearish pattern (black arrows)/Quasimodo resistance at 1.3315.
Areas of consideration:
Although not a perfect setup, 1.32 on the H4 timeframe is an appealing resistance today. For traders concerned regarding the threat of daily buying or a fakeout through the psychological mark, waiting for additional confirmation to form before pulling the trigger is an option. A H4 bearish candlestick pattern formed off 1.32 (entry and risk levels can be defined according to the candle’s structure), for example, is likely enough to entice sellers into the market, targeting 1.3134 (the daily 38.2% Fibonacci support) as an initial take-profit zone.
Today’s data points: MPC Member Tenreyro Speaks; FOMC Member Brainard Speaks.

AUD/USD:
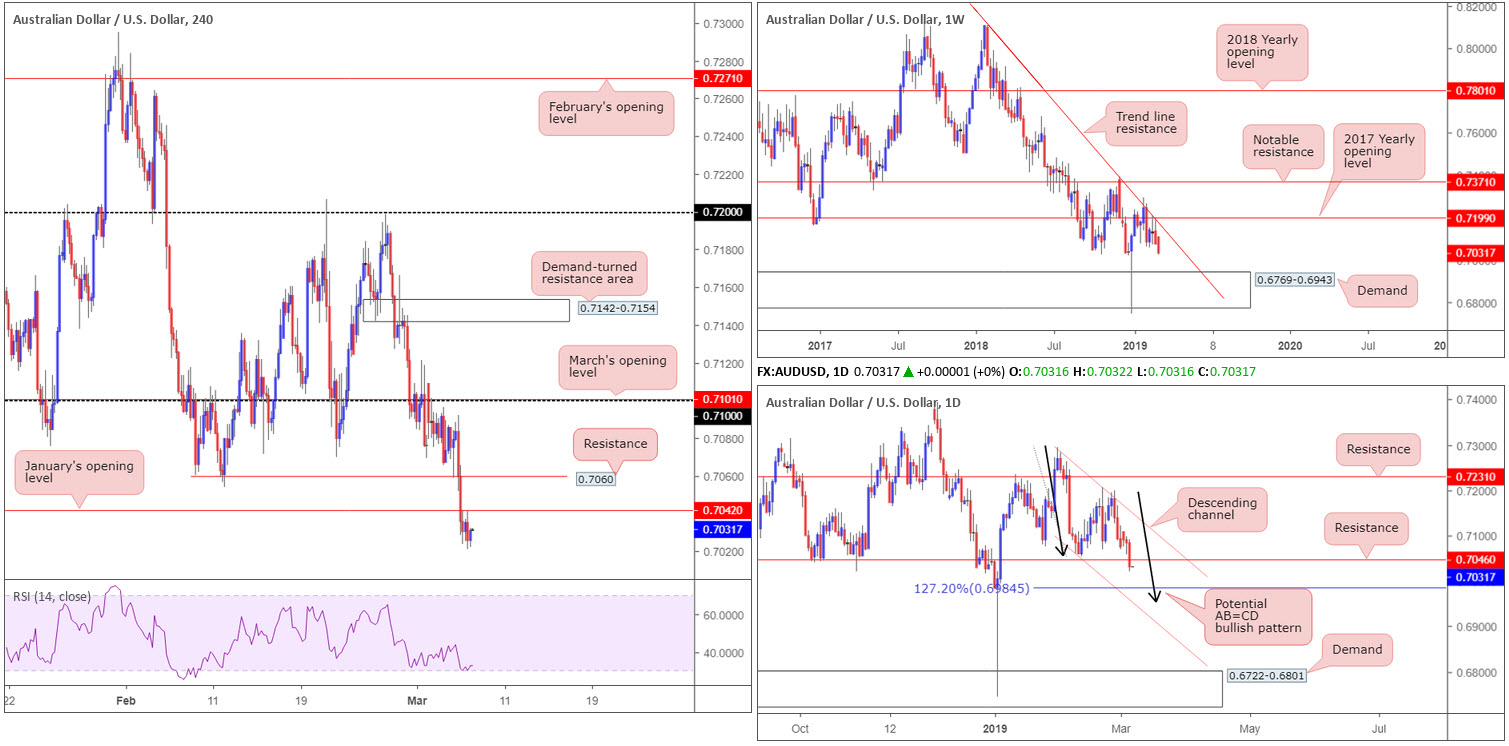
The Australian economy grew by 0.2% in seasonally adjusted chain volume terms in the December quarter, missing a consensus reading of 0.5%. The after-effects witnessed the commodity-linked currency cede ground against its US counterpart Wednesday, consuming H4 support at 0.7060 (now acting resistance). Selling came to a pause following a break of January’s opening level at 0.7042, which, for the time being, is being used as resistance.
The next area of interest to the downside on the H4 scale falls in around the key figure 0.70 (not seen on the screen). On a wider perspective, nonetheless, the technicals exhibit scope to explore ground beyond 0.70.
Weekly flow is contained by the 2017 yearly opening level at 0.7199 and merging trend line resistance (taken from the 2018 yearly high of 0.8135). This coupled with downside displaying room to press as far south as demand at 0.6769-0.6943 on this timeframe, sellers appear to have the upper hand this week.
Daily action remains compressing within a descending channel (0.7295/0.7060) and, thanks to yesterday’s selloff, engulfed notable support at 0.7046 (now acting resistance). This level boasts reasonably clean history dating as far back as late August 2015. The next downside objective can be seen around an AB=CD (black arrows) 127.2% bullish completion point at 0.6984.
Areas of consideration:
Having seen the rejection off the underside of January’s opening level at 0.7042 take shape in the form of a H4 bearish engulfing candle, a sell (with stop-loss orders tucked above its wick – 0.7042), targeting 0.70, is an option today.
With the key figure 0.70 being a widely watched barrier, and having noted a daily 127.2% Fibonacci ext. point fixed 15 pips beneath the level at 0.6984, a correction out of this range is also a possible play to keep eyeballs on (stop-loss orders can be positioned a couple of pips beneath 0.6984).
Today’s data points: FOMC Member Brainard Speaks.
USD/JPY:
USD/JPY prices are little changed this morning (-0.10%), despite US equities exploring lower ground. In view of this, much of the following piece will echo thoughts put forward in Wednesday’s outlook.
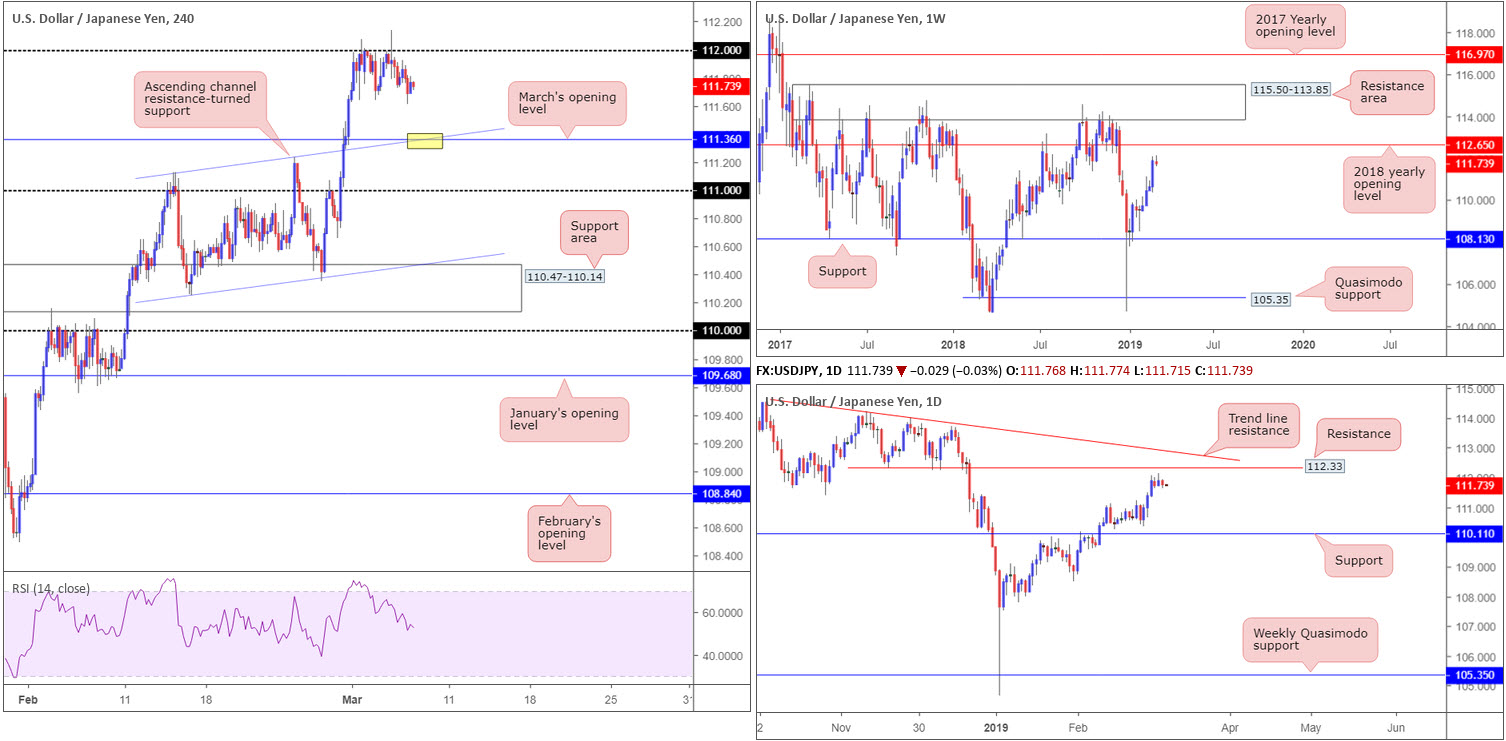
The H4 candles, as you can see, remain capped by 112 as resistance. Assuming further selling takes form today, price is likely to shake hands with March’s opening level drawn from 111.36 – links closely with an ascending channel resistance-turned support (taken from the high 111.12).
Pivotal resistance at 112.65 (the 2018 yearly opening level) is seen on the weekly timeframe, demonstrating this market still has room to advance. The story on the daily timeframe, however, shows price consolidating south of resistance pencilled in at 112.33, followed by trend line resistance extended from the high 114.23.
Areas of consideration:
On account of the above reading, there’s a chance the market may observe sellers push lower from 112 and possibly bring the H4 candles towards March’s opening level at 111.36. This barrier, particularly at the point the channel support merges with the level (yellow), is an interesting buy zone given we have room to move higher on the weekly timeframe to at least 112.65. Without seeing the H4 approach, though, it is difficult to pin down an initial target zone.
For traders wishing for a little more confirmation out of 111.36, waiting for a H4 bullish candlestick formation to come about is an option. Not only will the candlestick signal identify buyer intent, it’ll serve as a guide for entry and risk levels.
Today’s data points: FOMC Member Brainard Speaks.
USD/CAD:
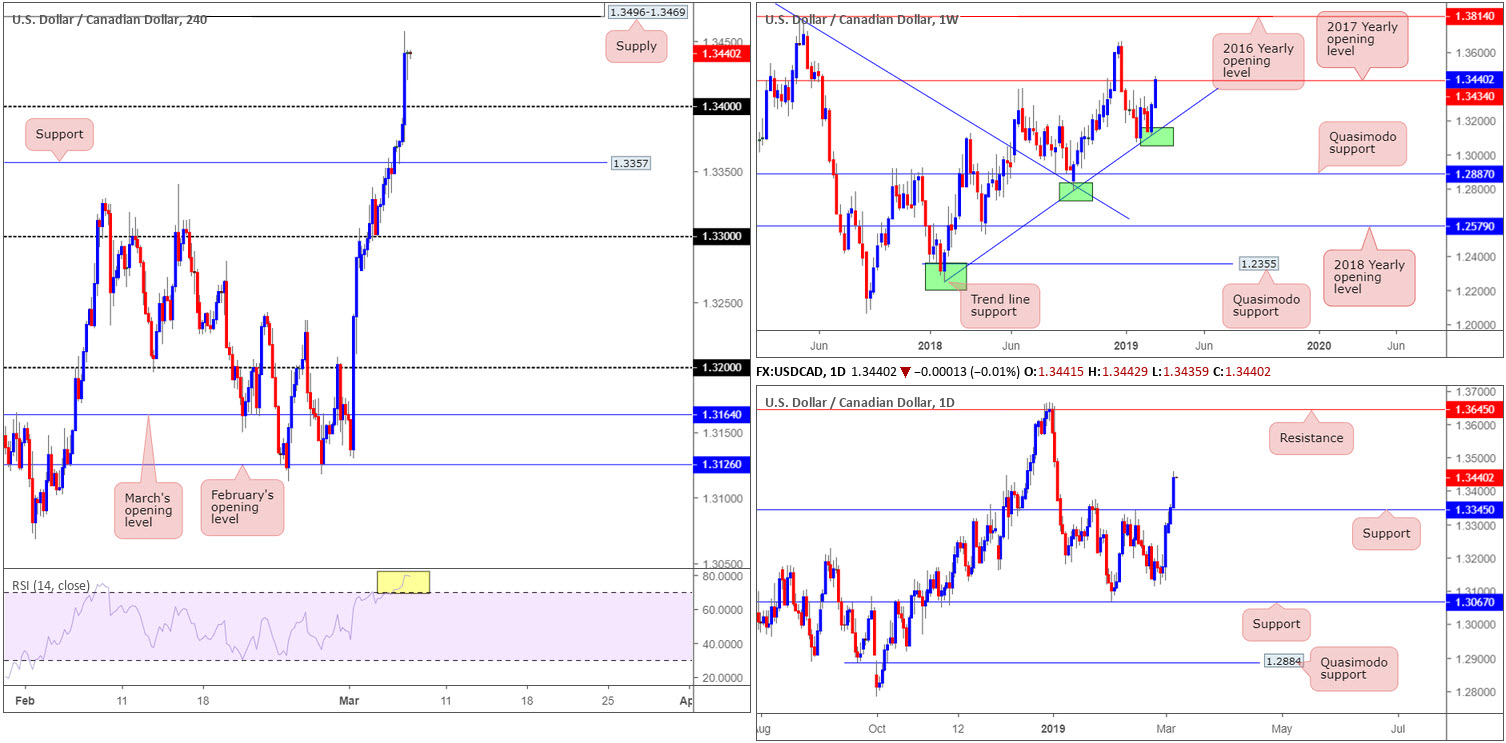
The Bank of Canada maintained its target for the overnight rate at 1 ¾ per cent Wednesday. In its policy statement, the central bank acknowledged the slowdown in the global economy has been more pronounced and widespread than previously forecast in its January Monetary Policy Report.
The release sent the USD/CAD surging higher, consequently reclaiming 1.34+ status on the H4 and exposing a potential area of supply coming in at 1.3496-1.3469. Initial thoughts were a potential retest play off 1.34, though having observed weekly price touching gloves with the underside of the 2017 yearly opening level at 1.3434, strong sellers may enter the fold. Contrary to this, nevertheless, daily price recently crossed above resistance at 1.3345 (now acting support), potentially setting the stage for a run towards resistance priced in at 1.3645.
Areas of consideration:
According to our technical studies, a correction lower from the H4 supply area mentioned above at 1.3496-1.3469 is possible, knowing we’re coming from weekly resistance at 1.3434. It might also be worth taking into account the H4 RSI indicator is seen displaying a strong overbought reading (yellow).
Why only a correction and not a reversal out of 1.3496-1.3469 comes down to the fact the market is entrenched within a long-term uptrend (see weekly chart), alongside daily flow demonstrating room to push beyond the aforesaid H4 supply area.
For conservative traders, waiting and seeing how H4 action behaves before pulling the trigger from 1.3496-1.3469 is certainly an idea. Each trader has their own method of confirming areas, though a simple approach here might be a H4 bearish candlestick signal, whereby entry and risk levels can be defined according to this structure.
Today’s data points: FOMC Member Brainard Speaks.
USD/CHF:
USD/CHF maintained a somewhat sedated presence Wednesday (+0.09%). In this light, much of the following report will offer a similar outlook to the one proposed yesterday.
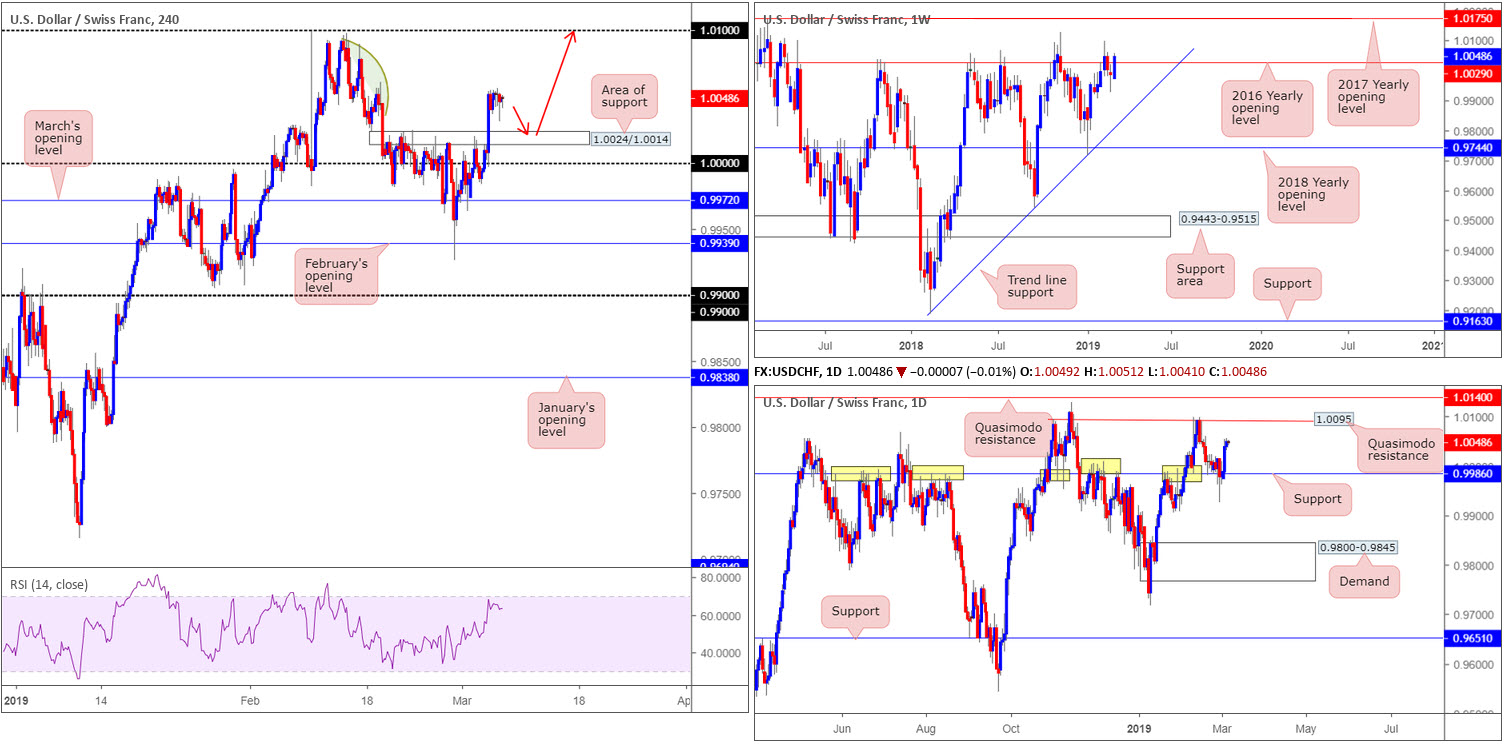
Broad-based USD bidding benefitted the USD/CHF Tuesday, following a retest of 1.0000 (parity) on the H4 timeframe. Price, as you can see, responded from this number with strength, consequently clearing orders from a resistance area at 1.0024/1.0014 (now acting support zone) and reaching highs of 1.0054. The green arc pattern to the left is resembles mildly consumed supply, and highlights the 1.01 handle as the next clear resistance level on the H4 timeframe. A retest of 1.0024/1.0014 as support, therefore, is certainly a possibility today, targeting 1.01.
In conjunction with H4 price, daily activity demonstrates scope to press as far north as Quasimodo resistance at 1.0095, after notable support at 0.9986 survived its latest challenge. 1.0095 held price action lower once already mid-February, therefore it is not a barrier to overlook.
The vibe on the weekly timeframe, nonetheless, is mixed at the moment. Price action continues to flirt with its 2016 yearly opening level at 1.0029, though appears to be struggling to push lower. As highlighted in the previous weekly briefing, 1.0029’s history as a resistance – dating as far back as February 2016 – still has the potential to draw in sellers.
Areas of consideration:
In light of daily price showing room to move as high as 1.0095 as well as H4 price also favouring a move towards its 1.01 handle, a retest of 1.0024/1.0014 is worthy of interest. Given the threat of possible selling out of the weekly timeframe, however, traders may want to consider waiting for H4 price to print an additional bullish candlestick signal. That way, not only have you identified buyer intent, you also have clear structure to base entry and risk levels from.
Today’s data points: FOMC Member Brainard Speaks.
Dow Jones Industrial Average:
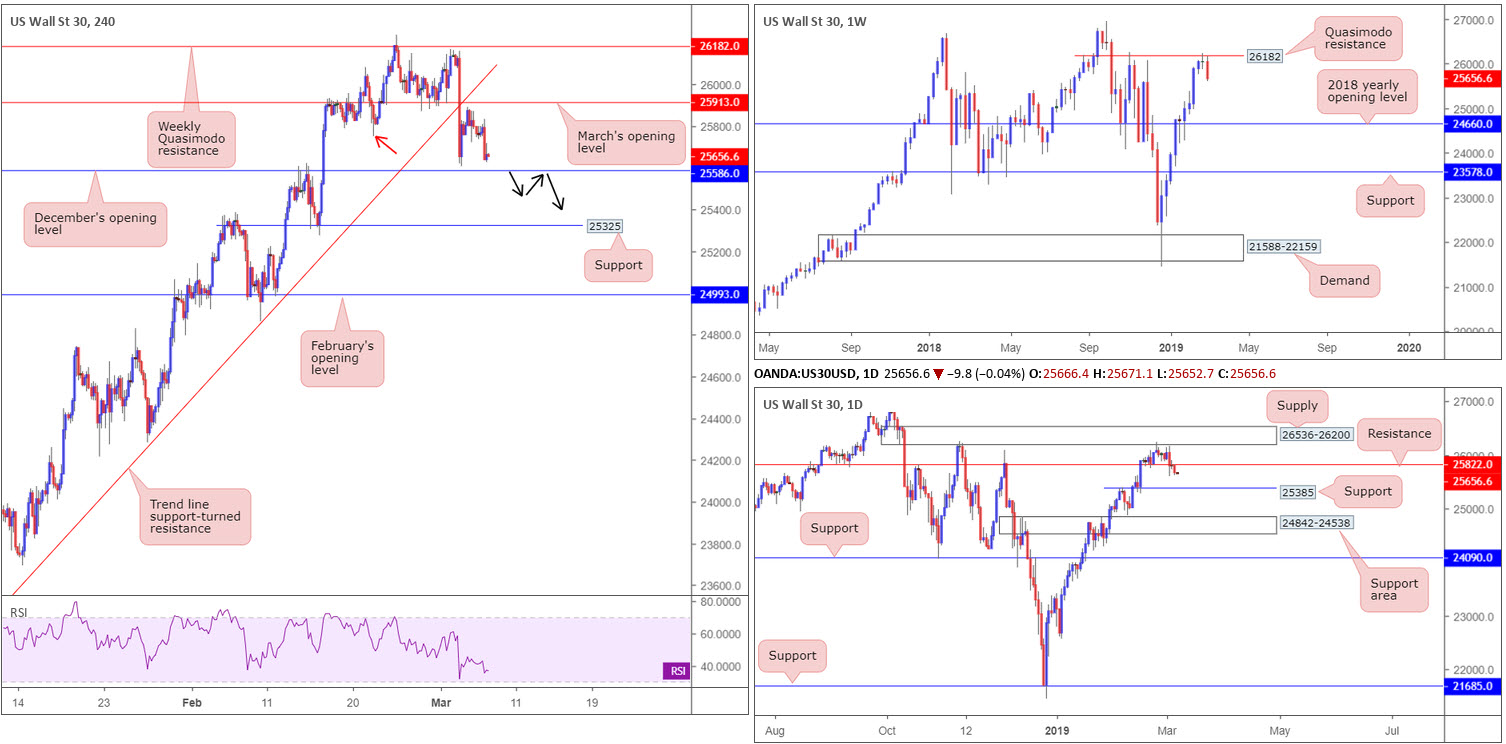
Kicking off from the top this morning, the weekly Quasimodo resistance parked at 26182 is thus far testing buyers, who, aside from a couple of indecisive weeks, have been bidding the index north since bottoming at 21452. Additional selling on this timeframe has the 2018 yearly opening level at 24660 to target.
As a consequence to recent selling, daily support at 25822 (now acting resistance) was overthrown, leaving nearby support priced at 25385 exposed. H4 action, on the other hand, settled for the day a few points north of December’s opening level at 25586. Beyond here, eyes are likely on support drawn from 25325.
Areas of consideration:
Despite weekly flow suggesting lower prices, and daily action shining its torch on support at 25385 as its next downside target, selling on the H4 scale means tackling potential buyers from December’s opening level at 25586.
Intraday sellers, however, may be interested in the space beneath 25586. A H4 close beyond here that’s followed up with a retest (preferably in the shape of a H1/H4 bearish candlestick signal as this provides traders the option of basing entry/risk from the pattern) would, according to our technical studies, be good for a short, targeting daily support at 25385. Traders are strongly urged to consider risk/reward here. Anything less than a 1:1 ratio to 25385 is a precarious setup.
Today’s data points: FOMC Member Brainard Speaks.
XAU/USD (GOLD):
Wednesday’s session, as you can see, lacked direction, ending the day down 0.19%. Given this, much of the following analysis will mirror yesterday’s briefing.
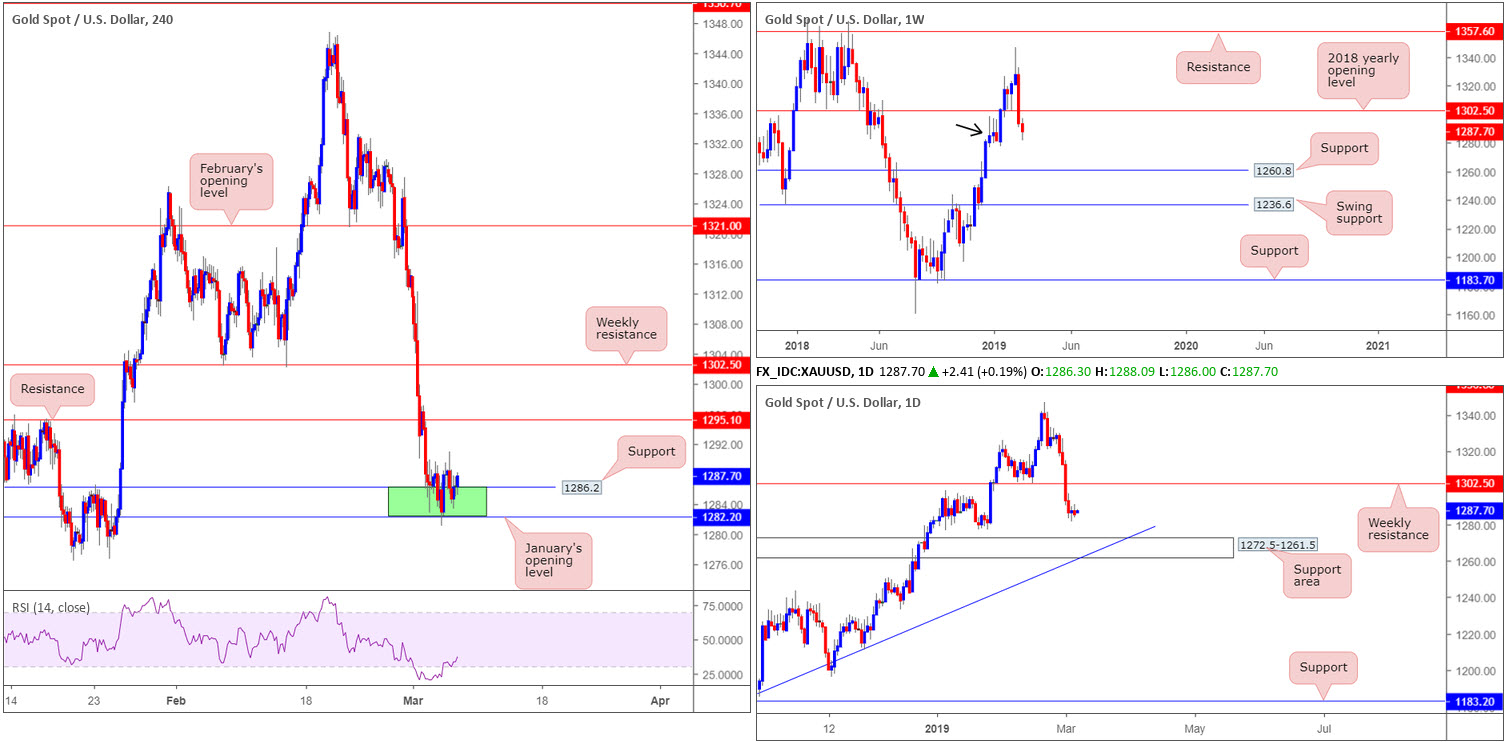
For those who read Tuesday’s report you may recall the piece highlighting interest out of the green H4 zone at 1282.2/1286.2 (comprised of January’s opening level at 1282.2 and H4 support at 1286.2). As of writing, the area is holding ground, though did suffer a marginal breach to the downside yesterday, likely tripping a portion of stops.
The interest for 1282.2/1286.2 largely stemmed from the weekly timeframe. By way of a near-full-bodied bearish candle, weekly price engulfed the 2018 yearly opening level at 1302.5 in strong fashion last week. Nevertheless, demand is seen in motion around 1276.5-1298.5 (black arrow), which could force a retest of 1302.5 as resistance this week. It’s the demand that caught our interest here. Beyond the parapets of the current weekly demand, the daily chart has eyes on a support area coming in at 1272.5-1261.5, which happens to align with a trend line support (taken from the low 1160.3).
Areas of consideration:
The green zone on the H4 timeframe at 1282.2/1286.2 remains of interest.
For those already long from the said H4 zone (and survived Tuesday’s move beneath 1282.2), the first take-profit target rests around H4 resistance at 1295.1, followed by weekly resistance at 1302.5.
For conservative traders wanting a confirming candlestick signal, Tuesday’s action printed a H4 bullish engulfing candlestick out of the zone, which, as of current price, still remains in play.
The accuracy, completeness and timeliness of the information contained on this site cannot be guaranteed. IC Markets does not warranty, guarantee or make any representations, or assume any liability with regard to financial results based on the use of the information in the site.
News, views, opinions, recommendations and other information obtained from sources outside of www.icmarkets.com.au, used in this site are believed to be reliable, but we cannot guarantee their accuracy or completeness. All such information is subject to change at any time without notice. IC Markets assumes no responsibility for the content of any linked site. The fact that such links may exist does not indicate approval or endorsement of any material contained on any linked site.
IC Markets is not liable for any harm caused by the transmission, through accessing the services or information on this site, of a computer virus, or other computer code or programming device that might be used to access, delete, damage, disable, disrupt or otherwise impede in any manner, the operation of the site or of any user’s software, hardware, data or property.


