
A note on lower timeframe confirming price action…
Waiting for lower timeframe confirmation is our main tool to confirm strength within higher timeframe zones, and has really been the key to our trading success. It takes a little time to understand the subtle nuances, however, as each trade is never the same, but once you master the rhythm so to speak, you will be saved from countless unnecessary losing trades. The following is a list of what we look for:
- A break/retest of supply or demand dependent on which way you’re trading.
- A trendline break/retest.
- Buying/selling tails/wicks – essentially we look for a cluster of very obvious spikes off of lower timeframe support and resistance levels within the higher timeframe zone.
- Candlestick patterns. We tend to only stick with pin bars and engulfing bars as these have proven to be the most effective.
We search for lower timeframe confirmation between the M15 the H1 timeframes, since most of our higher-timeframe areas begin with the H4. Stops are usually placed 5-10 pips beyond confirming structures.
EUR/USD:
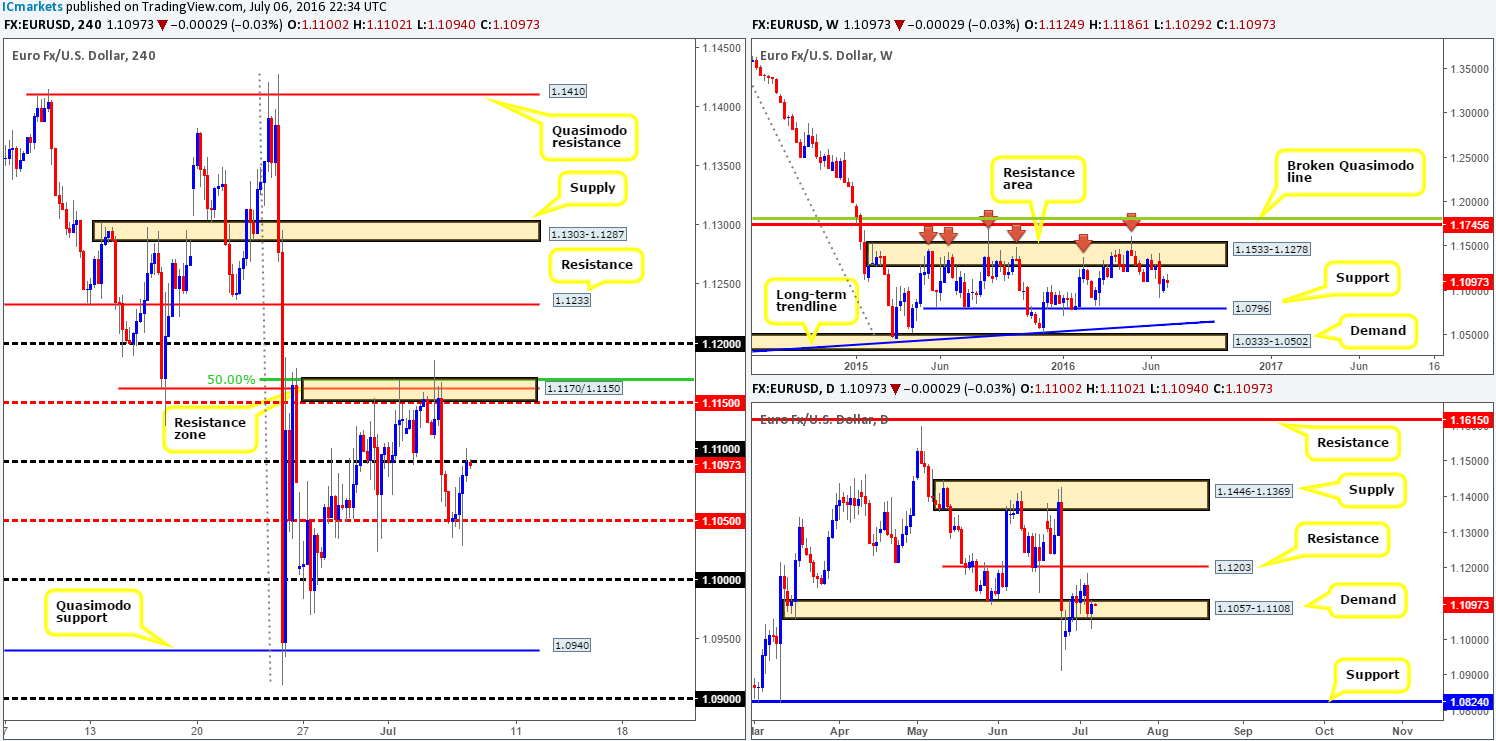
As can be seen from the H4 chart the single currency settled around the 1.11 handle yesterday, following a modest rebound from the H4 mid-way support at 1.1050 on the back of better than expected US data. Considering only the H4 chart, it is at least from a technical standpoint, challenging to guestimate direction today from 1.11. So let’s take a quick peek at what the higher timeframes are up to…
Over on the weekly chart the EUR appears to be floating mid-range between a long-term weekly resistance area coming in at 1.1533-1.1278, and a long-term weekly support line seen at 1.0796. On account of this structure price could effectively move either way. The story on the daily chart, however, shows that daily demand penciled in at 1.1057-1.1108 managed to successfully underpin this market yesterday. The next upside target from this angle can be seen at 1.1203 – a daily resistance barrier.
Our suggestions: Put simply, the 1.11 handle has a good chance of giving way today thanks to the current daily demand area holding ground. This could potentially see price advance up to the H4 resistance zone coming in at 1.1170/1.1150 (H4 mid-way resistance at 1.1150/H4 resistance at 1.1162/ H4 50.0% Fib resistance at 1.1170), and quite possibly the 1.12 handle (coincides well with the above said daily resistance hurdle).
For our team to be permitted to trade above 1.11, not only would a close above this number be required, but we’d also want to see a retest of this level as support followed by lower timeframe confirmation (see the top of this report for entry techniques).
Levels to watch/live orders:
- Buys: Watch for price to consume 1.11 and look to trade any retest seen thereafter (lower timeframe confirmation required).
- Sells: Flat (Stop loss: N/A).
GBP/USD:
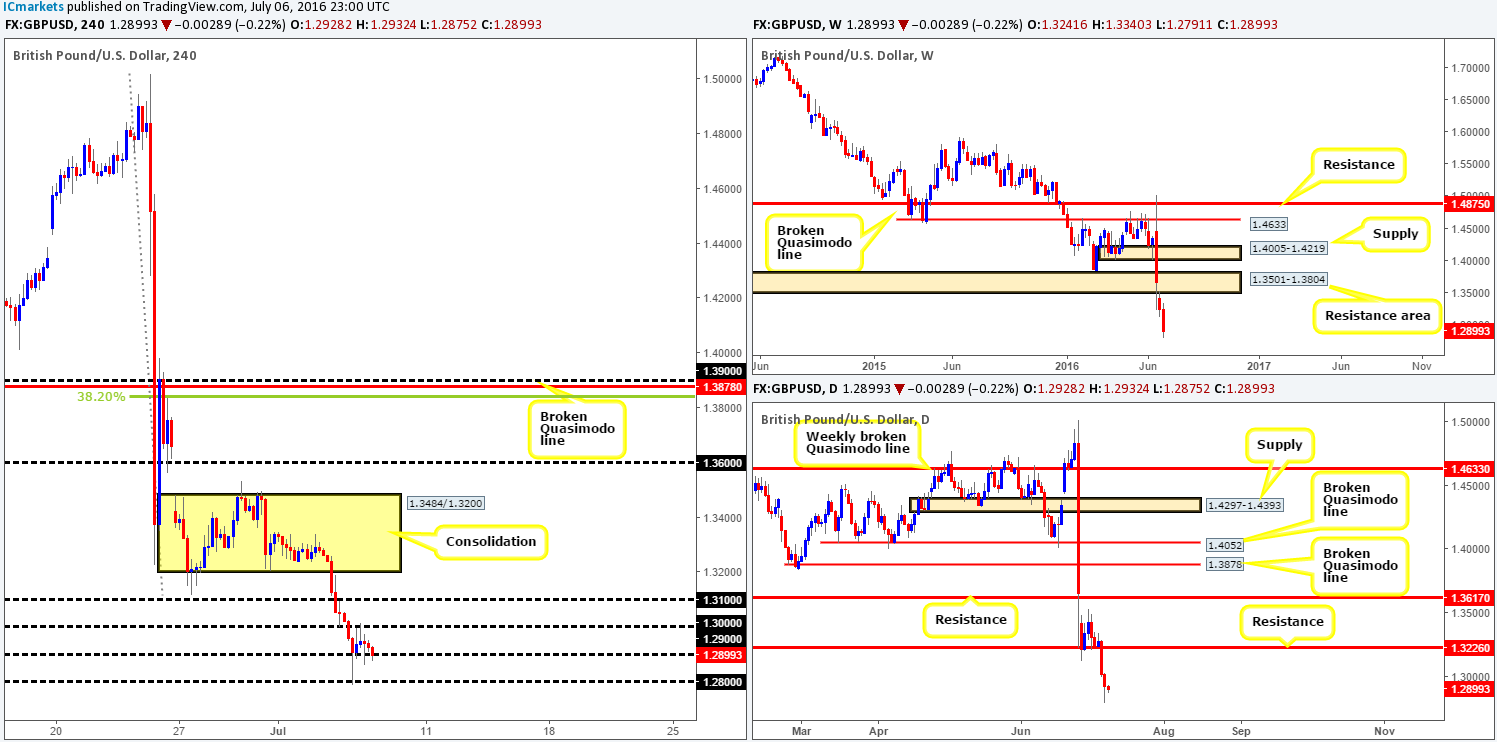
Despite the pair spending the majority of yesterday locked between the key figure 1.30 and the 1.29 handle, the GBP suffered yet another losing day! At the time of writing, 1.29 is seen under pressure as H4 candle activity looks increasingly bearish. On the whole, we remain relatively blind on the higher timeframes right now as price continues to trade around 31-year lows with very little local structure present. Looking at historical data right back to 1986 we can see some demand around the 1.20 mark. As you can see though, there’s a lot of ground to cover before this barrier sees some action.
Our suggestions: Fundamentally, this pair may still be heading lower as political uncertainty in the UK remains high. Therefore, do try and keep abreast with latest developments if you intend on trading this market. From a technical standpoint, nevertheless, one could look for shorts below 1.29 today, targeting 1.28. For this we would HIGHLY recommend waiting for price to CLOSE below 1.30, and only consider shorts should one see a retest of this number as resistance followed by a lower timeframe sell signal (see the top of this report for lower timeframe entry techniques).
Levels to watch/live orders:
- Buys: Flat (Stop loss: N/A).
- Sells: Watch for price to consume the 1.29 handle and look to trade any retest seen thereafter (lower timeframe confirmation required).
AUD/USD:
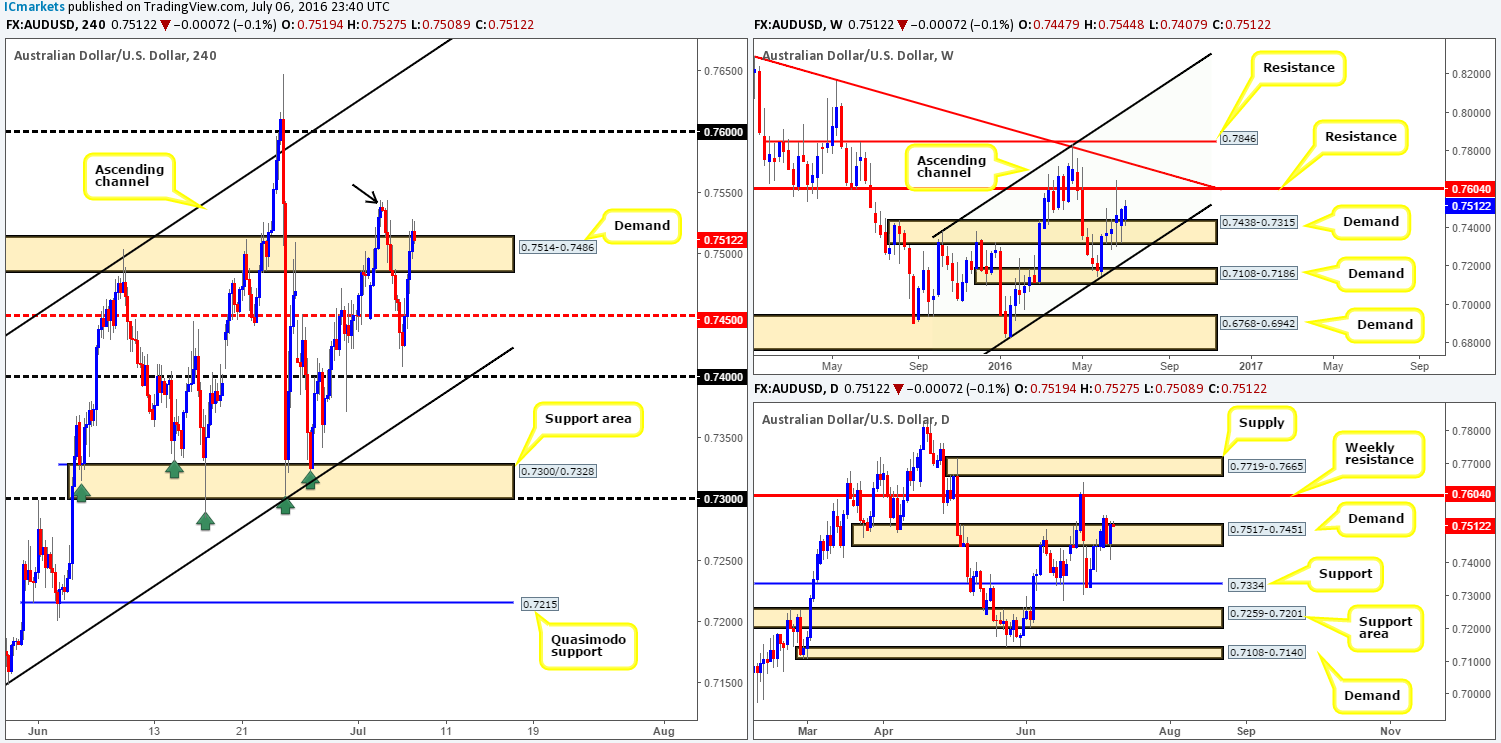
The commodity currency managed to find its feet early on in the day, with the pair seen attracting fresh buyers into the market just ahead of the 0.74 handle. This, as you can see, saw the H4 mid-way resistance 0.7450 as well as the H4 supply base at 0.7514-0.7486 (now acting demand) taken out. To our way of seeing things right now, if the recently broken H4 supply zone holds as demand today, other than the small H4 supply marked with a black arrow at 0.7544-0.7534, the path north beyond here appears free up to the 0.76 handle.
With the above points noted, where does our team stand in the bigger picture? Well, weekly demand at 0.7438-0.7315 continues to hold firm. The next upside target from this area is seen at 0.7604 – a battle-tested weekly resistance barrier. Looking down to the daily scale, demand at 0.7517-0.7451, despite suffering a breach yesterday, remains in good shape for the time being. Just like the weekly timeframe, the next upside target from this daily zone here is also the aforementioned weekly resistance line.
Our suggestions: Watch for lower timeframe buy entries within the current H4 demand area. Should one manage to pin down a setup, the ultimate target (at least for us) will be the 0.76 handle as it merges beautifully with the above said weekly resistance level. In addition to this, we would advise reducing risk to breakeven following a solid close above the H4 supply marked with a black arrow at 0.7544-0.7534.
Levels to watch/live orders:
- Buys: 0.7514-0.7486 [Tentative – confirmation required] (Stop loss: dependent on where one confirms this area).
- Sells: Flat (Stop loss: N/A).
USD/JPY:
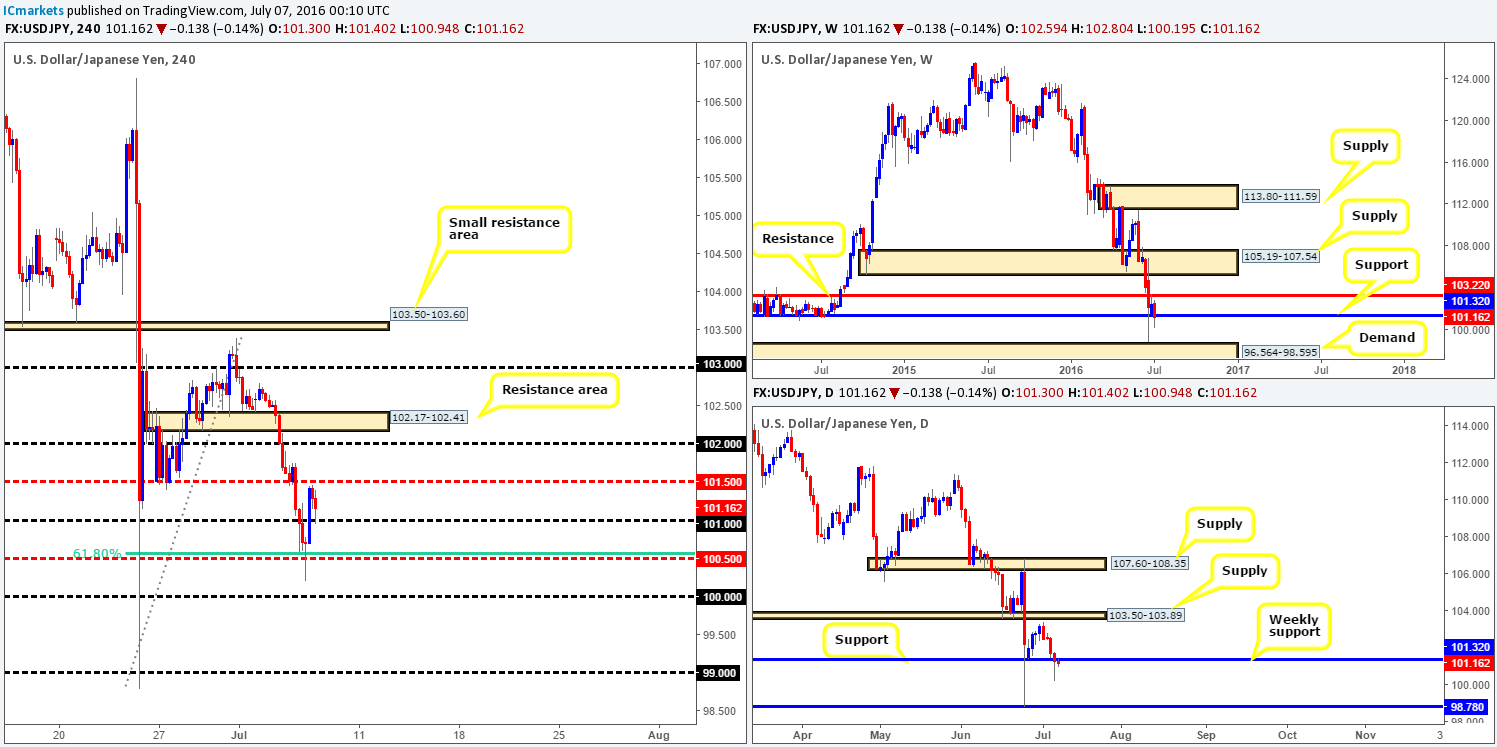
Going into the early hours of yesterday’s session, the Yen remained well-bid as investors continued to favor the safe-haven currency. However, going into US trade the pair found fresh bids around the H4 mid-way support 105.00 (bolstered by a H4 61.8% Fib support at 100.57), which was further boosted by stronger-than-expected US ISM manufacturing PMI data.
As things stand now, we can see bids are defending the 101 handle. This line – coupled with the weekly support at 101.32 could see the USD/JPY extend higher up to at least the H4 mid-way point 101.50 today, and with a push, possibly up to the 102 handle.
Our suggestions: Watch for a lower timeframe entry long from 101.00, targeting 101.50 as a first take-profit target. Here we’d look to reduce risk to breakeven and liquidate 50% of the position, in the hope that price may rally further up to the 102 hurdle. For those who struggle to find entries on the lower timeframes, please see the top of this report for a list of entry techniques we use.
Levels to watch/live orders:
- Buys: 101.00 region [Tentative – confirmation required] (Stop loss: dependent on where one confirms this area).
- Sells: Flat (Stop loss: N/A).
USD/CAD:
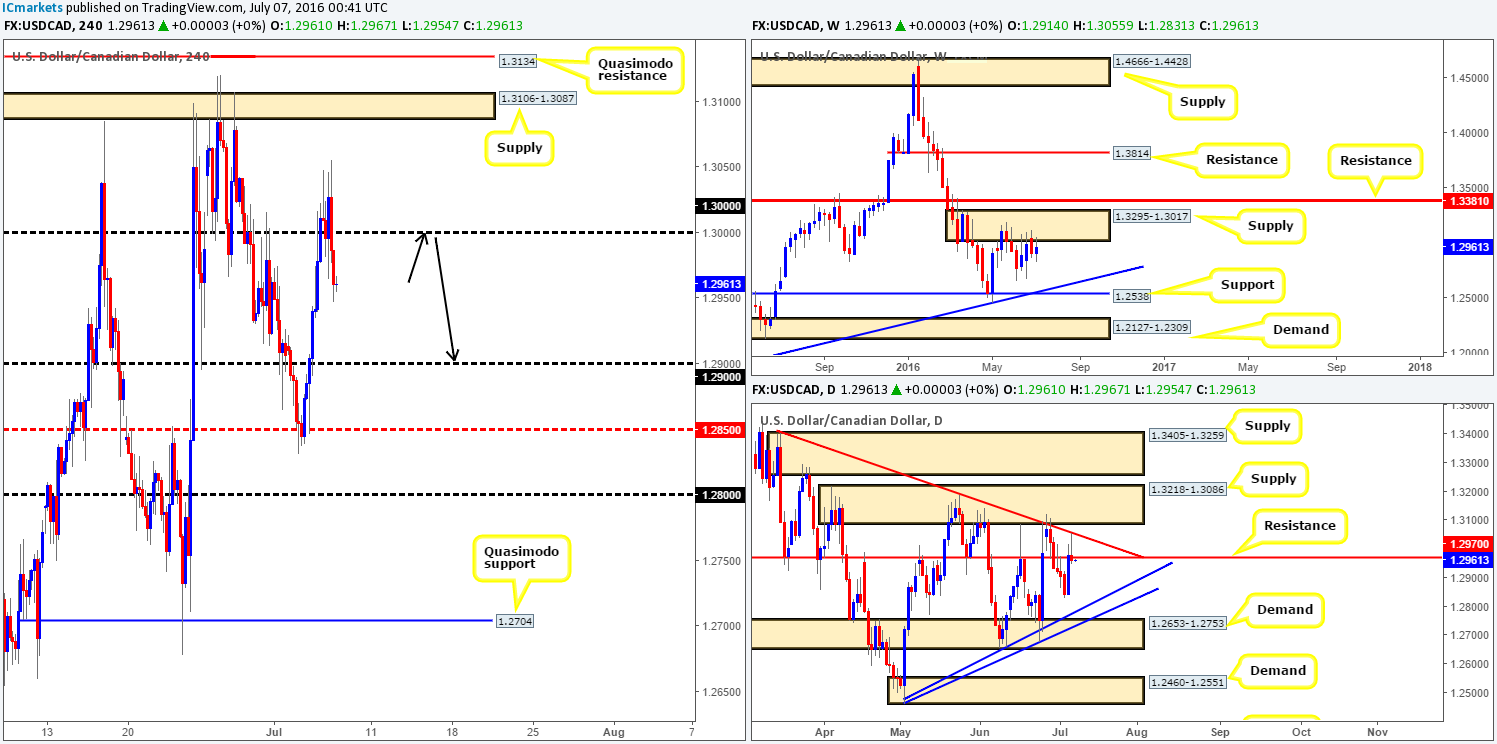
Reporting from the weekly chart this morning, one can see that price is once again respecting the weekly supply zone at 1.3295-1.3017. In the event that weekly sellers remain dominant from here, the next support to keep an eye on is the weekly trendline extended from the high 1.1278. In light of recent weekly action, daily price chalked up a near-perfect selling tail that whipsawed through the daily resistance line at 1.2970 and hit the daily trendline taken from the high 1.3401.
Given the above, here is our view on where price is likely heading today… The H4 mid-way point 1.2950 looks weak in our opinion since it failed to provide any meaningful support and resistance over the past few weeks. With that being said, should price retest the key figure 1.30 today, this could provide one a platform in which to begin hunting for a short entry into the market, targeting the 1.29 handle as your first take-profit zone (as per the black arrows).
Our suggestions: Watch for price to retest 1.30 and look to enter short alongside lower timeframe confirming price action. This could be in the form of either an engulf of demand followed by a subsequent retest, a trendline break/retest or simply a collection of well-defined selling wicks around the 1.30 region.
Levels to watch/live orders:
- Buys: Flat (Stop loss: N/A).
- Sells: 1.30 region [Tentative – confirmation required] (Stop loss: dependent on where one confirms this area).
USD/CHF:
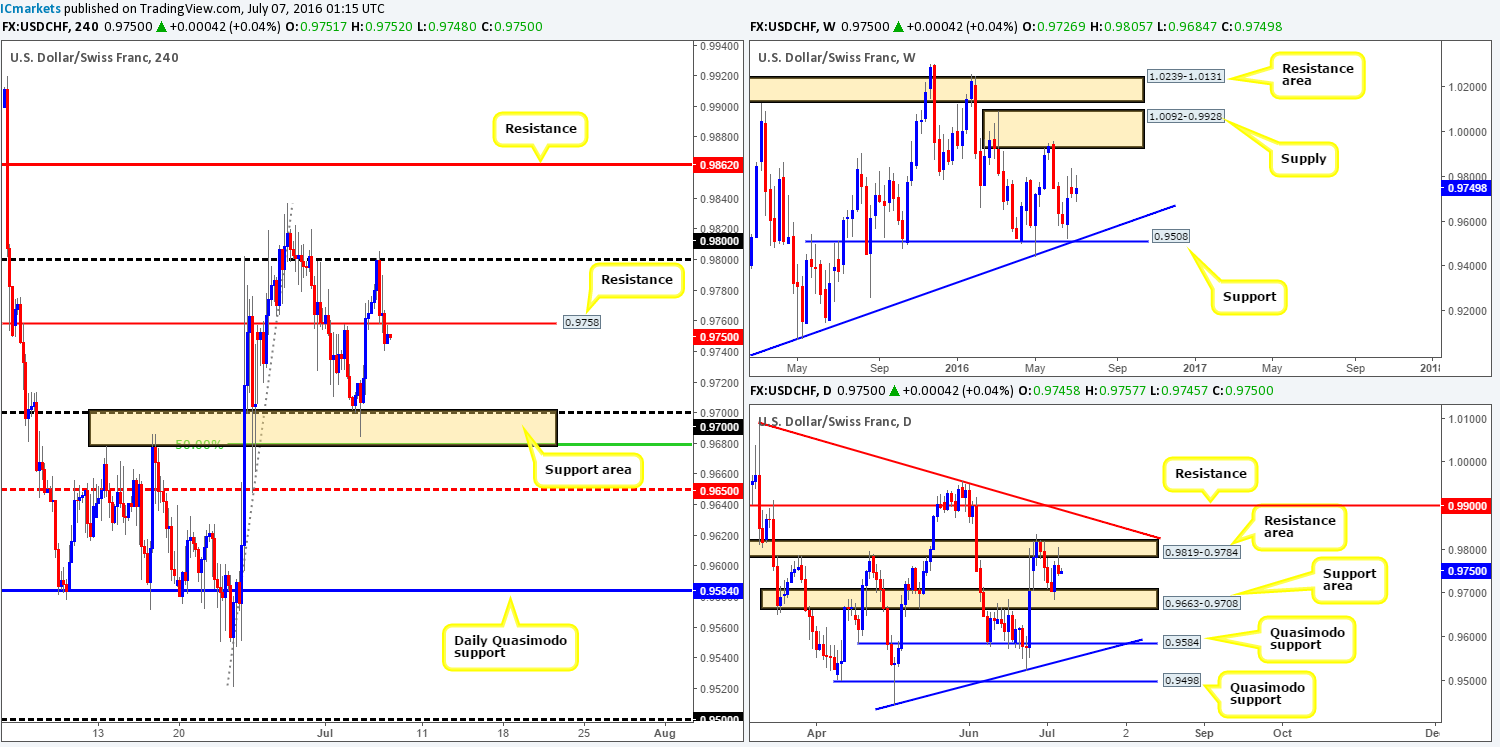
A strong ceiling of offers was hit around the psychological boundary 0.98 going into yesterday’s London morning session, consequently pulling price below H4 support at 0.9758 (now acting resistance) and reaching lows of 0.9740 on the day. Seeing as how the 0.98 line was enclosed within a daily resistance area at 0.9819-0.9784, the pin-point reaction should not really come as much of a surprise. On the grounds that there is room for this market to move lower on both the weekly (down to the weekly trendline support extended from the low 0.8703) and daily (down to the daily support area at 0.9663-0.9708) charts right now, there is a strong possibility that the Swissy may dive to connect with the H4 support area drawn in at 0.9679/0.9700 (comprised of a round number at 0.9700 and a H4 Fib support at 0.9679 and also sits within the aforementioned daily support area).
Our suggestions: Watch for price to retest the H4 resistance at 0.9758 and then look to jump in short on the back of a lower timeframe entry (see the top of this report for lower timeframe entry techniques), targeting the H4 support area at 0.9679/0.9700.
Levels to watch/live orders:
- Buys: Flat (Stop loss: N/A).
- Sells: 0.9758 region [Tentative – confirmation required] (Stop loss: dependent on where one confirms this area).
DOW 30:
(Slight change in structure)
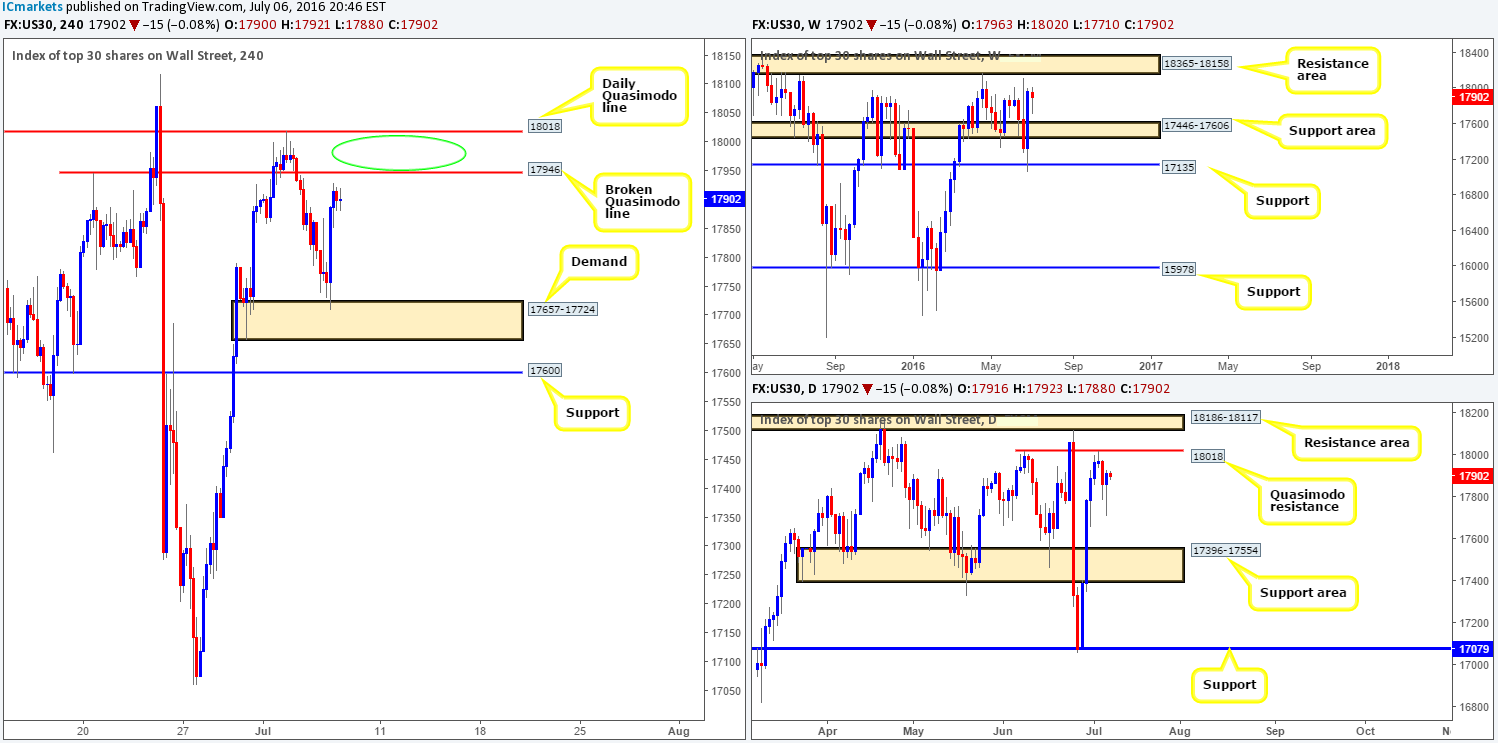
Beginning with a look at the weekly chart this morning, it is clear to see that the bulls remain in the driving seat at the moment. Further buying at this stage would likely end with the DOW colliding with the weekly resistance area seen at 18365-18158, which has held this index lower since the beginning of March 2015. On the other hand, daily movement recently saw a to-the-pip reaction off of a daily Quasimodo resistance line penciled in at 18018. Initial action from this line was impressive. However, things turned a little sour recently as yesterday’s flow saw renewed buying interest come in from the 17710 region.
From the H4 chart, yesterday’s buying was set in motion from the top-side of a H4 demand base registered at 17657-17724. Before one can truly say the buyers have the upper hand in this market, however, both the H4 broken Quasimodo line at 17946 and the aforementioned daily Quasimodo resistance level needs to be consumed in our opinion.
Our suggestions: Despite the weekly timeframe showing room to advance, entering long around current prices might not be the best path to take due to the nearby above said H4 and daily resistances. Yet, our team is still interested in selling from in between these two lines (see the green circle) with the backing of lower timeframe confirmation, since the daily shows room to move down to a daily support area at 17396-17554.
Levels to watch/live orders:
- Buys: Flat (Stop loss: N/A).
- Sells: 18018/17946 region [Tentative – confirmation required] (Stop loss: dependent on where one confirms this area).
Gold:
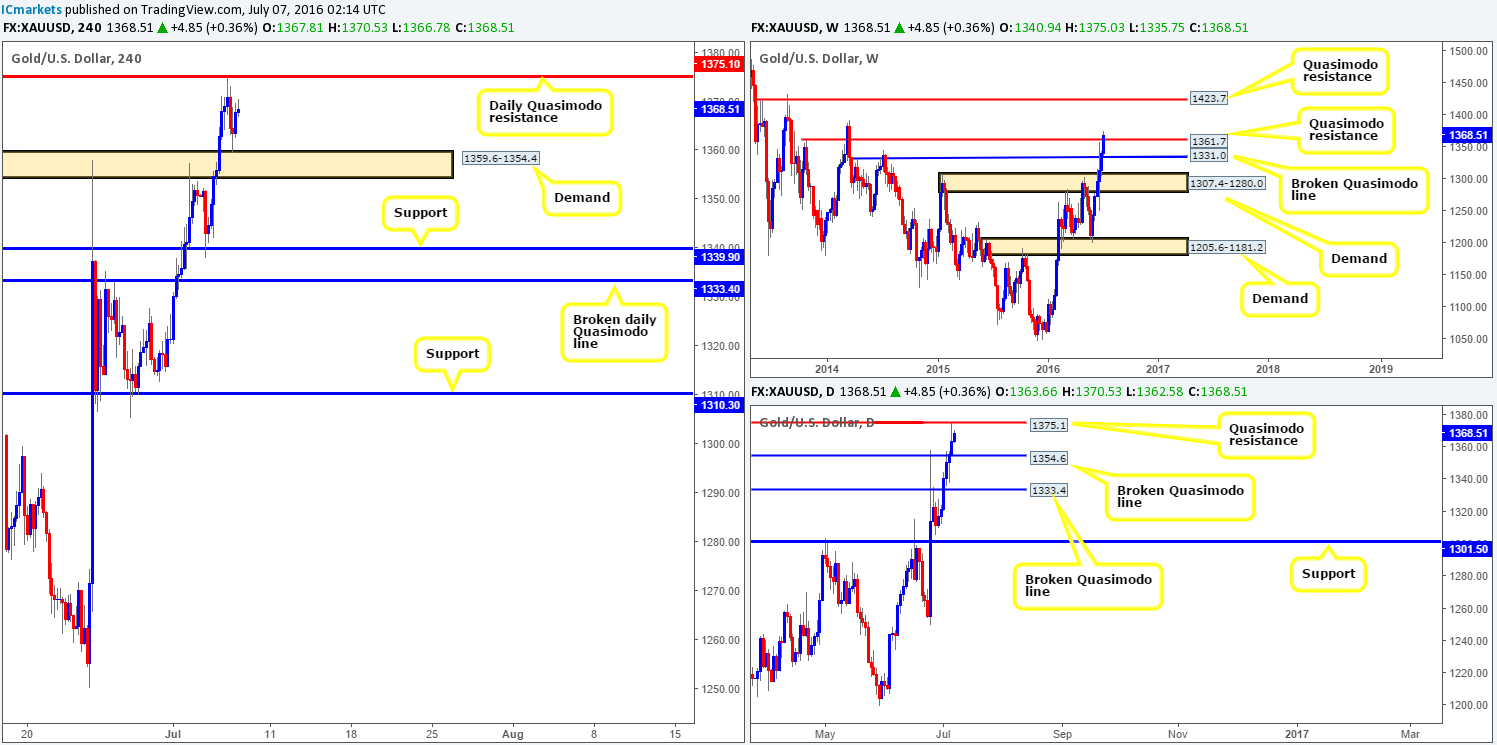
Early on in London trading yesterday, the yellow metal rebounded to-the-pip from a daily Quasimodo resistance level carved in at 1375.1. Downside momentum from this line, as you can see, brought gold into the jaws of a H4 demand base at 1359.6-1354.4 which also reacted beautifully, forcing price to close at 1363.6 by the day’s end. Despite this, weekly action remains hovering above the weekly Quasimodo resistance level at 1361.7, which could, especially if a close above this line is seen, attract further buying up to 1423.7 – another weekly Quasimodo resistance line.
Our suggestions: To put it simply, offers around the aforementioned daily Quasimodo line could have potentially dried up, and given that weekly price is reflecting more of a bullish stance right now (see above), we are going to pass on any sells. Should a close above the daily Quasimodo line come into view, this could be a good opportunity to begin looking to buy this market on any confirmed retest of this line up to the H4 resistance at 1387.8 followed by the H4 supply at 1416.2-1410.1 (houses a daily resistance line at 1413.2). However, until that time our team will remain flat.
Levels to watch/live orders:
- Buys: Watch for price to consume the daily Quasimodo resistance line at 1375.1 and look to trade any retest seen thereafter (lower timeframe confirmation required).
- Sells: Flat (Stop loss: N/A).


