
Key risk events today:
US Unemployment Claims; US ISM Services PMI; Canada Ivey PMI.
(Previous analysis as well as outside sources – italics).
EUR/USD:
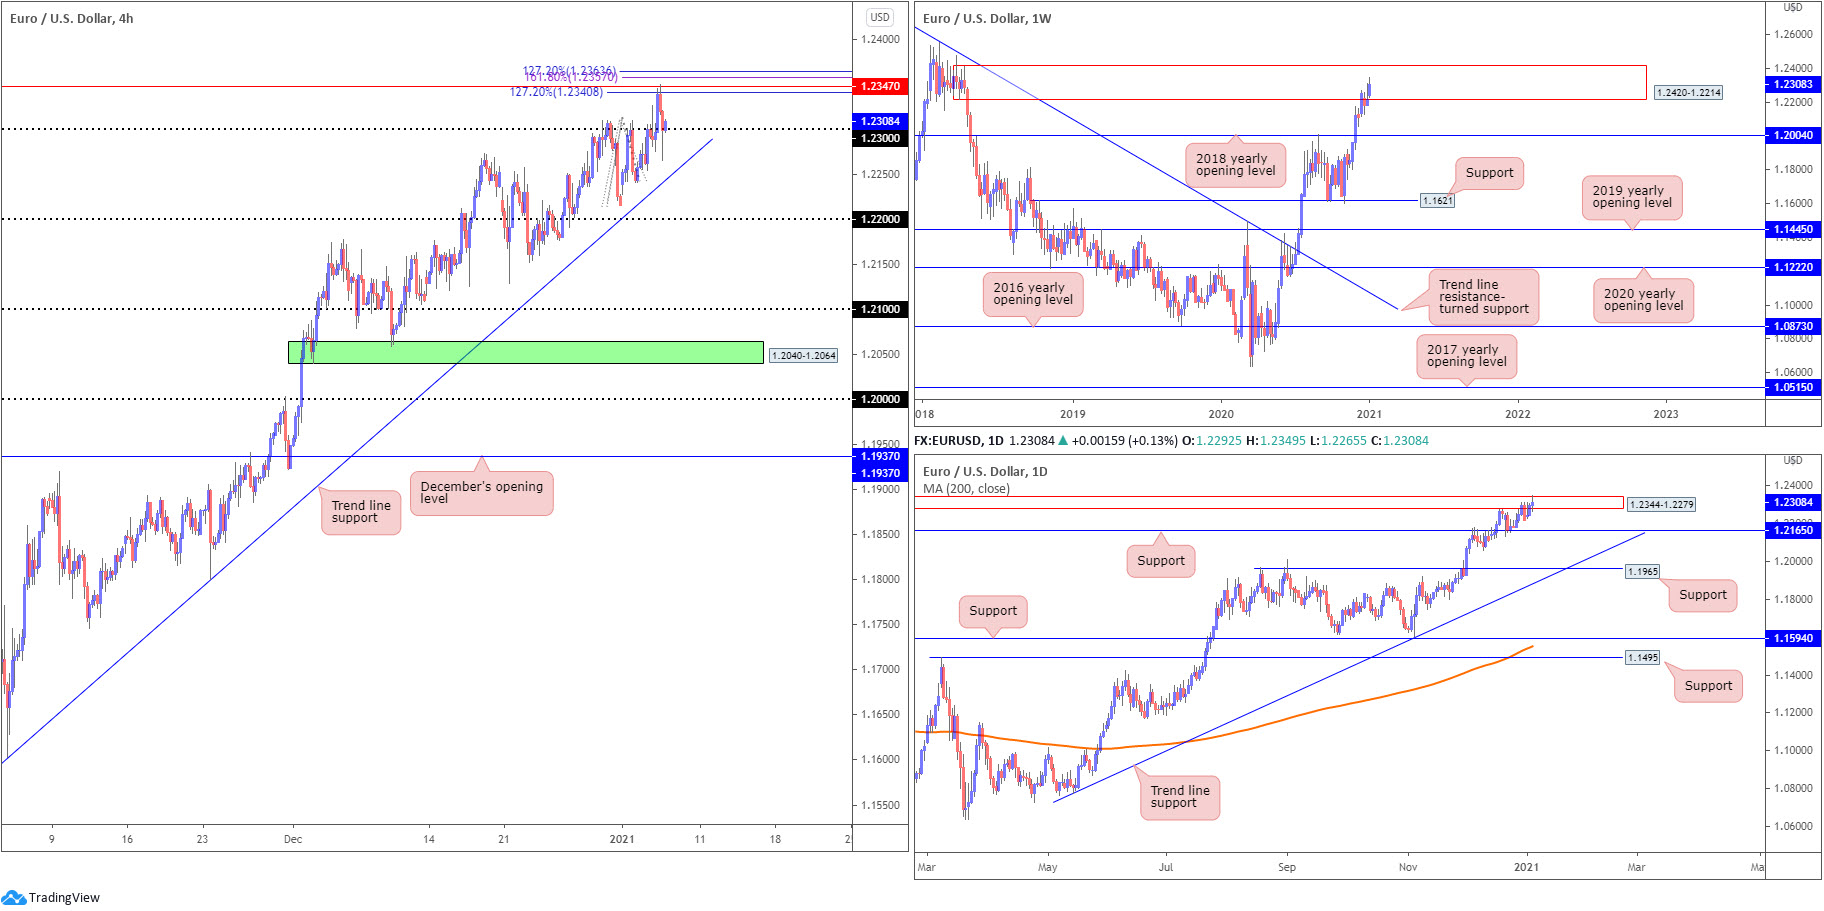
The US dollar index (DXY) concluded Wednesday undecided a touch off multi-year troughs. This, in conjunction with EUR/USD H4 resistance at 1.2347, a level supported by a number of key Fibonacci levels (1.2363/1.2340), weighed on the pair during US hours, feeding moves back to the 1.23 figure. South of the round number, traders will acknowledge trend line support, extended from the low 1.1602.
The weekly timeframe’s technical landscape remains unaltered from Monday’s outlook. Therefore, below is a reminder of where we left things (italics):
Buyers and sellers remain battling for position within supply at 1.2420-1.2214. Should sellers eventually take the reins, the 2018 yearly opening value at 1.2004 is likely a level downside movement may target. In terms of trend, however, upside remains favoured (the pair has been trending higher since late March) – more so if price overthrows the 1.2555 February 12 high (2018).
From the daily timeframe, supply at 1.2344-1.2279 (nestled within the walls of weekly supply mentioned above at 1.2420-1.2214), had its upper frame tested on Wednesday. Buyers backed off following the move, with price currently forming an indecision candle (albeit with a slight upside bias). Breaking above daily supply advertises higher moves within current weekly supply. Daily support at 1.2165 is also in sight should sellers take control.
Areas of consideration:
- 23 on the H4 timeframe could offer support, having seen this market trend higher since March. Additionally, daily supply at 1.2344-1.2279 is under pressure after its upper edge was challenged yesterday.
- 23 failing to offer support, nevertheless, opens the door for H4 trend line support to make an appearance, possibly providing a platform for buyers.
GBP/USD:
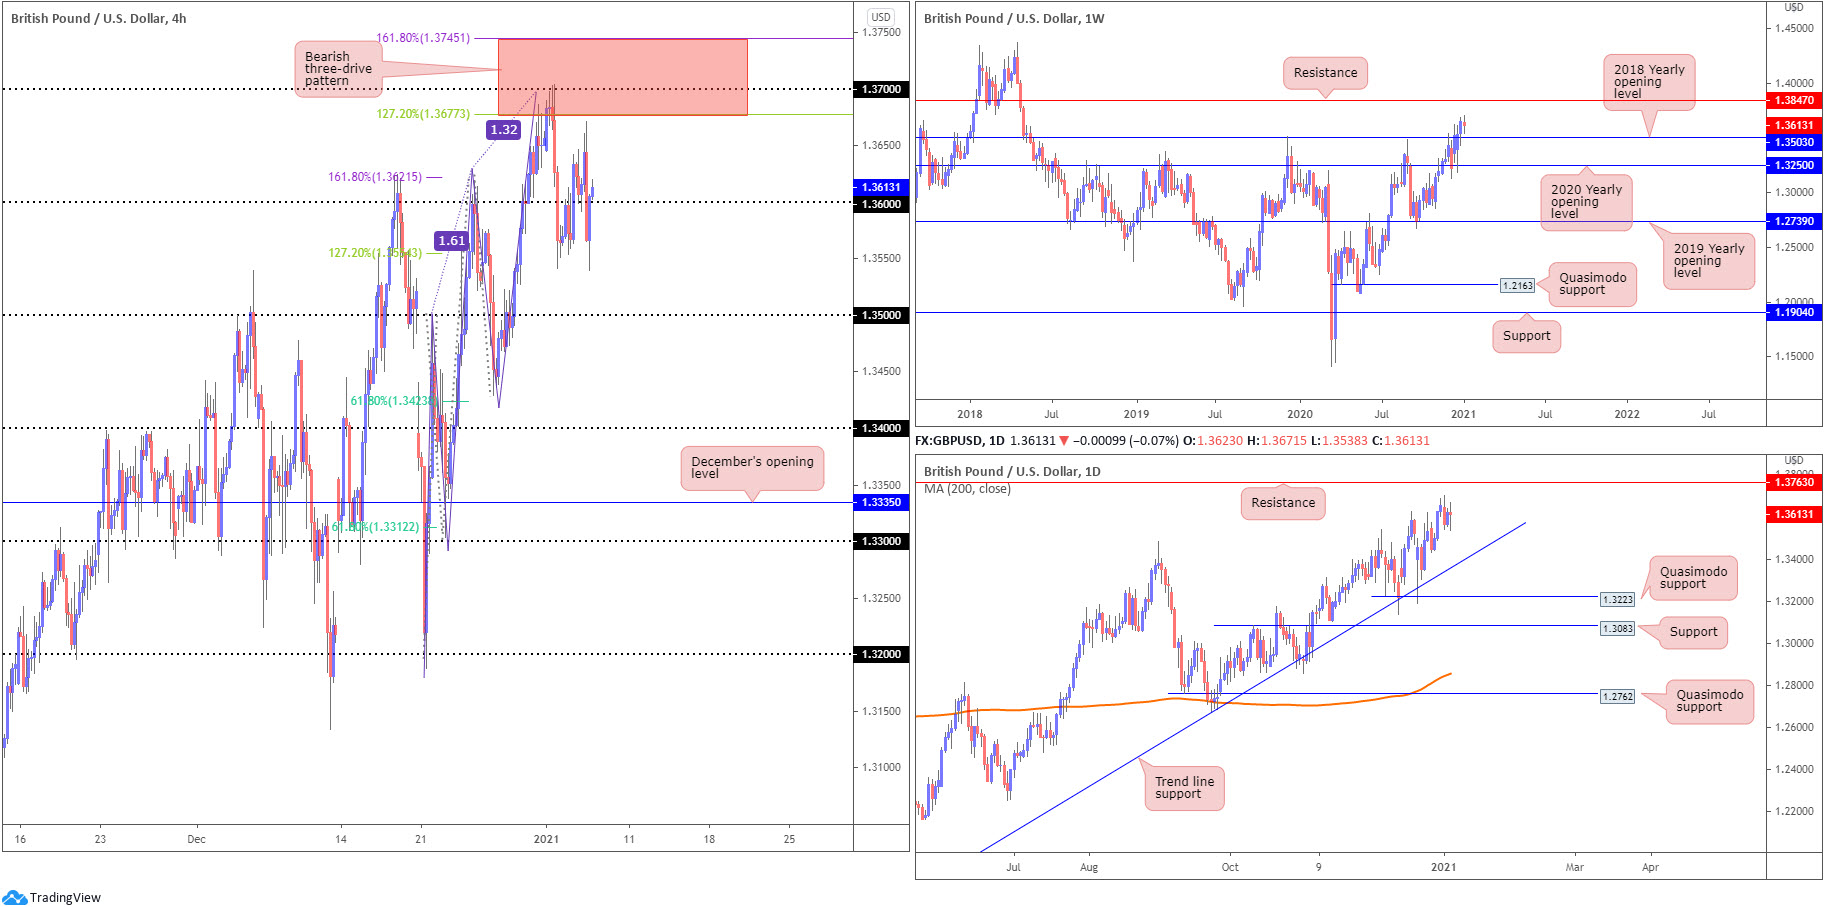
Sterling ended somewhat noncommittal against the US dollar on Wednesday, despite an early retest at 1.36 on the H4 timeframe. Overhead, 1.37 remains surrounded by a three-drive bearish formation, with a termination zone between the 161.8%/127.2% Fibonacci projection points at 1.3745 and 1.3677, respectively (it is common to focus on 127.2% ratios in three-drives; however, leaving 161.8% on the chart provides price some wiggle room and an area to help determine stop-loss placement). South of 1.36, aside from 1.3550 serving as support, bearish eyes are likely centred on the 1.35 figure.
In terms of the bigger picture, change on the weekly and daily timeframes was limited Wednesday, with the daily timeframe framing an indecision candle.
Higher on the curve, weekly price reveals the unit concluded 2020 at fresh multi-month highs. The 2018 yearly opening value at 1.3503 displays support, while further buying places emphasis on resistance at 1.3847. Also of technical interest was the engulf of 1.3514 (December 9 [2019] high), helping to confirm the current uptrend. From the daily timeframe, price is seen hovering between 1.3763 resistance (previous Quasimodo support level) and trend line support, etched from the low 1.1409.
Areas of consideration:
- The 1.37 area, as well as the three-drive bearish formation at 1.3745/1.3677 (red).
- 35 stands as potentially strong support, merging with weekly support at 1.3503.
AUD/USD:
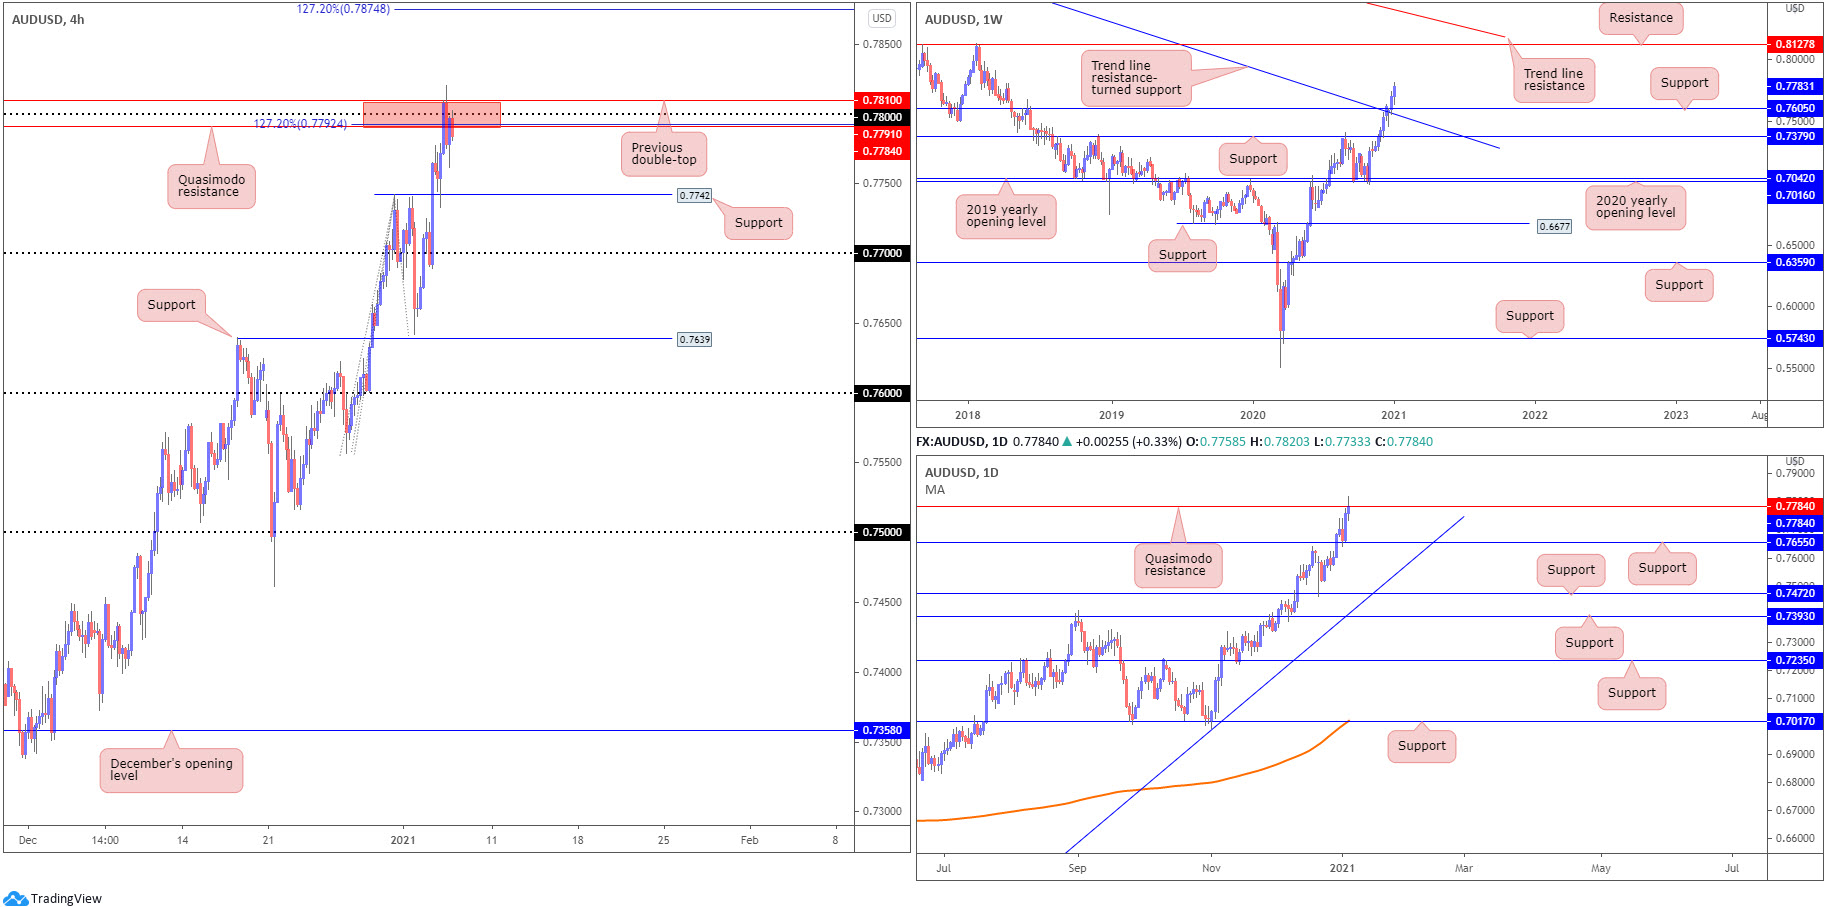
Risk-on movement, in addition to the US dollar index renewing multi-month troughs, led the risk-sensitive Australian dollar to fresh multi-month peaks Wednesday.
As evident from the H4 timeframe, retesting support at 0.7742 (previous swing high) powered buyers into a zone of resistance between 0.7810/0.7791 (a previous double-top and a Quasimodo resistance), which happens to house the 0.78 figure and a 127.2% Fibonacci projection point at 0.7792. Continued interest to the upside north of 0.78 shines the spotlight on a 127.2% Fibonacci extension at 0.7874.
The weekly timeframe’s technical landscape remains optimistic. Price glided through Quasimodo resistance at 0.7605 (now serving support) and trend line resistance, taken from the high 1.1065, to end 2020. This places buyers in a strong position into 2021 with room to possibly reach as far north as resistance coming in at 0.8127.
From the daily timeframe, Quasimodo resistance at 0.7784 is a talking point at the moment. Holding this level throws support back in the mix at 0.7655, while rupturing the aforesaid resistance helps confirm the upside bias witnessed on the weekly timeframe.
Areas of consideration:
- Overall, the AUD/USD’s technical trend is pointing north.
- 78 remains a resistance to be watchful of, converging with additional H4 resistances and a daily Quasimodo resistance drawn from 0.7784.
- Conquering 0.78 is likely to welcome additional buying, in line with the weekly timeframe’s bullish trajectory.
The accuracy, completeness and timeliness of the information contained on this site cannot be guaranteed. IC Markets does not warranty, guarantee or make any representations, or assume any liability regarding financial results based on the use of the information in the site.
News, views, opinions, recommendations and other information obtained from sources outside of www.icmarkets.com.au, used in this site are believed to be reliable, but we cannot guarantee their accuracy or completeness. All such information is subject to change at any time without notice. IC Markets assumes no responsibility for the content of any linked site.
The fact that such links may exist does not indicate approval or endorsement of any material contained on any linked site. IC Markets is not liable for any harm caused by the transmission, through accessing the services or information on this site, of a computer virus, or other computer code or programming device that might be used to access, delete, damage, disable, disrupt or otherwise impede in any manner, the operation of the site or of any user’s software, hardware, data or property.


