
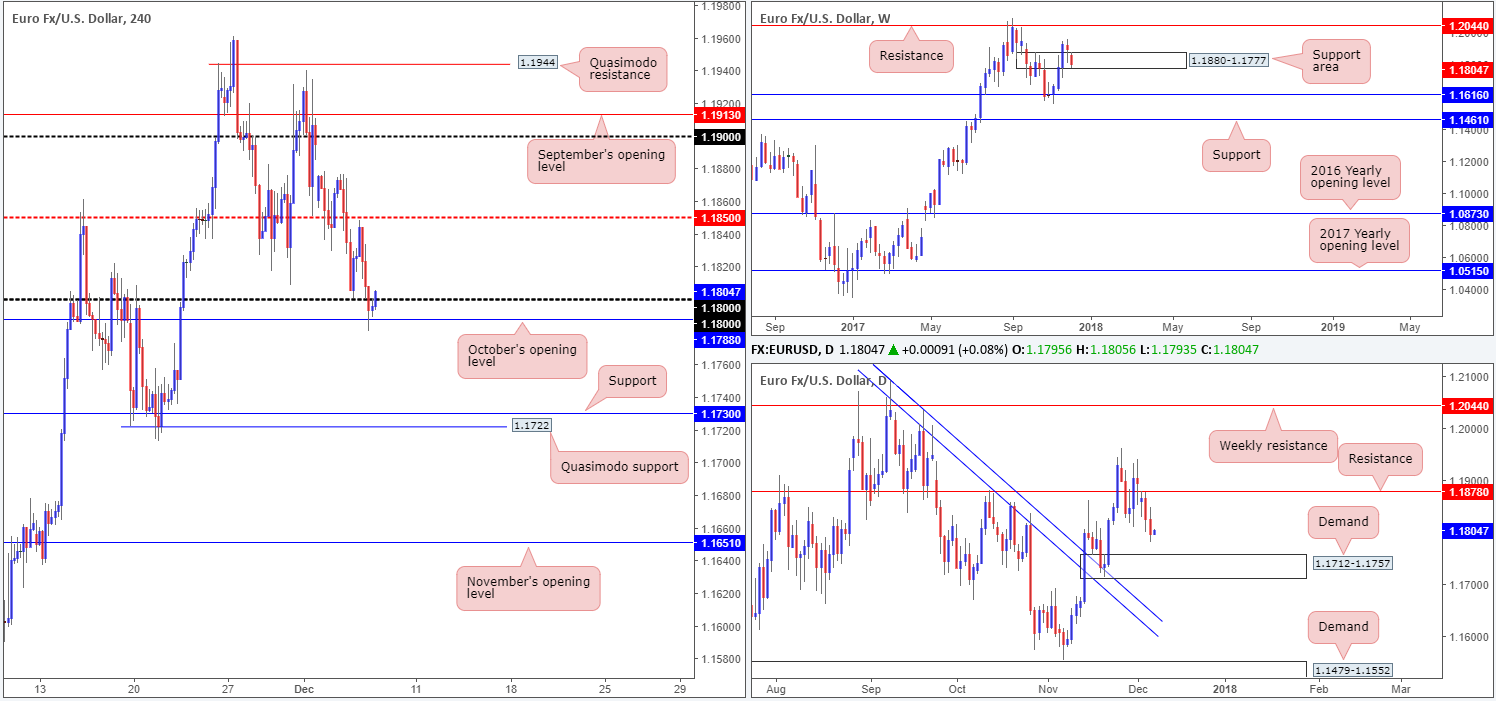
EUR/USD:
Early Asia chalked up a top just ahead of the H4 mid-level resistance at 1.1850 on Wednesday, which followed through with a dominant selloff, likely boosted by upbeat US ADP figures (suggesting a potentially solid NFP number on Friday). H4 price, as you can see, clocked a low of 1.1780 amid the US segment before mildly paring losses from October’s opening level at 1.1788.
The weekly support area at 1.1880-1.1777 is currently in a somewhat fragile position. Last week’s buying tail has experienced zero follow through thus far, and at the time of writing is seen trading around the lower edge of the zone. Daily price on the other hand, extended its bearish position from the underside of the daily resistance at 1.1878 and is seen nearing the top edge of a rather well-appointed daily demand base coming in at 1.1712-1.1757.
Direction: At current price, H4 action is seen attempting to break back above the 1.18 fence. This is an encouraging sign for the bulls, especially for those who bought from within the current weekly support area! Whether this will be enough to encourage further buying, though, is difficult to judge, as let’s remember that daily sellers look poised to dig lower. A more superior place for longs, technically speaking, might be the H4 support seen below at 1.1730. Not only is the line positioned within the walls of the aforesaid daily demand, it is also located just above a nice-looking H4 Quasimodo support at 1.1722.
Selling would only be something to consider on the break of 1.1788. Nevertheless, this would entail selling into a weekly support zone and nearby the top edge of a daily demand zone. The odds would not be in your favor!
Data points to consider: ECB president Draghi speaks at 4pm; US unemployment claims at 1.30pm GMT.
Areas worthy of attention:
Supports: 1.1788; 1.1730; 1.1722; 1.1880-1.1777; 1.1712-1.1757.
Resistances: 1.1850;1.1878.
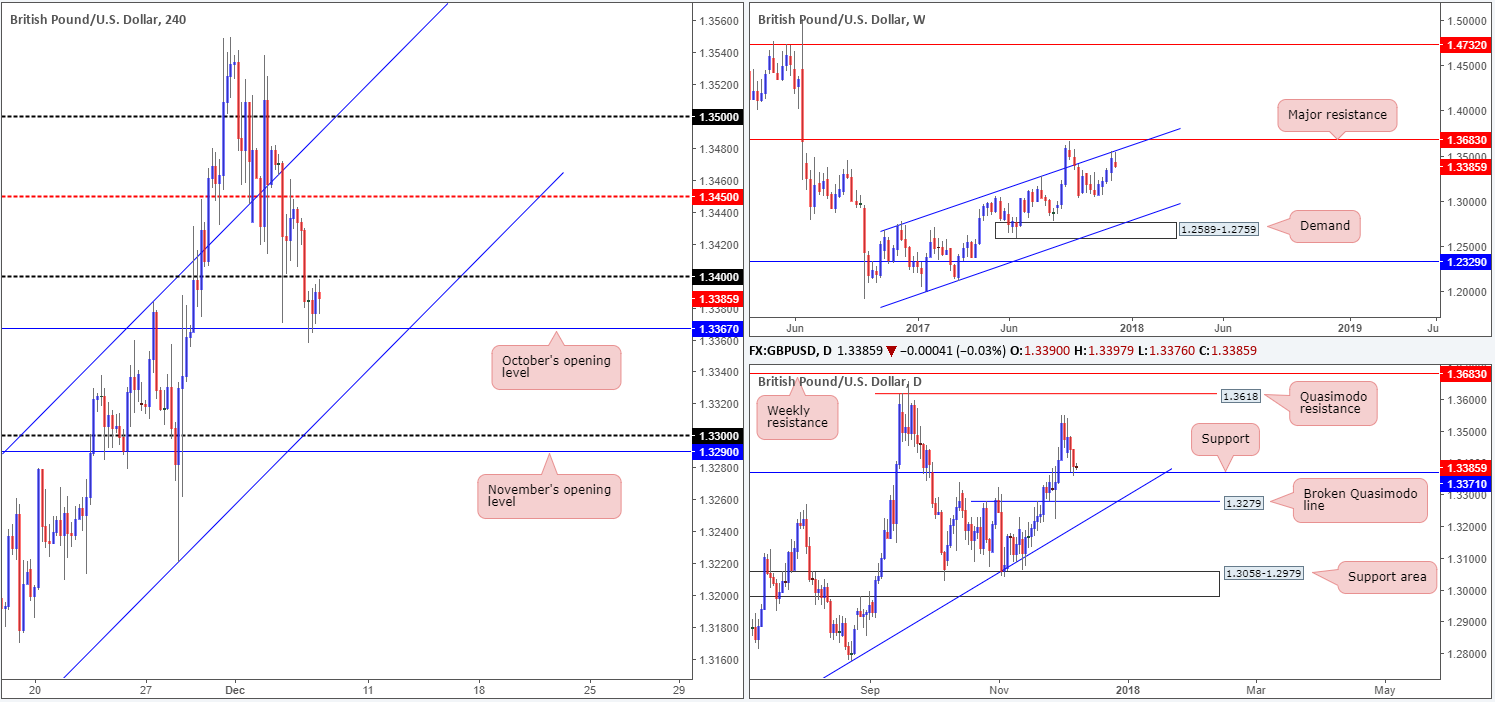
GBP/USD:
Amid the early hours of London trading, the H4 candles cracked below the 1.34 handle and connected beautifully with October’s opening level at 1.3367, which held firm throughout the remainder of the day. Freshly painted candle action, however, has struggled to make headway from this number, leaving the 1.34 line resistance unchallenged thus far.
The lack of buying enthusiasm from 1.3367 could have something to do with the fact that weekly price is seen digging lower after shaking hands with a weekly channel resistance taken from the high 1.2673. The flip side to this, of course, is the daily support currently in play at 1.3371. The line managed to print a reasonably nice-looking buying tail on Tuesday, but failed to register anything of note on Wednesday.
Direction: Weekly structure indicates further selling could be on the horizon, while daily structure suggests a pullback is a possibility. On top of this, H4 price is seen confined between the noted Oct’s open line and the 1.34 boundary.
Selling this market on a decisive H4 close below/retest of 1.3367 could be a setup to consider. The next downside target beyond here can be seen around the H4 channel support etched from the low 1.3061, followed by the 1.33 handle and then November’s opening level at 1.3290. Remember, a short in this market has the backing of the weekly channel resistance line, so price could eventually reach the daily broken Quasimodo line at 1.3279.
Data points to consider: US unemployment claims at 1.30pm GMT.
Areas worthy of attention:
Supports: 1.3367; 1.33 handle; 1.3290; H4 channel support etched from the low 1.3061; 1.3371; 1.3279.
Resistances: 1.34 handle; a weekly channel resistance taken from the high 1.2673.
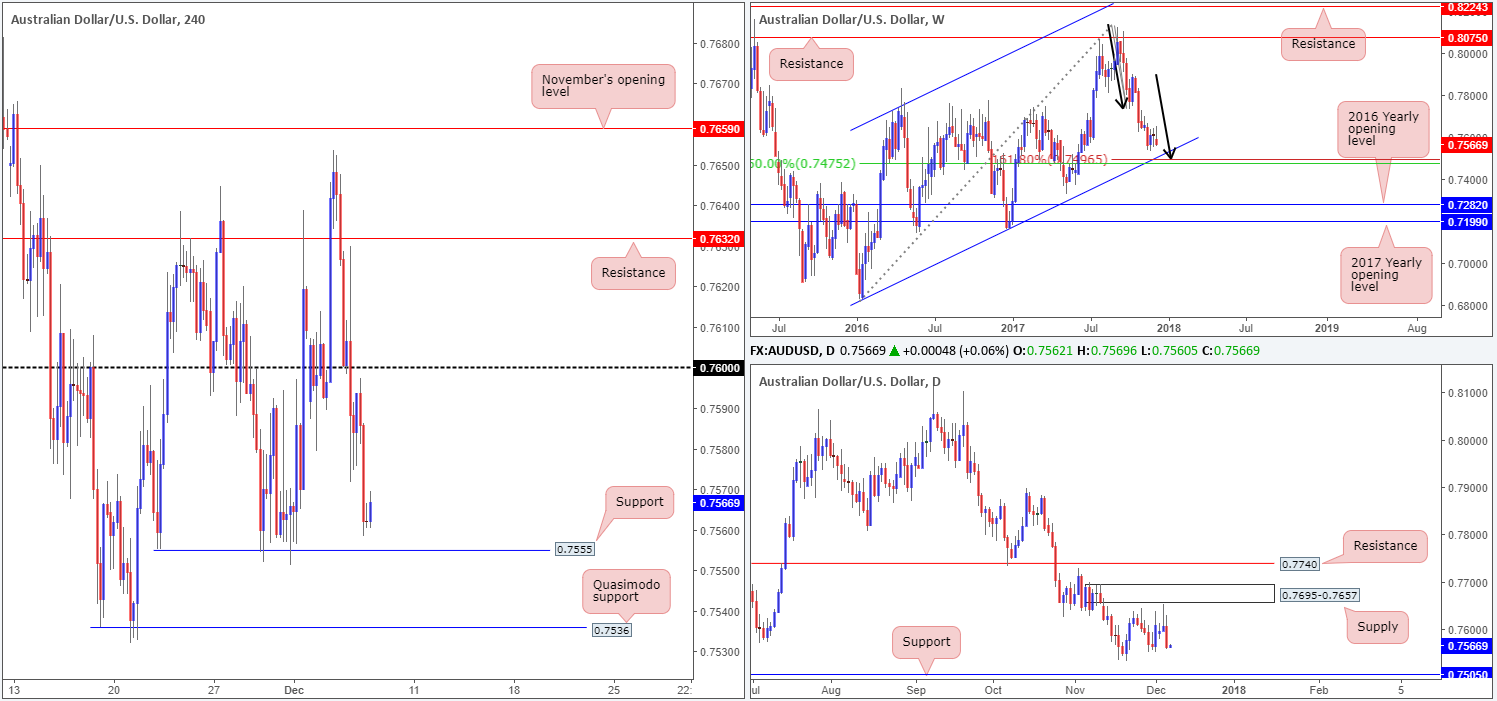
AUD/USD:
After spiking to a high of 0.7630 in early Asian hours on Wednesday, the AUD/USD aggressively crunched its way through the 0.76 handle on lower-than-expected growth data. The pair attempted to recover off lows at 0.7571, but failed to print anything of note before resuming to the downside. The day concluded with the H4 candles mildly pairing losses ahead of a H4 support level pegged at 0.7555. This level, technically speaking, is notable due to how well it held in the past. Nonetheless, is it worthy of another bounce though?
Across on the daily timeframe, the next OBVIOUS base of support does not come into view until 0.7505. The history this level boasts is incredible! On the weekly timeframe, downside is still favored it seems, as there is room for price to trade as far south as the weekly channel support extended from the low 0.6827 (merges with a weekly 50.0% value at 0.7475 taken from the high 0.8125 and a nice-looking weekly AB=CD [see black arrows] 161.8% Fib ext. point situated at 0.7496).
Direction: Due to the higher timeframes suggesting lower prices may be ahead, the current H4 support and the H4 Quasimodo support seen below it at 0.7536 are not levels of significance at this time. The 0.75 handle (not seen on the screen) is the area that continues to stand out, given the weekly/daily supports surrounding the number.
Data points to consider: US unemployment claims at 1.30pm GMT.
Areas worthy of attention:
Supports: 0.7555; 0.7536; 0.75 handle; weekly channel support extended from the low 0.6827; 07505; 0.7475; weekly AB=CD 161.8% Fib ext. point situated at 0.7496.
Resistances: 0.76 handle; 0.7695-0.7657.
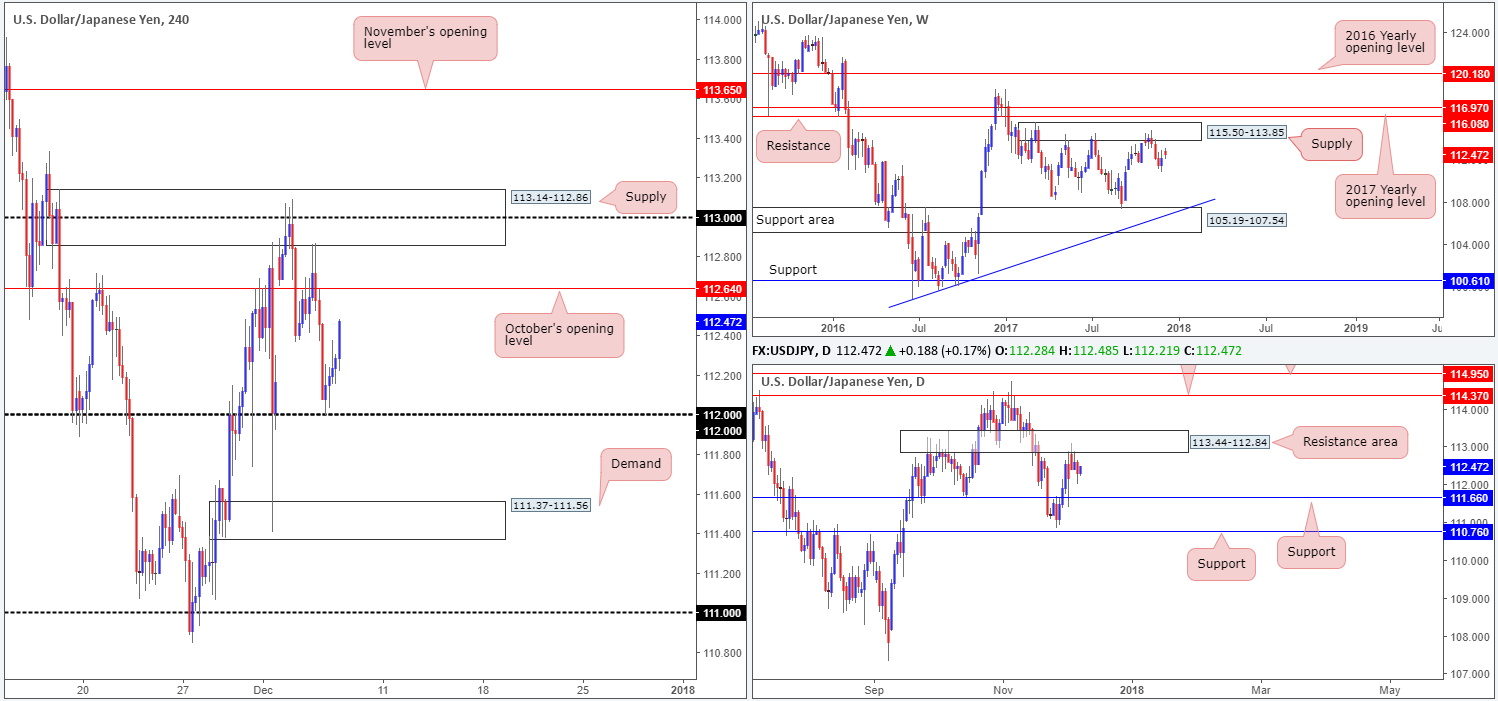
USD/JPY:
The USD/JPY came under pressure in early Asia on Wednesday, punching its way down to the 112 handle. Despite the strong push to the downside, 112 managed to hold firm and, with help from an upbeat US ADP report, reclaim some of the day’s losses.
H4 bulls seem to have a slight edge this morning, as the unit eyes October’s opening level seen on the H4 timeframe at 112.64. Breaking above this line, nevertheless, will likely be a challenge given the daily resistance area at 113.44-112.84 capping upside since Friday.
Direction: Buying this market at current prices may not be the best path to take. Not only is there no support on the H4 timeframe to base a trade from, there’s also the nearby H4/daily structures mentioned above to contend with.
A H4 close above October’s opening level would not help much either, since directly above this line is a clear base of H4 supply at 113.14-112.86 that’s bolstered by a round number at 113.
A sell from Oct’s open level could be an option. With that being said, though, there is a good chance that H4 price will fake through this level to reconnect with the aforesaid H4 supply base. So, waiting for additional candle confirmation could be an idea before pulling the trigger.
Data points to consider: US unemployment claims at 1.30pm; JPY final GDP q/q at 11.50pm GMT.
Areas worthy of attention:
Supports: 112 handle.
Resistances: 112.64; 113.14-112.86; 113.44-112.84.
USD/CAD:
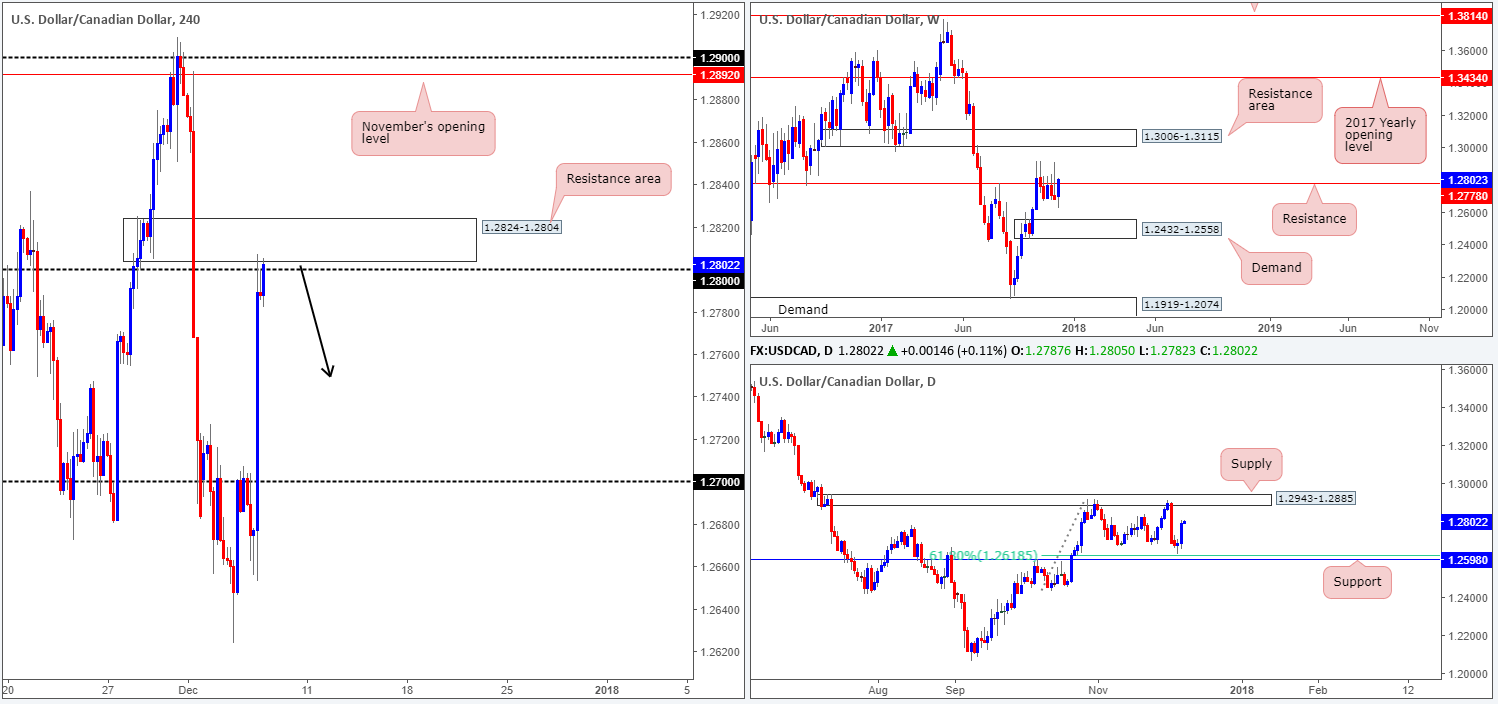
The USD/CAD gained some serious traction on Wednesday after the BoC released its monetary policy statement, leaving interest rates unchanged, as expected. The pair smashed through orders at the 1.27 handle and quickly rose to highs of 1.2772. Price continued to extend gains, consequently crossing swords with the 1.28 handle into the closing bell.
A H4 selling wick, as you can see, was printed from this number as price attempted to pare gains. Evidently, this hasn’t been enough to attract fresh sellers into the market yet as the current H4 candle is seen poking its head above 1.28 and testing the lower edge of a nearby H4 resistance area at 1.2824-1.2804.
The next upside target on the daily timeframe does not come into view until the daily supply zone printed at 1.2943-1.2885. Up on the weekly timeframe, however, weekly resistance at 1.2778 is back in the picture. This level has capped upside over the past four weeks and has significant history, so it is not a level to overlook.
Direction: Although daily price shows room to move higher, selling from the H4 resistance area/round number is an option. This is largely because of weekly price seen trading around a long-term weekly resistance level!
Data points to consider: US unemployment claims and CAD housing data at 1.30pm; CAD Ivey PMI at 3pm GMT.
Areas worthy of attention:
Supports: …
Resistances: 1.28 handle; 1.2824-1.2804; 1.2778; 1.2943-1.2885.
USD/CHF:
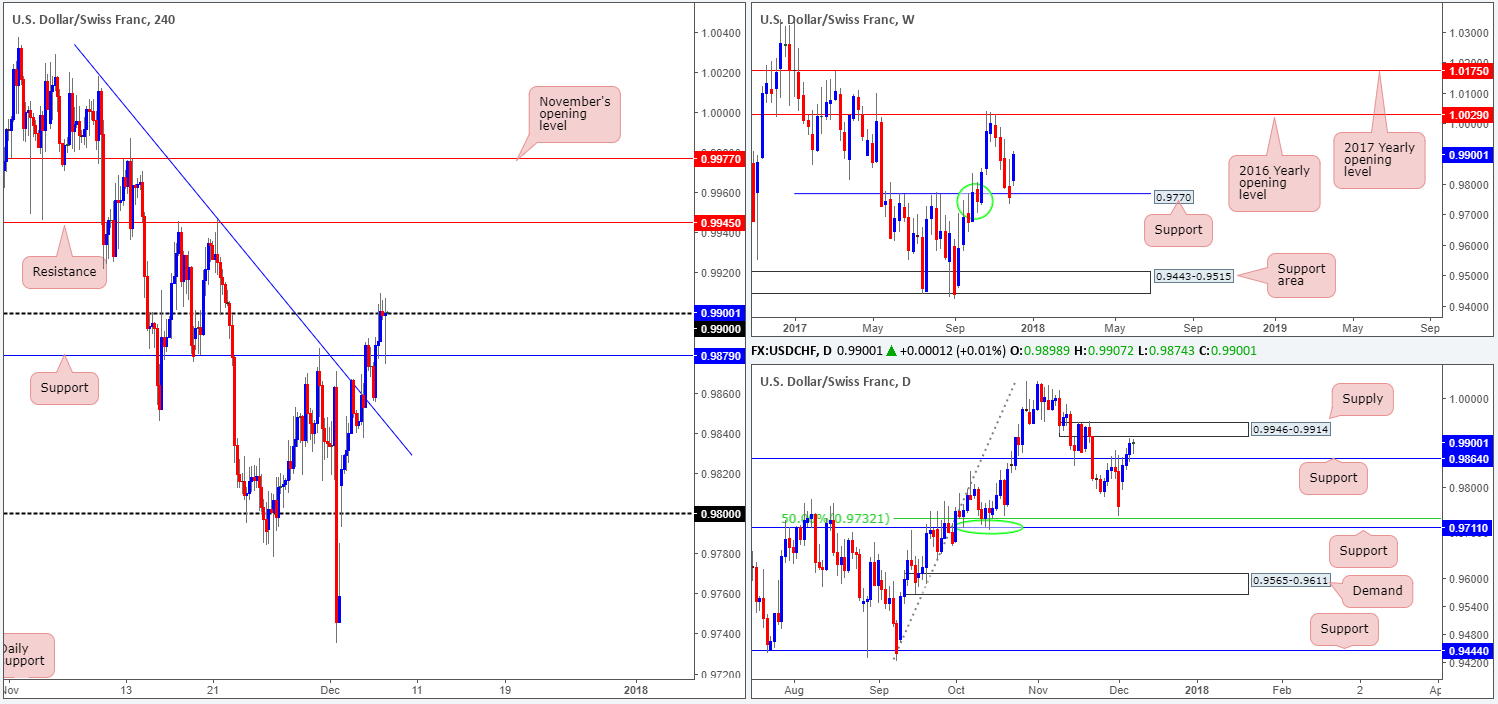
During the course of yesterday’s sessions, the USD/CHF managed to scramble above H4 resistance at 0.9879 and shake hands with the 0.99 handle. Numerous attempts to breach 0.99 were seen – the highest price was able to clock, however, was 0.9909. The retest of the recently broken resistance-turned H4 support may give the unit a helping hand today though!
While H4 buyers are eager for a break above 0.99 to confirm upside to the H4 resistance at 0.9945, daily sellers are likely eyeing the current daily supply zone at 0.9946-0.9914 as a potential sell zone. However, before that sell button is pushed, do remain aware that weekly price continues to probe higher after a recent test of weekly support at 0.9770. The other key thing to note is that weekly action also shows room to push as far north as the 2016 yearly opening level at 1.0029.
Direction: A buy above 0.99 look reasonable on both H4 and weekly structure, but disastrous on the daily timeframe. In fact, this appears to be setting H4 price up for a nasty fakeout above 0.99 given how close the lower edge of the daily supply is located above 0.99 (0.9914). A drive above 0.99 would fill a monumental amount of stop-loss orders, which then become buy orders, which is exactly what the big boys would need to sell the daily supply!
No matter which direction one selects, you’re going to be going up against higher-timeframe flow.
Data points to consider: US unemployment claims at 1.30pm GMT.
Areas worthy of attention:
Supports: 0.9879; 0.9770.
Resistances: 0.99 handle; 0.9945; 0.9946-0.9914.
DOW 30:
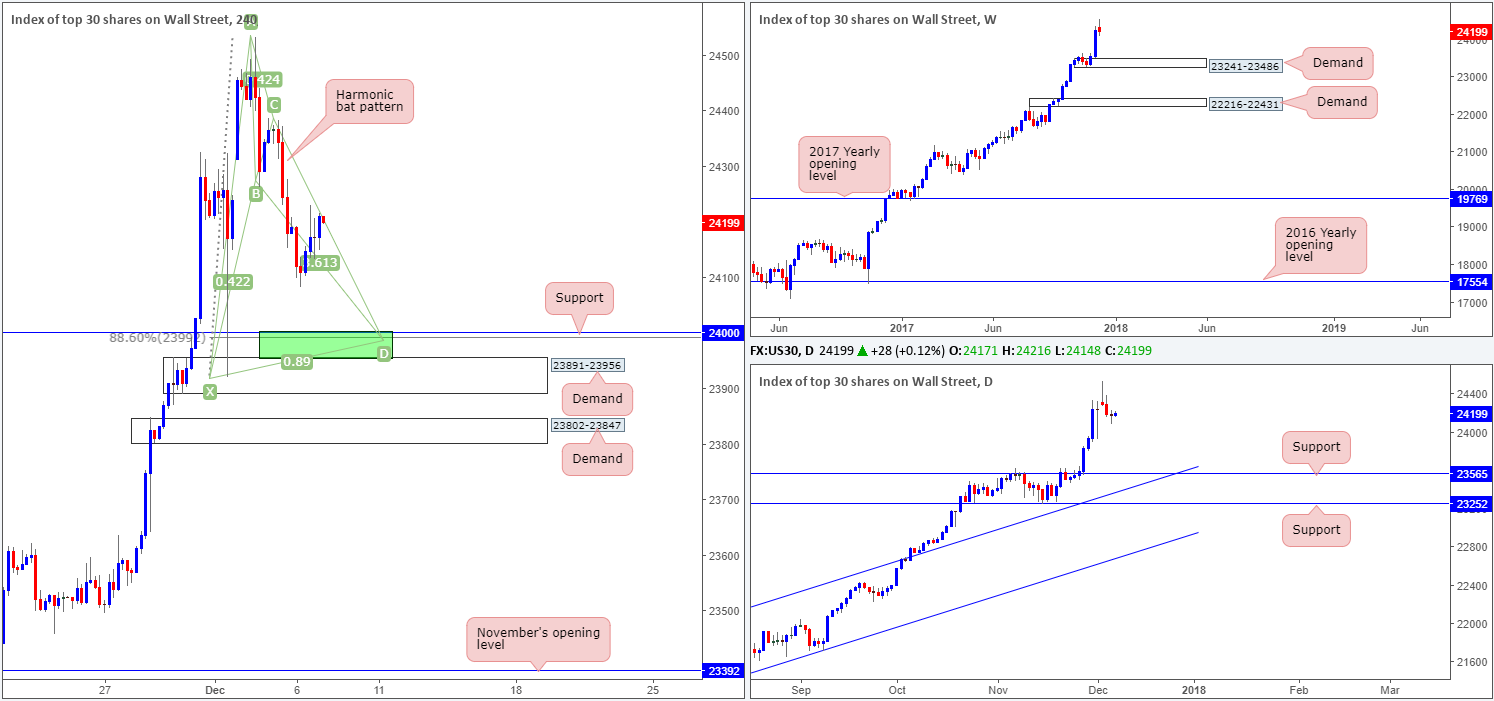
US equities extended losses in early trading on Wednesday, clocking a session low of 24081. Although the index ended the day marginally in the red (down 0.16%), H4 price managed to somewhat recoup the majority of the day’s losses off session lows.
As highlighted in Wednesday’s report, there’s a striking H4 harmonic bat pattern that completes around the 88.6% H4 Fib support at 23992 on the radar. As far as we can see this formation remains valid. Also worth remembering is that the harmonic completion point merges beautifully with the 24K round number and the top edge of a H4 demand at 23891-23956. The only drawback here is that the H4 harmonic pattern has absolutely no higher-timeframe confluence! The closest support can be seen on the daily timeframe at 23565.
Direction: Providing that the H4 harmonic bat pattern completes today, there’s a good chance that price action will bounce from here. One should pay attention to stop placement, however, since there is little stopping H4 price from faking below the upper H4 demand into the lower H4 base at 23802-23847.
Data points to consider: US unemployment claims at 1.30pm GMT.
Areas worthy of attention:
Supports: 24000; H4 88.6% Fib support at 23992 (harmonic completion point); 23891-23956; 23802-23847; 23565.
Resistances: …
GOLD:
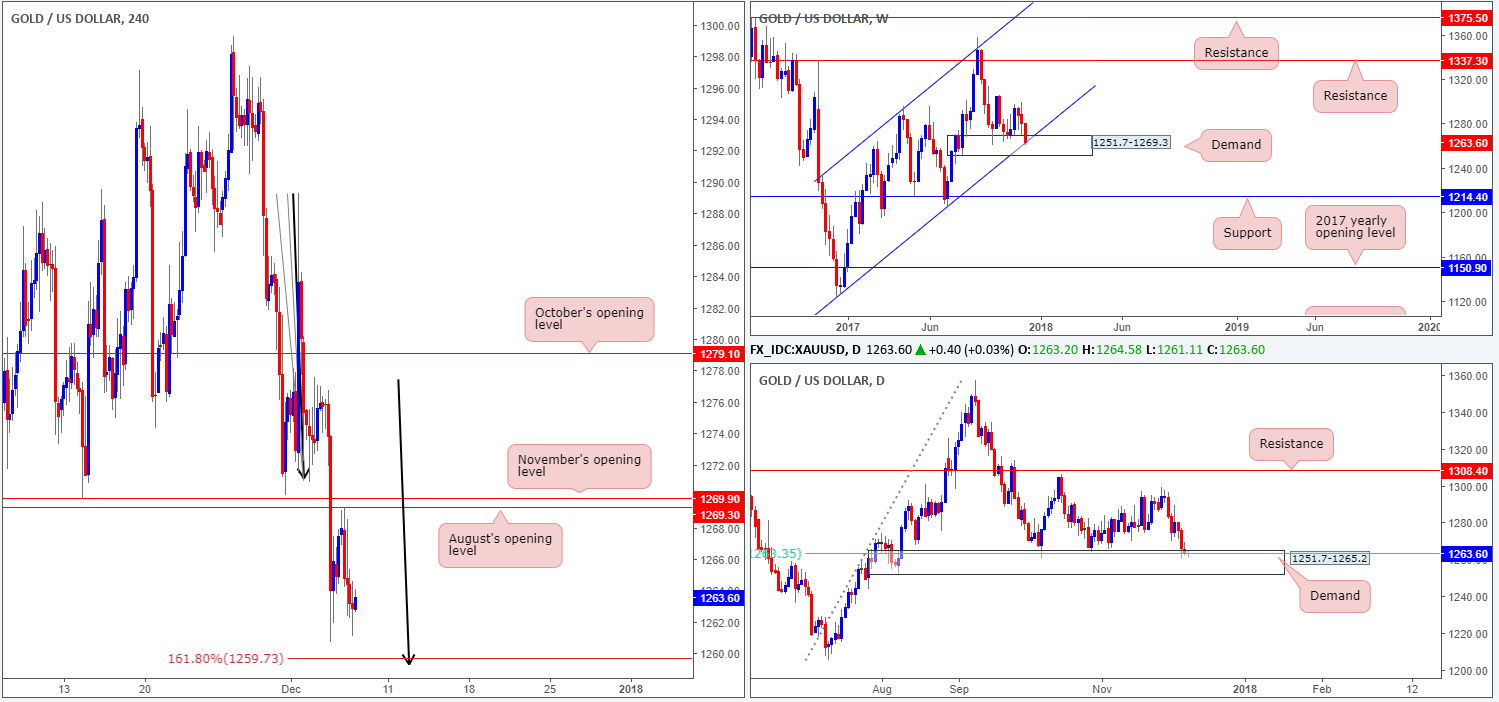
Gold prices are effectively unchanged this morning, down 0.17%. After tapping the underside of August’s opening level at 1269.3 during the early hours of London, the yellow metal pushed lower and ended the day basing just ahead of a H4 AB=CD (black arrows) 161.8% ext. point at 1259.7.
Weekly price recently entered the weekly demand base at 1251.7-1269.3 and is seen shaking hands with a weekly channel support etched from the low 1122.8. The ascending channel formation has been in motion for quite some time and on each occasion the limits have been challenged, it held beautifully. Therefore, history may repeat itself here. The daily candles are also seen interacting with a daily demand base drawn from 1251.7-1265.2, which is not only positioned within the lower limits of the weekly demand mentioned above, it also houses a 61.8% daily Fib support at 1263.3.
Direction: With a clear H4 AB=CD (black arrows) 161.8% ext. point nearby at 1259.7, this could be an ideal location to look for buying opportunities considering that its bolstered by both a weekly/daily demand and a weekly channel support! Just beyond the H4 AB=CD completion point, there’s also another layer of support traders may want to note at 1254.3: a H4 Quasimodo support formed back in early August (not seen on the screen).
A trade from the AB=CD completion allows one to position stop-loss orders beneath the current weekly demand – beautiful!
Areas worthy of attention:
Supports: H4 AB=CD 161.8% ext. point nearby at 1259.7; 1254.3; 1251.7-1265.2; 1251.7-1269.3; weekly channel support extended from the low 1122.8.
Resistances: 1269.3/1269.9. Technical outlook and review.


