
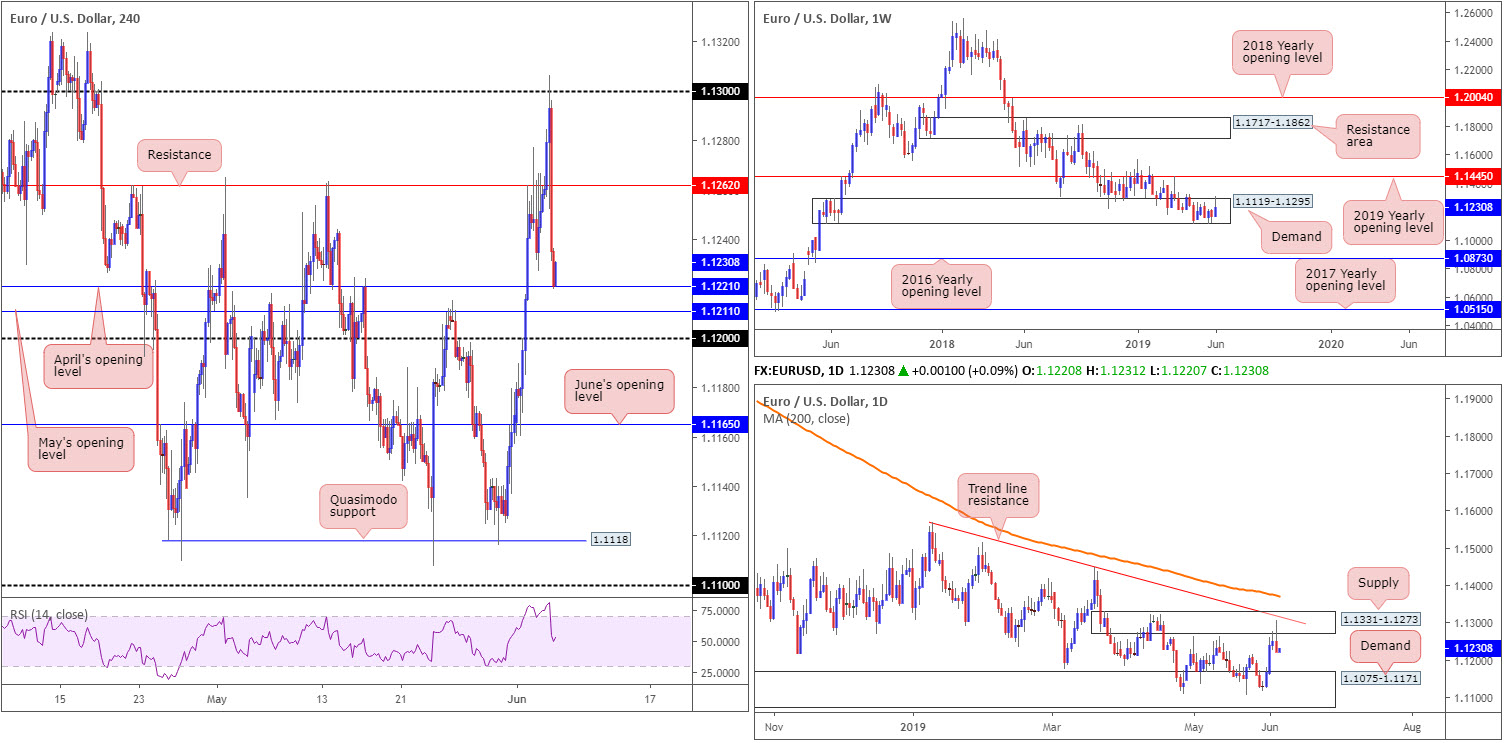
EUR/USD:
Wednesday witnessed additional USD selling materialise ahead of US trading, as Fed’s Brainard joined the dovish band and US ADP employment numbers reported less-than-stellar figures. Despite this, dollar bulls recovered amid hotter-than-expected ISM non-manufacturing data, lifting the index back above its 97.00 mark into the close. Note this action also formed a bullish engulfing pattern on the daily timeframe.
The EUR/USD pair, on the other hand, received fresh impetus on the back of upbeat Eurozone services PMIs in the early hours of London, though swiftly encountered strong opposition at the 1.13 hurdle. In one fell swoop, a near-full-bodied H4 bearish candle developed and overwhelmed 1.1262, now an acting resistance level. The day finished shaking hands with April’s opening level at 1.1221 on the H4 scale, which appears to be holding firm.
On more of a broader perspective, weekly action remains sited within a long-standing demand zone at 1.1119-1.1295. Upside from this point shows room for extension to as far north as the 2019 yearly opening level at 1.1445.
Daily supply at 1.1331-1.1273 elbowed its way into the spotlight recently, however, and produced a bearish engulfing configuration yesterday. Note price action missed the merging trend line resistance (extended from the high 1.1569) by only a few points. The next downside target from here can be seen at demand coming in at 1.1075-1.1171 (glued to the underside of the current weekly demand).
Areas of consideration:
Well done to any of our readers who managed to jump aboard the short from 1.13 – this was a noted barrier to watch for selling opportunities in Wednesday’s brief.
Aside from the above, it appears the market is somewhat mixed in terms of technical direction at the moment. Weekly price suggests further buying from a structural standpoint: demand at 1.1119-1.1295 (though do remain cognizant of the overall trend facing a southerly bearing), while daily flow portends a move lower on the back of supply at 1.1331-1.1273 (and the bearish engulfing pattern). To top it off, H4 movement is rebounding from support at 1.1221, shadowed closely by additional layers of support at 1.1211 (May’s opening level) and the round number 1.12.
On account of the above, the research team believes neither a long nor short seems attractive at this time. Irrespective of the direction selected, strong opposition is seen.
Today’s data points: ECB Monetary Policy Statement and Main Refinancing Rate; ECB Press Conference; FOMC Member Williams Speaks.
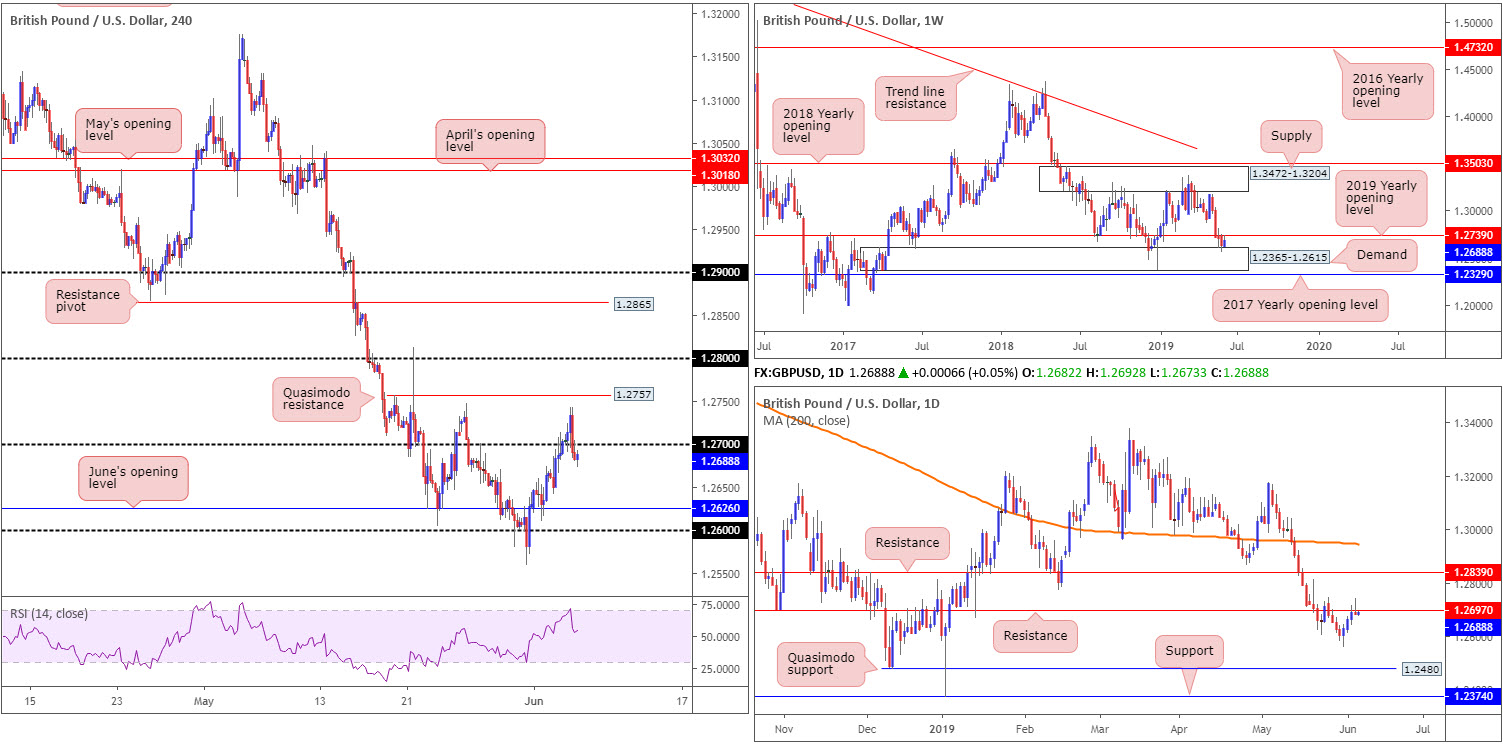
GBP/USD:
Bolstered by a waning dollar (Fed’s Brainard joined the dovish band and US ADP employment numbers reported less-than-stellar figures), GBP/USD bulls went on the offensive during London’s morning session Wednesday, respecting the top edge of 1.27, though unfortunately failed to sustain gains beyond 1.2743.
As can be seen from the daily chart this morning, price action turned lower from the aforementioned high and reclaimed resistance at 1.2697 by way of a clear-cut hammer formation. Further selling from here has the 1.2558 May 31 low to contend with, followed by a Quasimodo support at 1.2480. Yesterday’s downside move was also weighed on by weekly resistance in the shape of a 2019 yearly opening level at 1.2739, after finding support off a nearby demand at 1.2365-1.2615 earlier this week.
With the 1.27 handle on the H4 timeframe likely to serve as resistance today, June’s opening level at 1.2626 appears inviting as the next downside objective. Note H4 price already retested the underside of this number in the form of a moderate selling wick. This – coupled with both weekly and daily resistances in view – may call for the unit to explore lower ground today.
Areas of consideration:
Shorts, according to our technical studies, appear high-probability, targeting June’s opening level at 1.2626 on the H4 timeframe as the initial port of call. Entry at current price is an option, with a protective stop-loss order positioned above either 1.2704 or yesterday’s high 1.2743 (the latter is, of course, the more conservative approach).
Today’s data points: BoE Gov. Carney speaks; FOMC Member Williams Speaks.
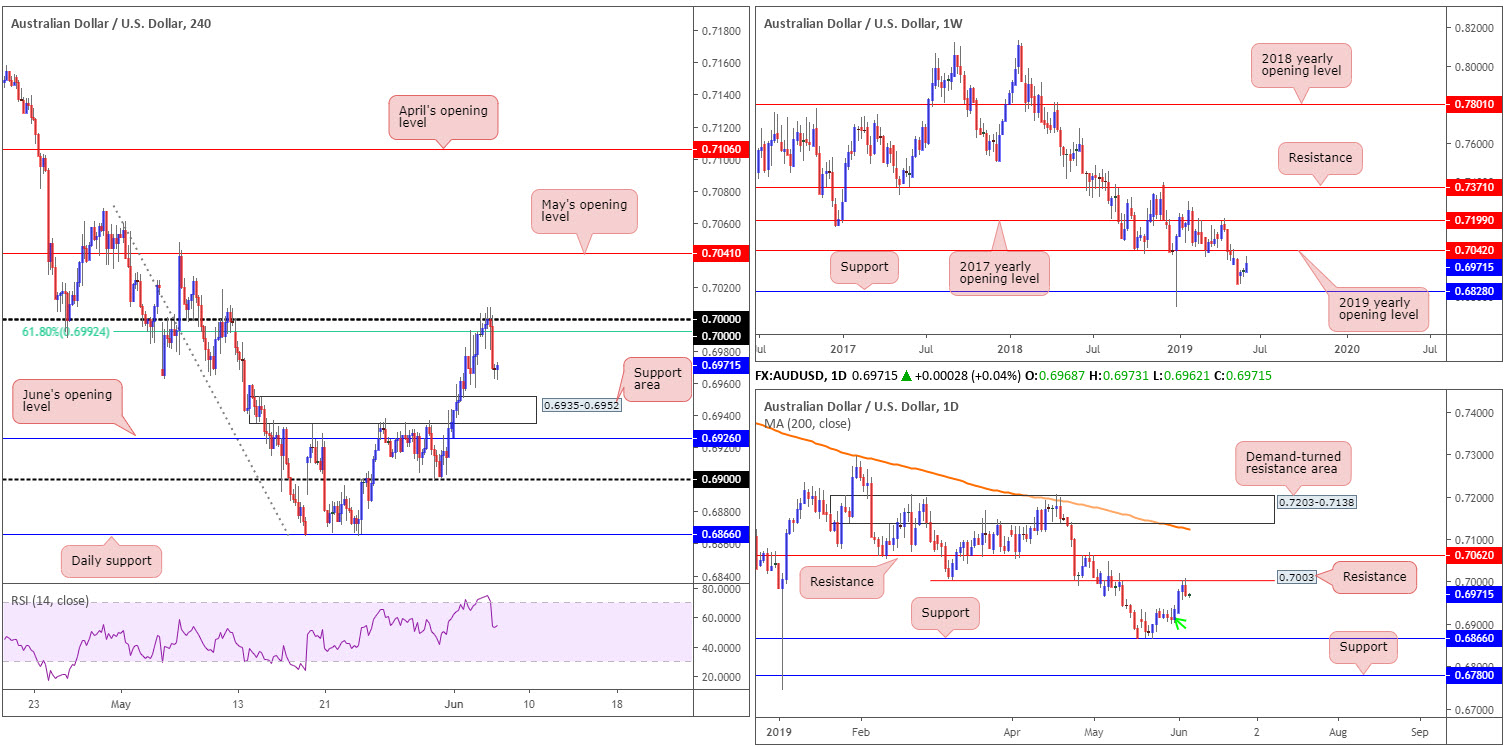
AUD/USD:
0.70, as anticipated, held ground Wednesday amid a stronger dollar in US hours.
0.70 was a noted level to watch for in Wednesday’s technical briefing:
Technically speaking, the AUD/USD concluded Tuesday’s segment crossing swords with key figure 0.70 on the H4 chart, which, according to the research team, is a potential sell zone. Merging closely with a 61.8% H4 Fibonacci resistance value at 0.6992, chalking up a H4 shooting star pattern and aligning closely with daily resistance offering a potential ceiling close by at 0.7003, this area likely has active sellers in waiting. What’s also notable from a technical perspective is the clear-cut downtrend since early 2018 and the H4 RSI indicator visibly testing overbought waters.
Unfortunately, H4 price engulfed the shooting star pattern prior to turning lower, likely tripping protective stop-loss orders – well done to any of our readers who managed to withstand the move to 0.7007. The next downside hurdle on the H4 scale – the first take-profit target for sellers – falls in around the support area coming in at 0.6935-0.6952, shadowed closely by June’s opening level at 0.6926.
Daily price, after crossing swords with resistance at 0.7003, has support in view at 0.6866. Some traders may target demand marked with a green arrow around the 0.6935ish region, though this area failed to produce much from its base, therefore limiting its position somewhat. In other words, it engulfed little structure to the left.
The only drawback to further downside, however, is weekly price appears poised to drive above 0.70 and approach the 2019 yearly opening level at 0.7042.
Areas of consideration:
Sellers from 0.70 may want to consider reducing risk to breakeven at this point, as weekly buyers still have a hand in this fight (see above). Letting a winning position turn into a losing position is never fun.
Aside from the short out of the 0.70 region, the research team see little else to hang their hat on in terms of high-probability trading opportunities today.
Today’s data points: Australian Trade Balance; FOMC Member Williams Speaks.
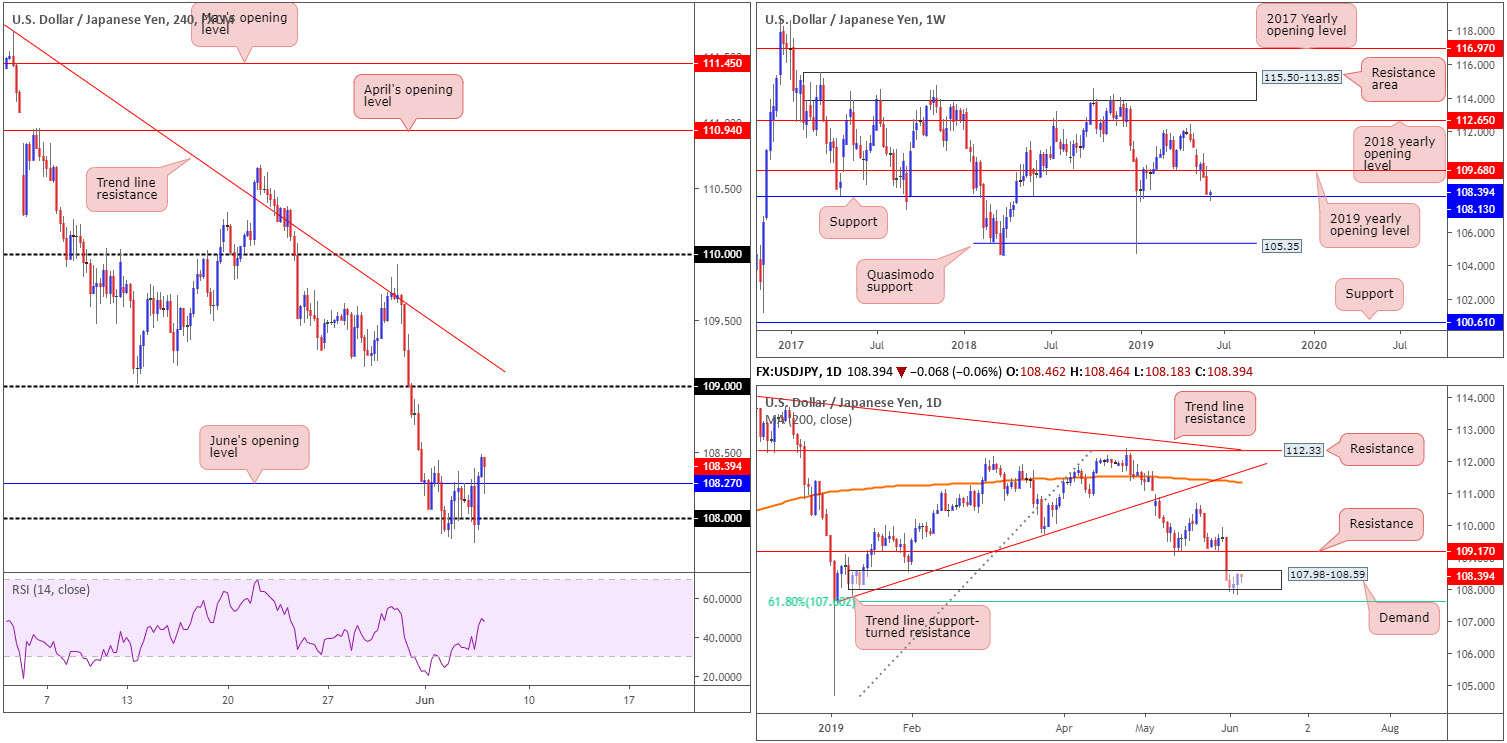
USD/JPY:
In spite of US ADP employment data missing expectations by a wide margin, and Fed’s Brainard adding to the dovish tone, dollar bulls recovered amid better-than-expected ISM non-manufacturing data Wednesday, lifting the US dollar index back above its 97.00 mark by the day’s end.
Strengthened on the back of broad-based USD bidding, the US dollar advanced against its Japanese counterpart from the 108 handle on the H4 timeframe and, in recent hours, dethroned June’s opening level sited at 108.27. Note also the unit is currently retesting 108.27 in the shape of a nice-looking buying wick (candle has yet to close, however).
Supporting the bullish tone, higher-timeframe structure shows weekly activity respecting support at 108.13, with the possibility of further buying towards the 2019 yearly opening level at 109.68. Although daily price recently breached the lower edge of demand at 107.98-108.59, yesterday’s movement sculpted a notable bullish engulfing configuration, potentially setting the stage for a move in the direction of resistance at 109.17.
Areas of consideration:
Having seen all three timeframes, structurally speaking, suggest additional buying could be in store, traders are encouraged to wait and see how the current H4 candle closes. A close in its current form could, in light of the overall technical picture, draw in buyers and attempt an approach towards the 109 handle, trailed closely by daily resistance highlighted above at 109.17.
Entry at either the close of the candle or on the break of the candle high is certainly an option (the latter is deemed the more conservative route), with a protective stop-loss order positioned beneath the lower shadow (108.18).
Today’s data points: FOMC Member Williams Speaks; BoJ Gov. Kuroda Speaks.
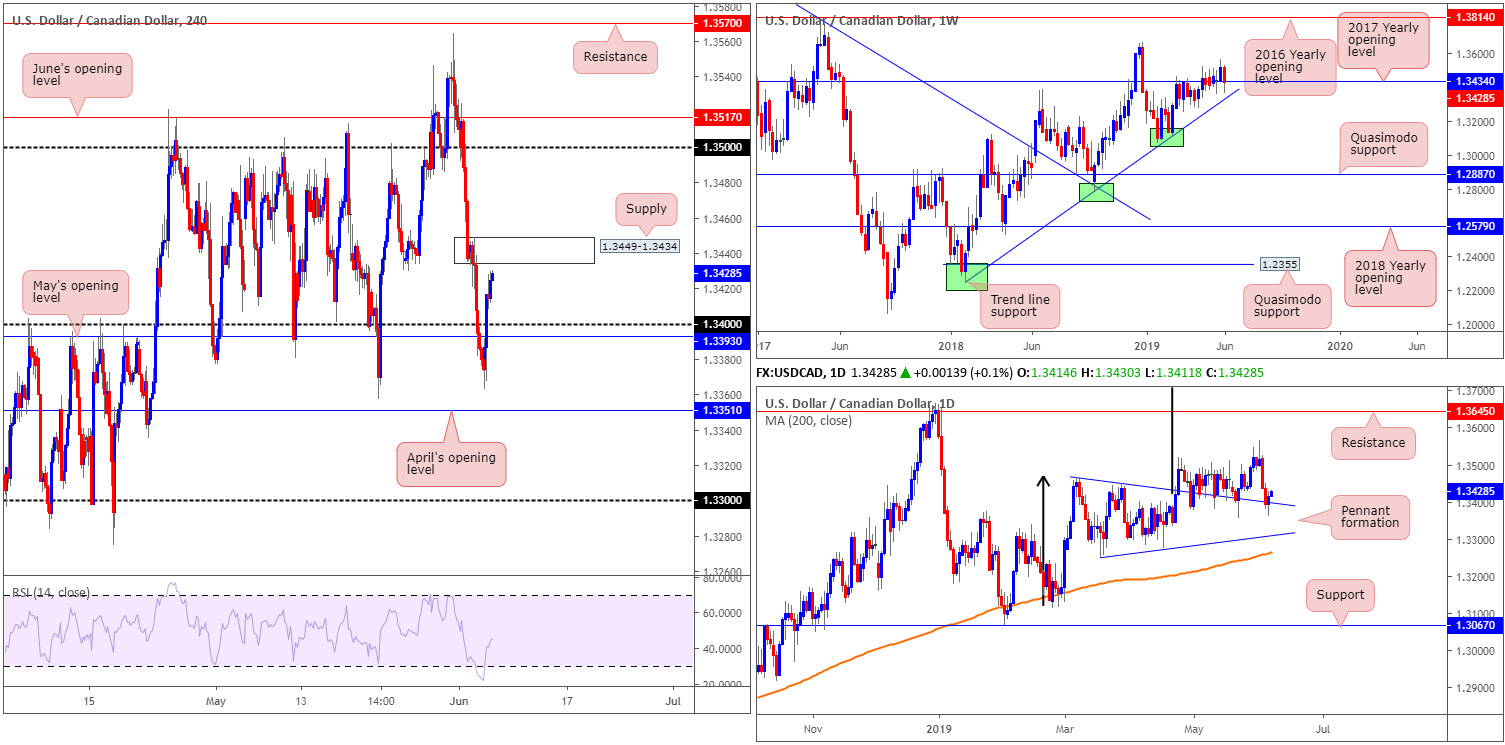
USD/CAD:
Recent movement witnessed WTI prices decline more than 2.00% and the US dollar index reclaim 97.00 to the upside amid hotter-than-expected ISM non-manufacturing data. In view of this, the USD/CAD trades strongly above 1.34 as we head into Asia Pac hours.
Although H4 supply at 1.3449-1.3434 is likely to offer a base of resistance, the research team feels the zone will likely be overwhelmed by higher-timeframe buying. Weekly price is seen trying to defend the 2017 yearly opening level at 1.3434 (which is actually the lower edge of the current H4 supply). Closer analysis of the daily timeframe also shows price action defending support in the form of a pennant pattern (1.3467). For the past month, price action has been feeding off this level. Assuming the barrier holds once again, the traditional price target (calculated by taking the distance from the beginning of the preceding move and adding it to the breakout price) remains on the chart at 1.3768 (black arrows), though the next upside target from a structural standpoint falls in around resistance at 1.3645.
Areas of consideration:
In the event the higher-timeframe reading is correct, H4 action will likely engulf the supply at 1.3449-1.3434 and perhaps unlock the door to 1.35. A H4 close above 1.3449-1.3434, therefore, that’s followed up with a retest (preferably in the shape of a notable bullish candlestick formation – entry and risk can be determined according to this structure) would, according to the overall technical landscape, likely be considered a high-probability short-term buying opportunity to 1.35.
Today’s data points: FOMC Member Williams Speaks; Canadian Trade Balance.
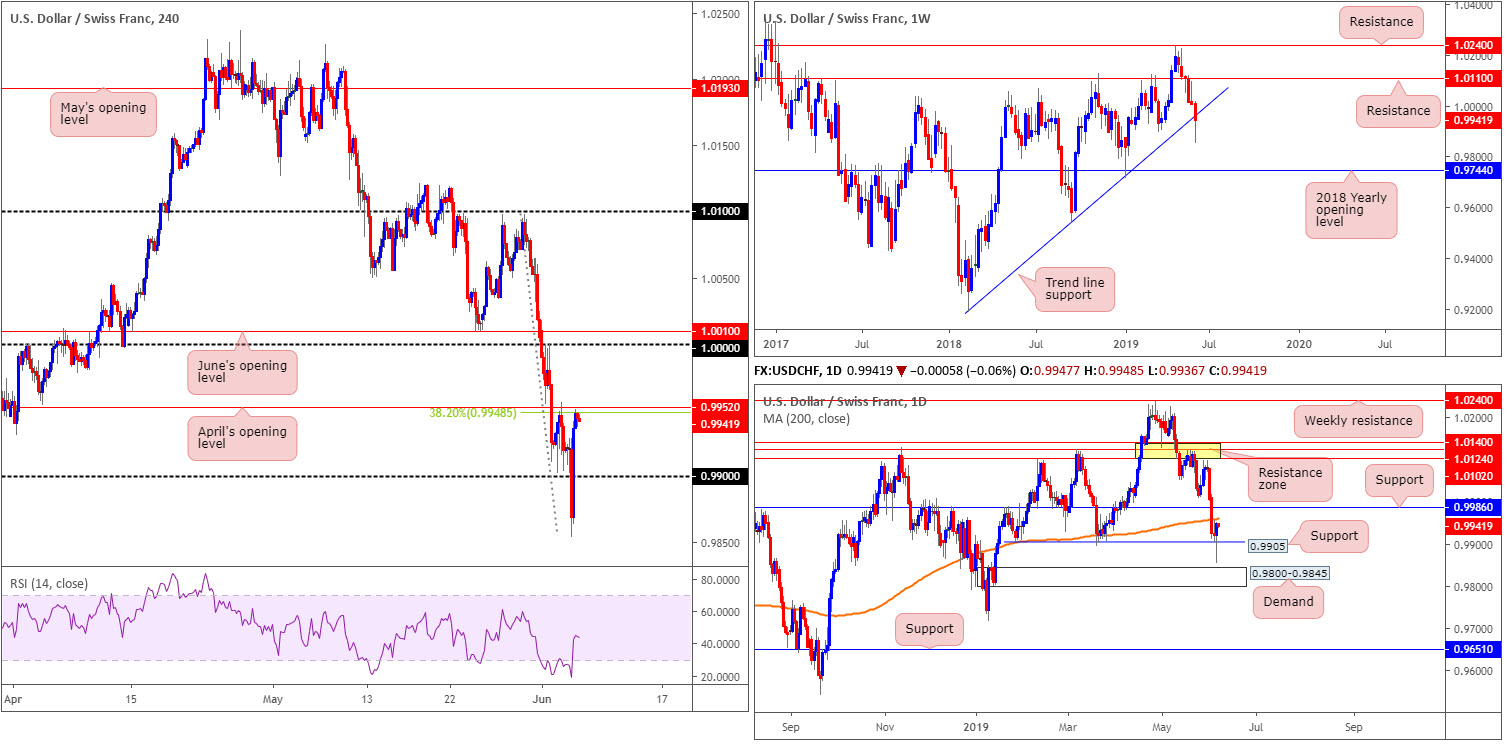
USD/CHF:
In recent sessions, USD/CHF movement rebounded from fresh 4-month lows at 0.9853 amid a flurry of USD bidding, consequently drawing the US dollar index north of 97.00.
0.99, on the H4 timeframe, elbowed its way back into the spotlight Wednesday, with the candles consolidating gains just south of April’s opening level at 0.9952 (testing the 38.2% Fibonacci resistance value at 0.9948). Overhead, the research team notes the key figure 1.0000 (parity) as viable resistance, closely trailed by June’s opening level at 1.0010.
Turning to the higher timeframes, support on the daily timeframe at 0.9905 survived a monstrous whipsaw yesterday and concluded the session in the shape of a strong buying wick. While this may excite buyers, traders are urged to pencil in the 200-day SMA lurking just ahead around 0.9960.
The story on the weekly timeframe, nevertheless, shows the current candle remains south of trend line support etched from the low 0.9187. In the event we reclaim this boundary, the next area to the upside can be seen around 1.0110.
Areas of consideration:
While we are coming from daily support at 0.9905, H4 resistance at 0.9952, alongside the 38.2% Fibonacci resistance at 0.9948 and the 200-day SMA at 0.9960, may provide a platform for sellers to initiate shorts from today, targeting 0.99 as the initial take-profit zone. Adding to the bearish vibe, let’s remember weekly price is trading beneath trend line support.
In order to help avoid a whipsaw above 0.9952, traders are urged to consider waiting for additional H4 candlestick confirmation before pulling the trigger. Not only does this help prove seller intent, it also provides entry and risk levels to work with, too.
Today’s data points: FOMC Member Williams Speaks.
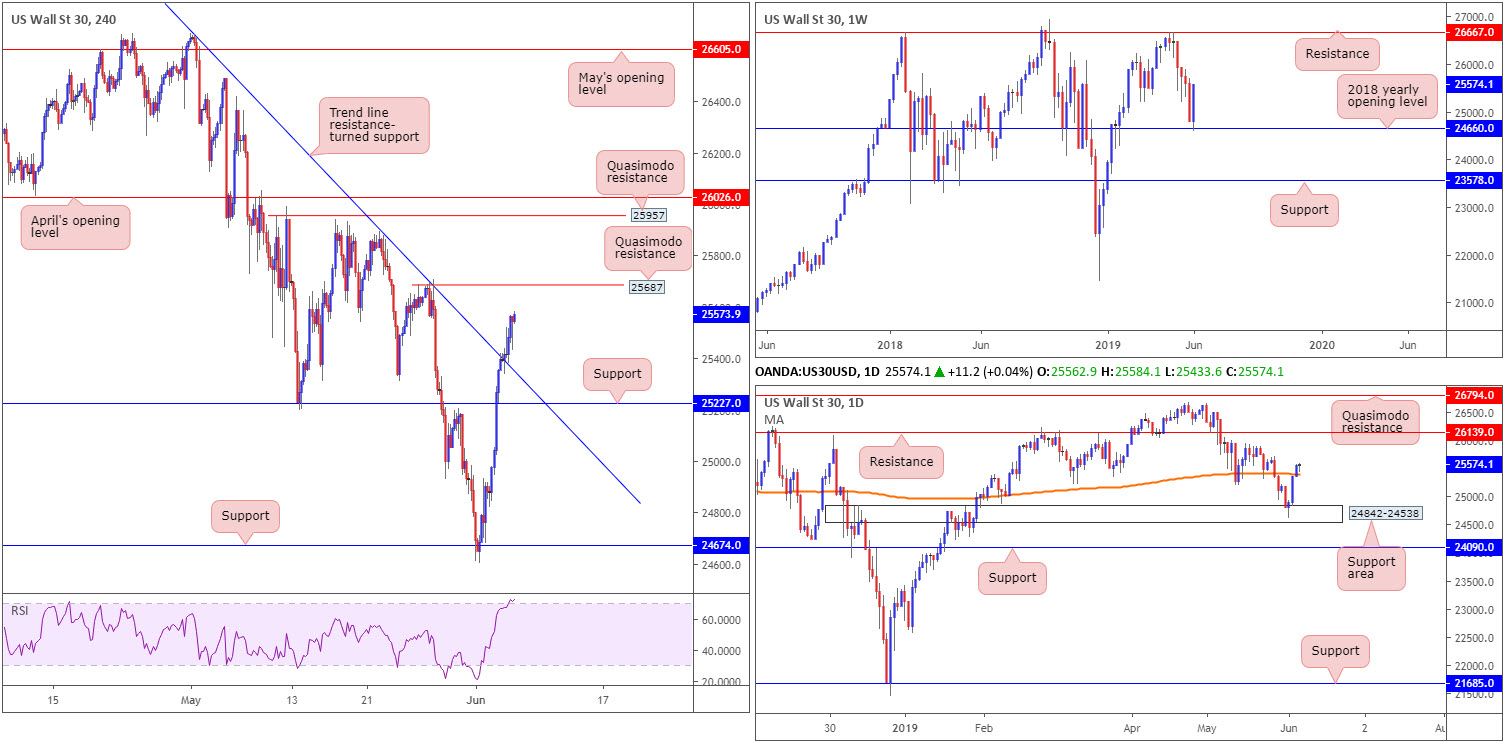
Dow Jones Industrial Average:
US equities extended gains Wednesday as investors further embraced the possibility the Federal Reserve might cut interest rates to boost the economy. The Dow Jones Industrial Average added 0.82%, while the S&P 500 also gained 0.82% along with the tech-heavy Nasdaq 100 advancing 0.76%.
Technically speaking, additional buying could be on the table, according to the weekly timeframe’s structure. The index displays room to continue pressing higher from the 2018 yearly opening level at 24660, to as far north as resistance coming in at 26667. In conjunction with weekly direction, daily price recently crossed above its 200-day SMA and exhibits scope to advance to resistance plotted at 26139.
A closer reading of price action on the H4 timeframe has the candles travelling north of a trend line resistance extended from the high 26663, targeting a test of Quasimodo resistance at 25687. Beyond this point we also have another layer of Quasimodo resistance at 25957.
Areas of consideration:
As both weekly and daily timeframes point to further upside, selling from the H4 Quasimodo resistance at 25687 is a chancy move. Therefore, unless we pullback to test H4 support at 25227, the research team will be looking for a break above 25687. In the event our analysis comes to fruition, this opens the door to potential buying opportunities, targeting H4 Quasimodo resistance at 25957. Whether a trader simply enters long on the breakout candle (and positions the protective stop-loss order beneath the lower shadow) or waits and sees if the unit retests 25687 as support before pulling the trigger is, of course, trader dependant.
Today’s data points: FOMC Member Williams Speaks.
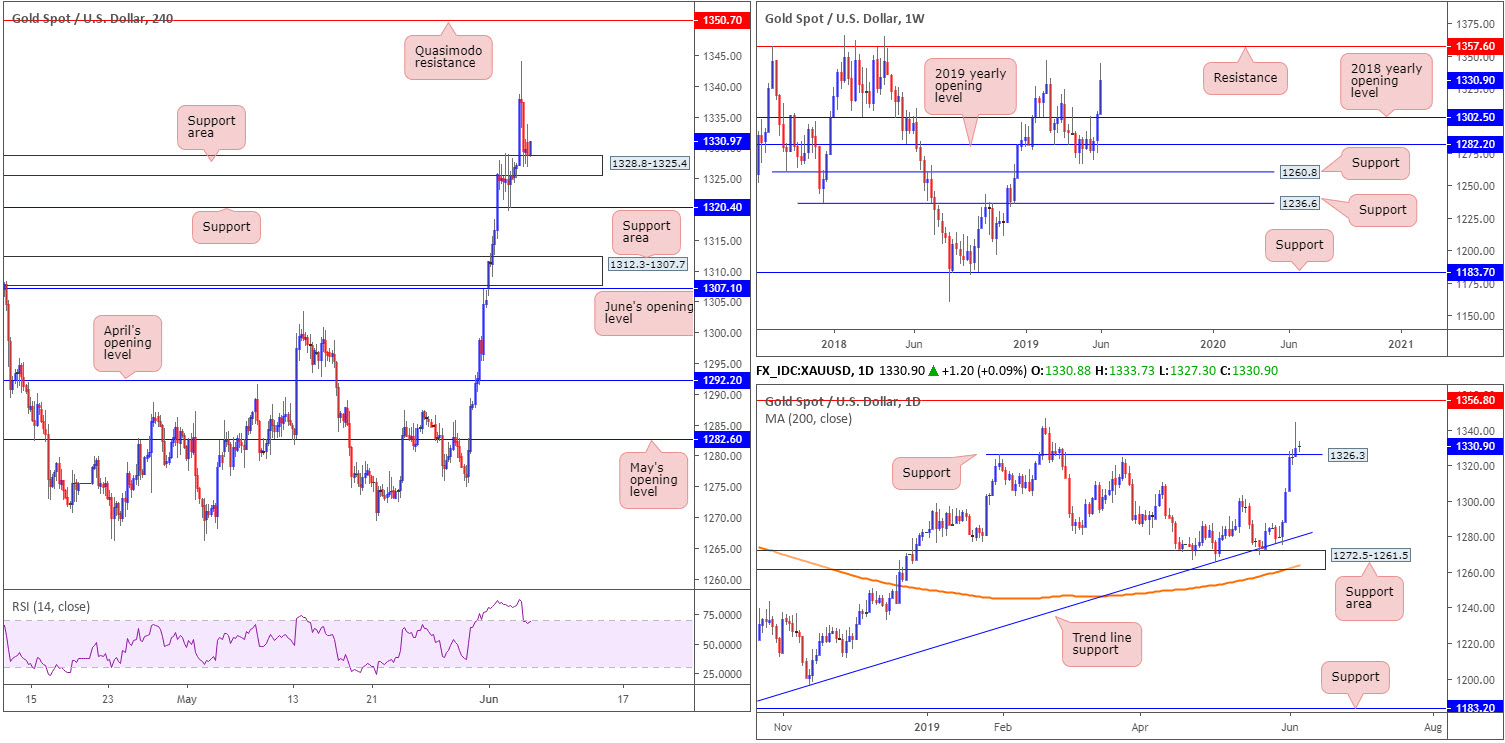
XAU/USD (GOLD):
Having seen the US dollar index whipsaw back above 97.00 Wednesday, the daily price of gold mirrored the movement, only inverse from a session high of 1344.0. Traditionally, this is considered to be a shooting star formation, generally attracting sellers into the market, though with daily support lurking nearby at 1326.3, sellers may struggle.
Across on the H4 timeframe, traders can see price action stalled into the later stages of yesterday, consolidating within a support area coming in at 1328.8-1325.4. Another layer of support beyond the said zone can be seen close by at 1320.4, while to the upside we have yesterday’s session high 1344.0 to contend with as potential resistance on this timeframe, followed by Quasimodo resistance fixed at 1350.7.
Areas of consideration:
Overall, the research team is bullish the yellow metal out of the current H4 support area at 1328.8-1325.4. However, with the H4 RSI exiting overbought status, confirming buyer intent is necessary. A notable bullish rotation candle would suffice – that is a near or full-bodied H4 bull candle printed from 1328.8-1325.4 (a close at current price would be ideal, in fact. Entry at the close of the candle is one option, with protective stop-loss order plotted either beneath the lower shadow of the rejecting candle or beneath the H4 support area.
The accuracy, completeness and timeliness of the information contained on this site cannot be guaranteed. IC Markets does not warranty, guarantee or make any representations, or assume any liability with regard to financial results based on the use of the information in the site.
News, views, opinions, recommendations and other information obtained from sources outside of www.icmarkets.com.au, used in this site are believed to be reliable, but we cannot guarantee their accuracy or completeness. All such information is subject to change at any time without notice. IC Markets assumes no responsibility for the content of any linked site. The fact that such links may exist does not indicate approval or endorsement of any material contained on any linked site.
IC Markets is not liable for any harm caused by the transmission, through accessing the services or information on this site, of a computer virus, or other computer code or programming device that might be used to access, delete, damage, disable, disrupt or otherwise impede in any manner, the operation of the site or of any user’s software, hardware, data or property.


