
Key risk events today:
ECB President Lagarde Speaks; EU Economic Forecasts; RBA Gov Lowe Speaks.
(Previous analysis as well as outside sources – italics).
EUR/USD:
The US dollar index (DXY) continued to flex its financial muscle Wednesday, strengthened on the back of upbeat data across the board. According to Automatic Data Processing (ADP), private-sector employment increased by 291,000 from December to January, on a seasonally adjusted basis. In addition to this, the ISM non-manufacturing reading observed a gain in January, though to a lesser extent than its manufacturing counterpart released Monday. The Institute for Supply Management (ISM) noted: the NMI registered 55.5 percent, which is 0.6 percentage point higher than the seasonally adjusted December reading of 54.9 percent. This represents continued growth in the non-manufacturing sector, at a slightly faster rate.
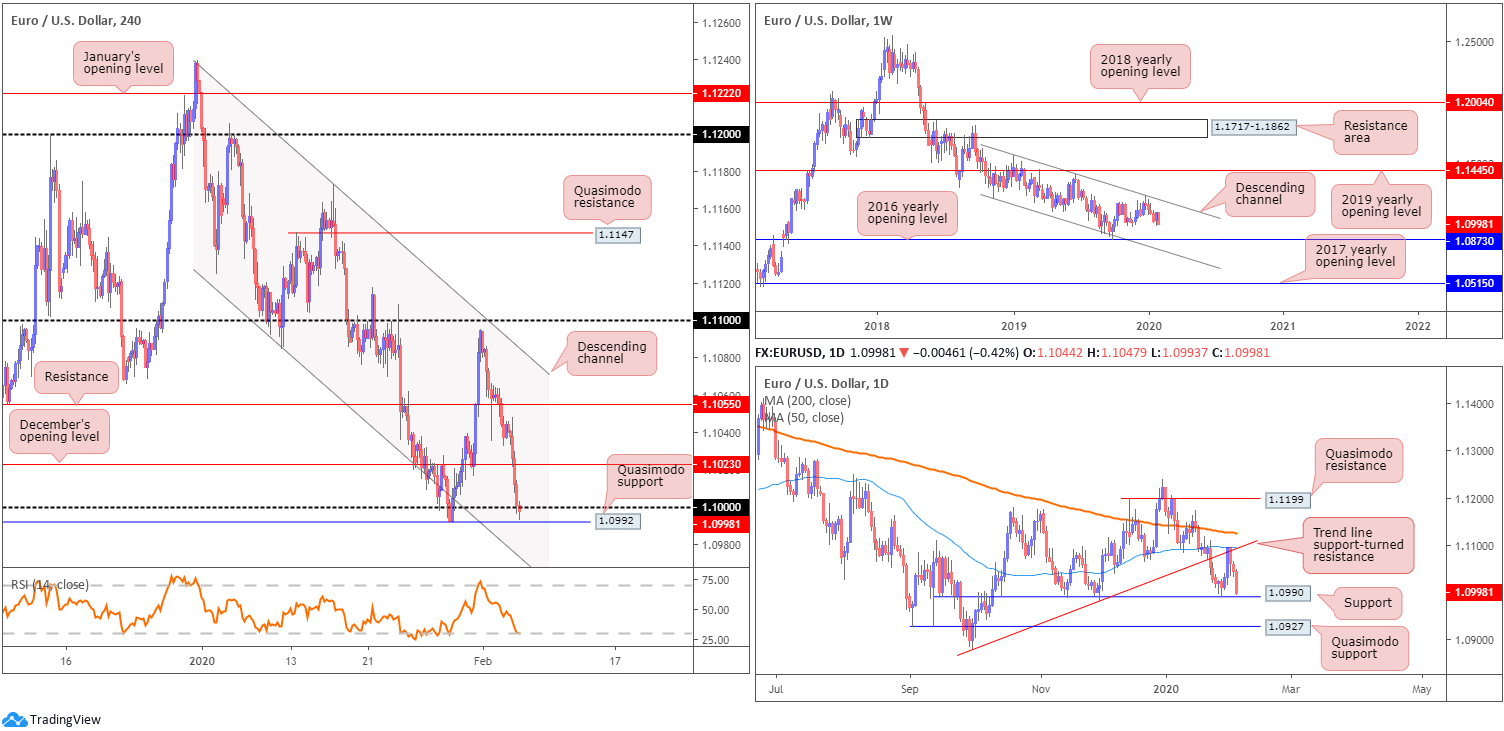
The DXY is poised to tackle daily resistance coming in at 98.45, while EUR/USD tunnelled through the key figure 1.10.
Structurally, the weekly timeframe remains unchanged. Price is seen languishing beneath long-standing channel resistance, drawn from the high 1.1569. Downside targets rest at the 2016 yearly opening level from 1.0873 followed by channel support, taken from the low 1.1109. Further supporting sellers is the primary trend, down since topping in early 2018, at 1.2555.
Daily trend line support-turned resistance, taken from the low 1.0879, and the 50-day SMA (blue – 1.1094), proved valuable resistance, down nearly 100 points and erasing last week’s gains. Support plotted nearby at 1.0990, capped downside since mid-October 2019, is next on tap, with a break underlining Quasimodo support drawn from 1.0927.
A closer reading of price action on the H4 timeframe has buyers and sellers squaring off around the key figure 1.10, stationed a few points north of Quasimodo support at 1.0992. Beyond here, channel support, extended from the low 1.1085, is in sight. It might also interest some traders to note the relative strength index (RSI) is testing oversold waters.
Areas of consideration:
The combination of the 1.10 handle on the H4 and Quasimodo support at 1.0992, along with the RSI touching oversold territory and daily support priced at 1.0990, is likely enough to encourage buyers. The threat of further selling on the weekly timeframe, however, is problematic.
Waiting for a H4 bullish candlestick signal to form off 1.10, prior to pulling the trigger, could, therefore, be an idea. Entry and risk can then be calculated according to the pattern’s framework.
GBP/USD:
The British pound wrapped up lower against the US dollar Wednesday, and remains down more than 1.50% on the week so far. GBP/USD dipped its toe in waters above Asia’s narrow range amid early Europe, rallying to highs of 1.3070ish on a better-than-expected UK final services PMI read. Markit noted: At 53.9 in January, up from 50.0 in December, the seasonally adjusted IHS Markit/CIPS UK Services PMI Business Activity Index registered in expansion territory for the first time since last August. The latest reading was the highest for 16 months and above the earlier ‘flash’ estimate of 52.9 in January, to signal a solid increase in service sector output.
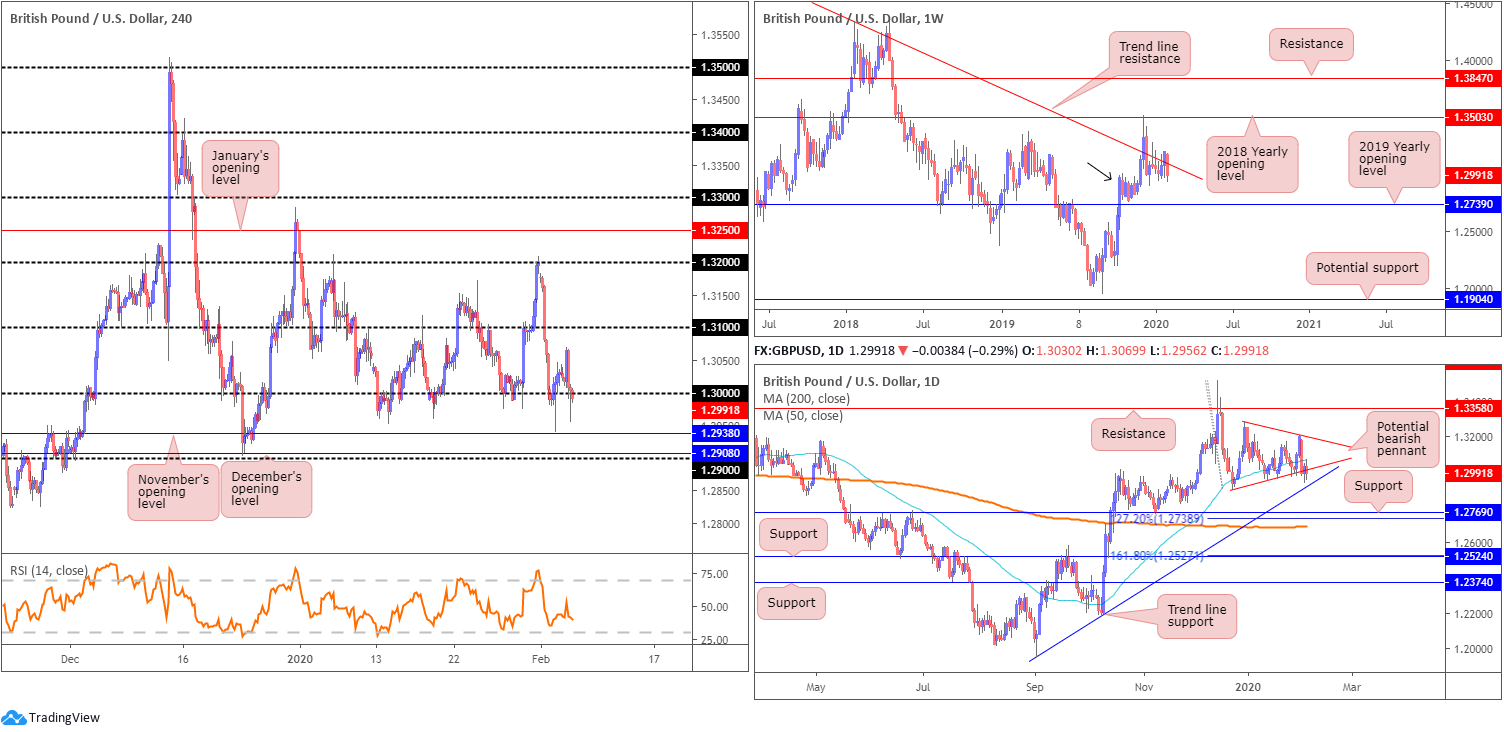
Early US trading, nevertheless, witnessed the pair veer lower, pressured by optimistic US data, including ADP employment and ISM non-manufacturing PMI. Buyers and sellers are, as of writing, battling for position around the key figure 1.30 on the H4 timeframe. The next layer of support falls in close by at November’s opening level drawn from 1.2938 and December’s opening level at 1.2908 and 1.29. Above 1.30, on the other hand, 1.31 represents probable resistance.
Price action on the weekly timeframe trades beneath long-standing trend line resistance, pencilled in from the high 1.5930, though demand around the 1.2939 region is also in motion (black arrow).
The story on the daily timeframe has the unit fading the underside of the 50-day SMA (blue – 1.3068), and is attempting to overthrow the lower edge of a bearish pennant pattern, extended from a high of 1.3284 and a low of 1.2904. Also of note is the nearby trend line support, taken from the low 1.1958, with a violation potentially setting the stage for a run to support fixed at 1.2769 and a 127.2% Fibonacci extension at 1.2738.
Areas of consideration:
Traders are urged to tread carefully in regards to selling the break of the daily bearish pennant formation. Not only do we have daily trend line support close by, weekly demand is also in the frame (1.2939). However, should a H4 close south of 1.30 materialise, followed up with a retest as resistance, preferably in the shape of a bearish candlestick pattern, a sell might still be worthy of consideration to at least November’s opening level at 1.2938, which merges closely with the current daily trend line support.
AUD/USD:
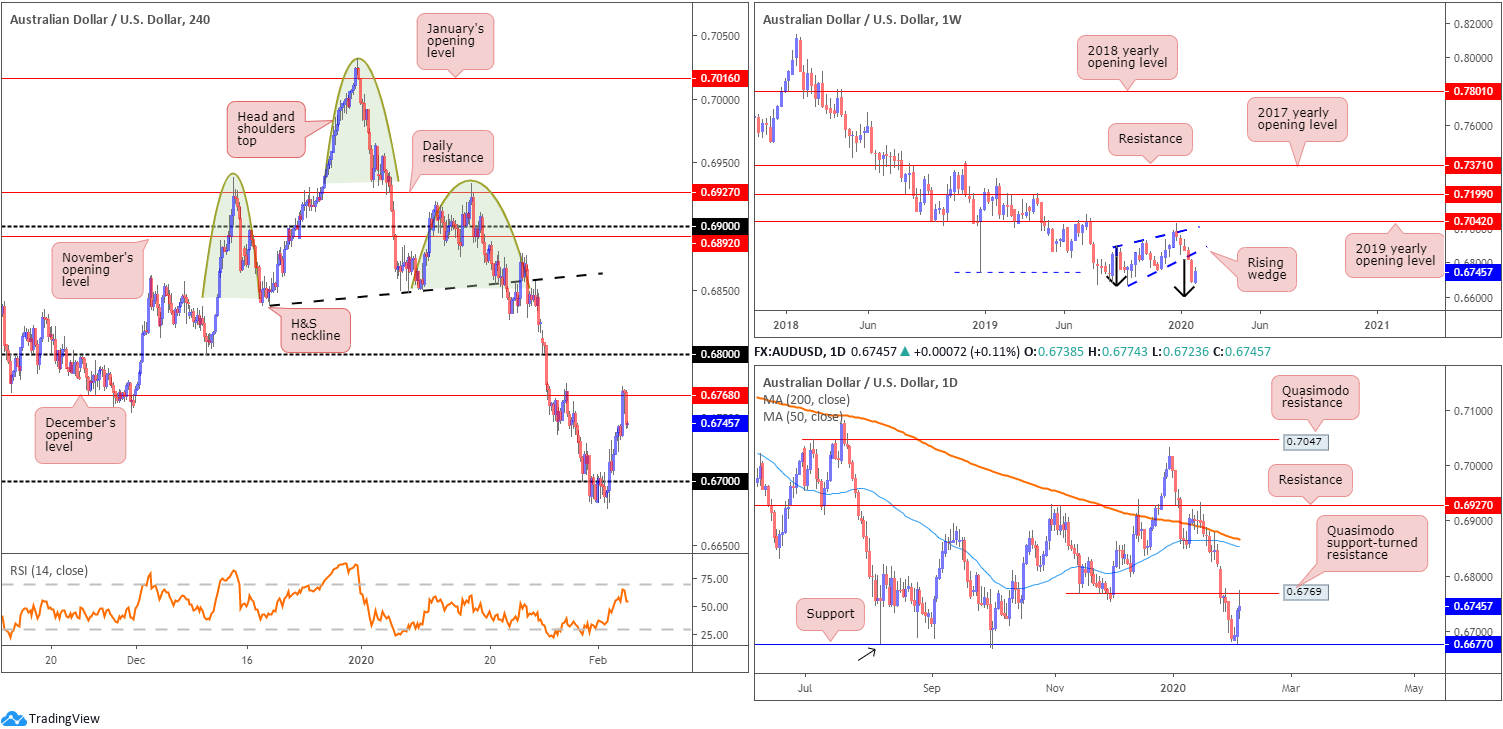
Despite clocking a peak of 0.6774, AUD/USD pencilled in a healthy correction amid US hours Wednesday, erasing a large portion of the day’s gains.
The move was weighed by broad-based USD strength, in which the US dollar index conquered its 98.00 handle. Technical selling off December’s opening level at 0.6768 on the H4 as well as Quasimodo support-turned resistance entering the fold at 0.6769 on the daily timeframe also had a role to play.
The next downside target on the H4 rests at the 0.67 handle, while daily structure suggests a move to 0.6677 may be in store.
The weekly timeframe’s overall structure remains unchanged (italics):
Since registering a bottom in late September at 0.6670 (2019), price carved out a rising wedge formation, typically considered a continuation pattern within a trending environment.
The past five weeks witnessed price decline back into the rising wedge and, thanks to recent selling, break and extend beyond the lower edge. With the primary downtrend having been in full force since topping at 0.8135, in early 2018, moves lower should have always been a possibility.
Assuming a break of the 0.6670 September 30th low, the rising wedge take-profit (black arrows – calculated by taking the height of the base and adding it the breakout point) is seen at 0.6614, followed by support at 0.6359 (not visible on the screen).
Areas of consideration:
Wednesday’s technical briefing highlighted a possible sell from 0.6768/0.6742ish region on the H4 (area has been removed since). As evident from the H4 chart, price tested the top edge of the zone at 0.6768 (December’s opening level highlighted above) and turned lower. This was a particularly favourable resistance, due to its connection with daily resistance at 0.6769 and the weekly timeframe portending further downside (see above).
Well done to any readers short the rejection off 0.6768; the next support target to be aware of is 0.67. Reducing risk to breakeven and liquidating a portion of the position here is an idea.
USD/JPY:
Several reports suggesting a coronavirus treatment may be on the horizon boosted risk sentiment Wednesday. US equities and US Treasury yields advanced across the board, consequently denting safe-haven demand.
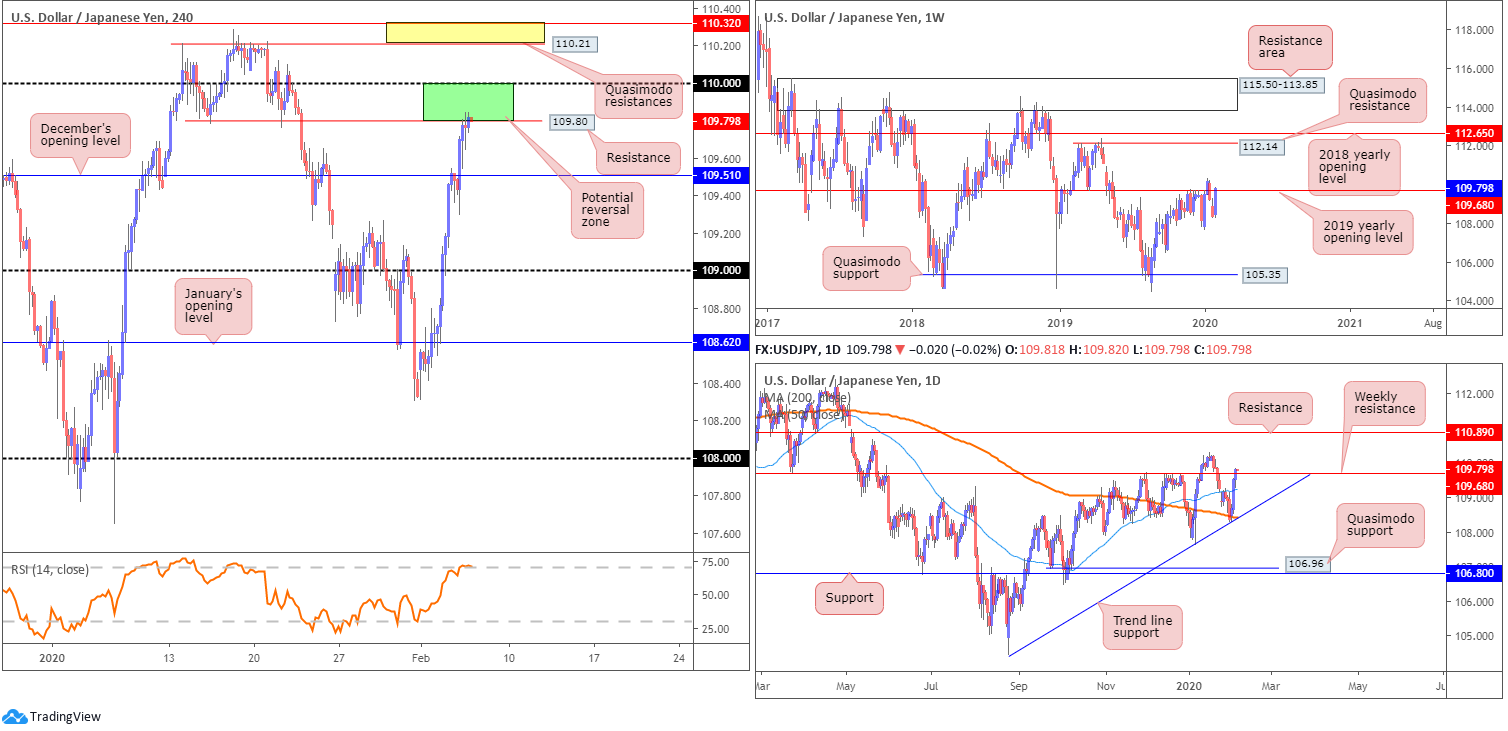
USD/JPY overthrew December’s opening level on the H4 timeframe at 109.51 in early London, extending gains for a third successive session. Continued buying has the 110 handle to target (assuming we push through resistance at 109.80), with a break perhaps unlocking the door to two layers of Quasimodo resistance at 110.32 and 110.21 (yellow). The relative strength index (RSI) also recently touched gloves with its overbought value.
Elsewhere, weekly movement is attempting to dethrone resistance, by way of the 2019 yearly opening level at 109.68. Additional buying north of here could lead to Quasimodo resistance at 112.14 being drawn into the fight, closely shadowed by the 2018 yearly opening level at 112.65. With weekly resistance at 109.68 potentially taken, chart studies on the daily timeframe has the 110.29 January 17 high in view, and resistance coming in at 110.89. A move lower here, however, could see the 50-day SMA (blue – 109.23) enter the fold.
Areas of consideration:
Although price is marginally breaching weekly resistance at 109.68, entering long, despite three days of buying, is chancy. The H4 resistance at 109.80, the 110 handle also possibly offering resistance and the RSI indicator suggesting overbought conditions, along with limited support on the H4 timeframe until around 109.51, implies shorts might be the better path to explore between 1.10/109.80 today (green).
USD/CAD:
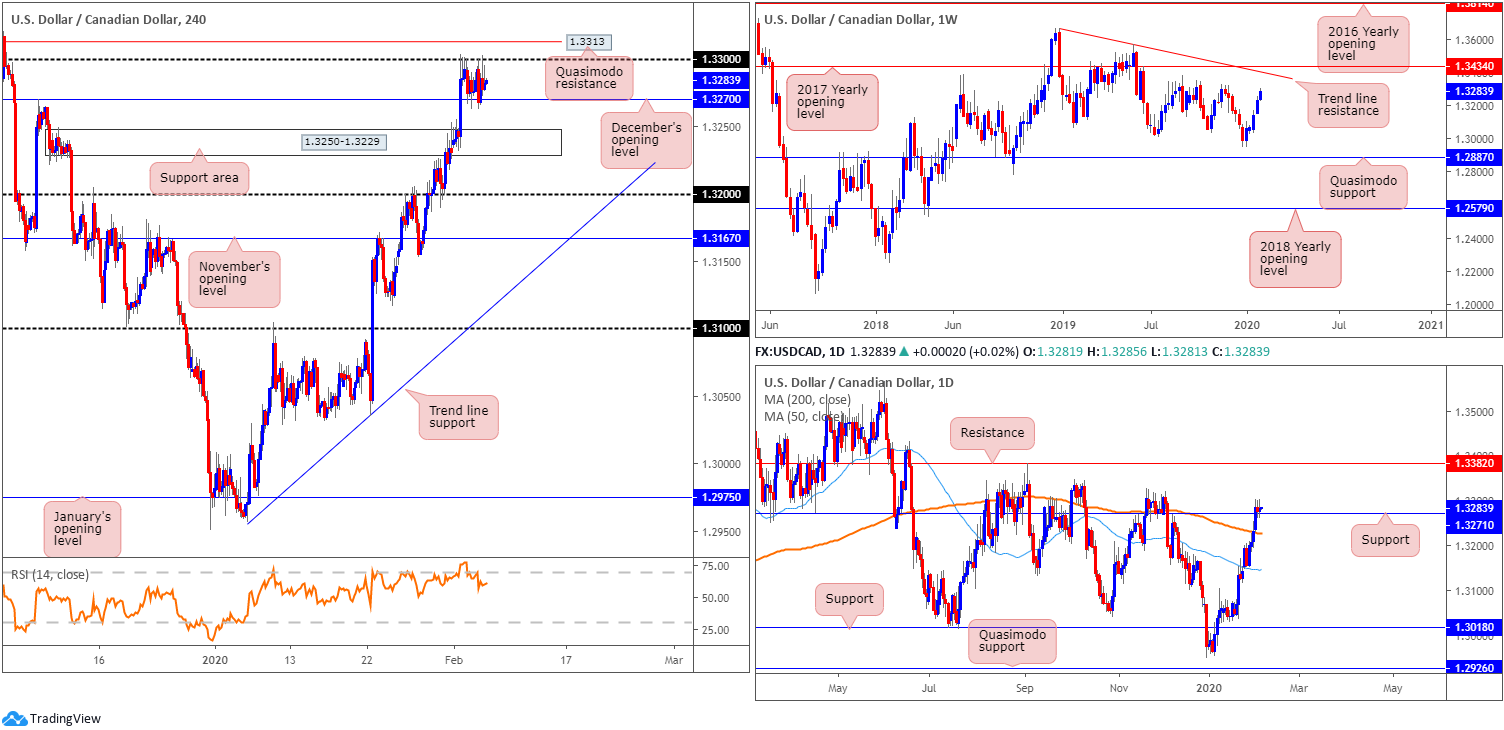
USD/CAD scored a session high of 1.3302 amid early US trade Wednesday, though reversed direction as WTI’s robust recovery helped the Canadian dollar remain resilient against a rising USD. Oil, along with US equity markets, witnessed a relief rally on growing confidence regarding treatments for the coronavirus. On the data front, aside from upbeat US data, including ADP employment and ISM non-manufacturing print, Canada’s merchandise exports, according to Statistics Canada, rose 1.9% in December, mostly on higher crude oil exports, while imports edged up 0.2%. As a result, Canada’s merchandise trade deficit with the world narrowed from $1.2 billion in November to $370 million in December.
Technically speaking, structure remains pretty much unchanged across the board.
Monday witnessed H4 action strongly overwhelm sellers at December’s opening level drawn from 1.3270 and strike a session high above the psychological threshold 1.33 at 1.3308. The pullback from said highs Tuesday reconnected with 1.3270 and formed a narrow range between 1.33 and 1.3270 Wednesday.
Beyond 1.33, Quasimodo resistance resides close by at 1.3313. It may also interest some traders to note the relative strength index (RSI) is seen exiting overbought territory after reaching highs of around 79.00.
On a wider perspective, support is also derived from the daily timeframe, following the break/retest of resistance at 1.3271 (essentially the same level as December’s opening level on the H4 timeframe). Note above the current support, the research team sees little in the way of active supply to the left of price until reaching resistance at 1.3382. Further adding to the bullish bias, weekly price shows room to advance as far north as tops around 1.3317, closely followed by trend line resistance (1.3661) and the 2017 yearly opening level at 1.3434.
Areas of consideration:
Although H4 price recently faded the 1.33 handle, December’s opening level at 1.3270 is seen holding firm on H4, as is daily support at 1.3271. This, as well as weekly price exhibiting scope to press higher, may encourage additional buying, with a break of 1.33 and possibly H4 Quasimodo resistance at 1.3313 in the pipeline.
Conservative traders may seek additional confirmation off 1.3270/1, likely in the form of a bullish candlestick signal, before pulling the trigger. This is perhaps due to the threat of a possible fakeout to nearby H4 support area at 1.3250-1.3229 and the RSI signalling a move lower.
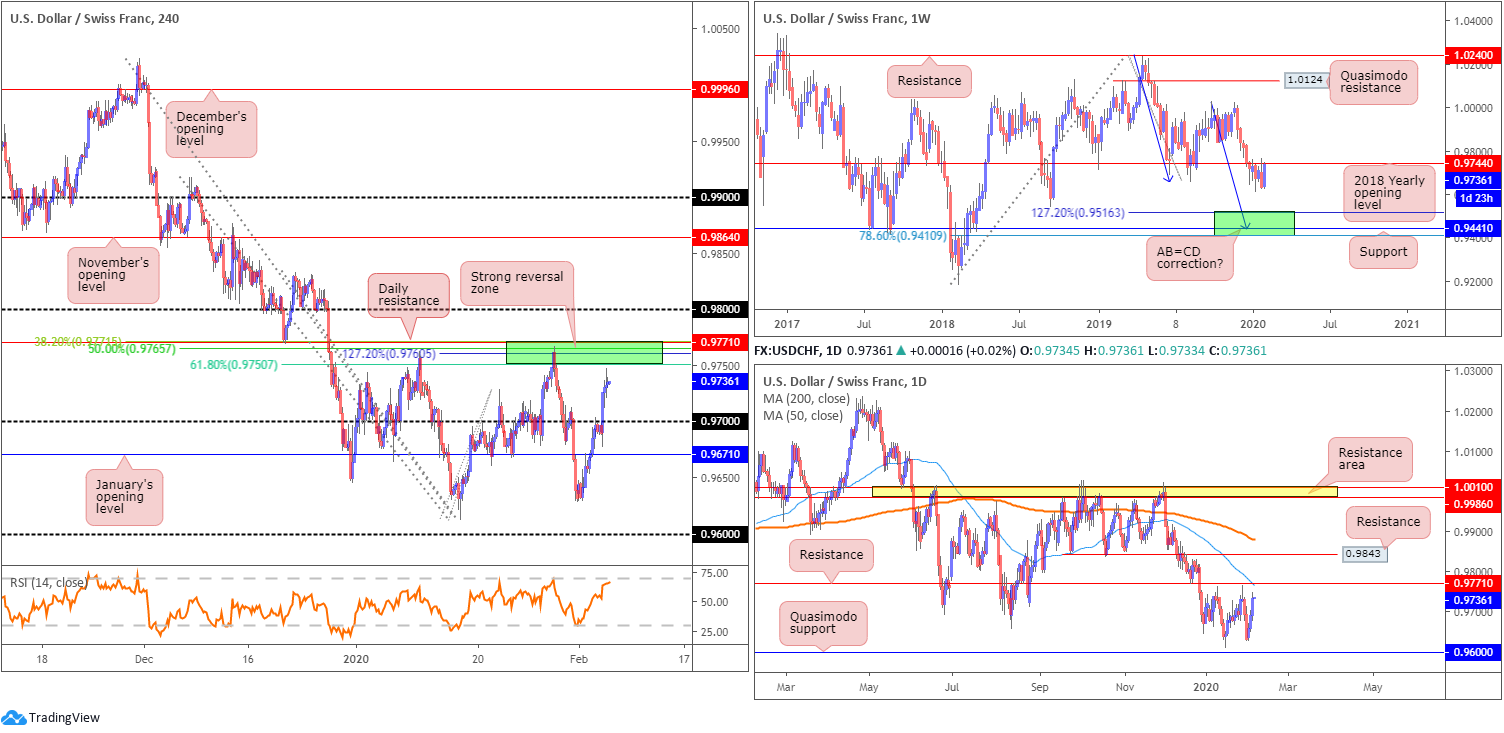
USD/CHF:
Advancing to a one-week peak at 0.9747, USD/CHF gained traction Wednesday amid promising US data and optimism surrounding treatments for the coronavirus.
A fresh wave of global risk-on trade, consequently denting safe-haven appeal, pulled the H4 candles to just south of a familiar resistance area on the H4 timeframe, comprised of Fibonacci confluence and nearby daily resistance at 0.9771 (green).
In terms of the weekly timeframe, price action is tackling the underside of the 2018 yearly opening level at 0.9744, a hurdle that supported price on three occasions since January 2019. Despite the recent recovery over the last few days, the next downside target on the weekly sits within 0.9410/0.9516, comprised of a 78.6% Fibonacci retracement at 0.9410, support at 0.9441 and a 127.2% AB=CD bullish correction (black arrows]) at 0.9516 – green.
Meanwhile, on the daily timeframe price action is poised to lock horns with resistance priced in at 0.9771, which aligns closely with the 50-day SMA (blue – 0.9765).
Areas of consideration:
0.9771/0.9750 is in focus. All three timeframes suggest a reaction out of this zone, perhaps reconnecting with the 0.97 handle. Conservative traders will likely watch for signs of selling to emerge out of the said zone before committing. This could be something as simple as a H4 bearish candlestick pattern, though this is ultimately trader dependent.
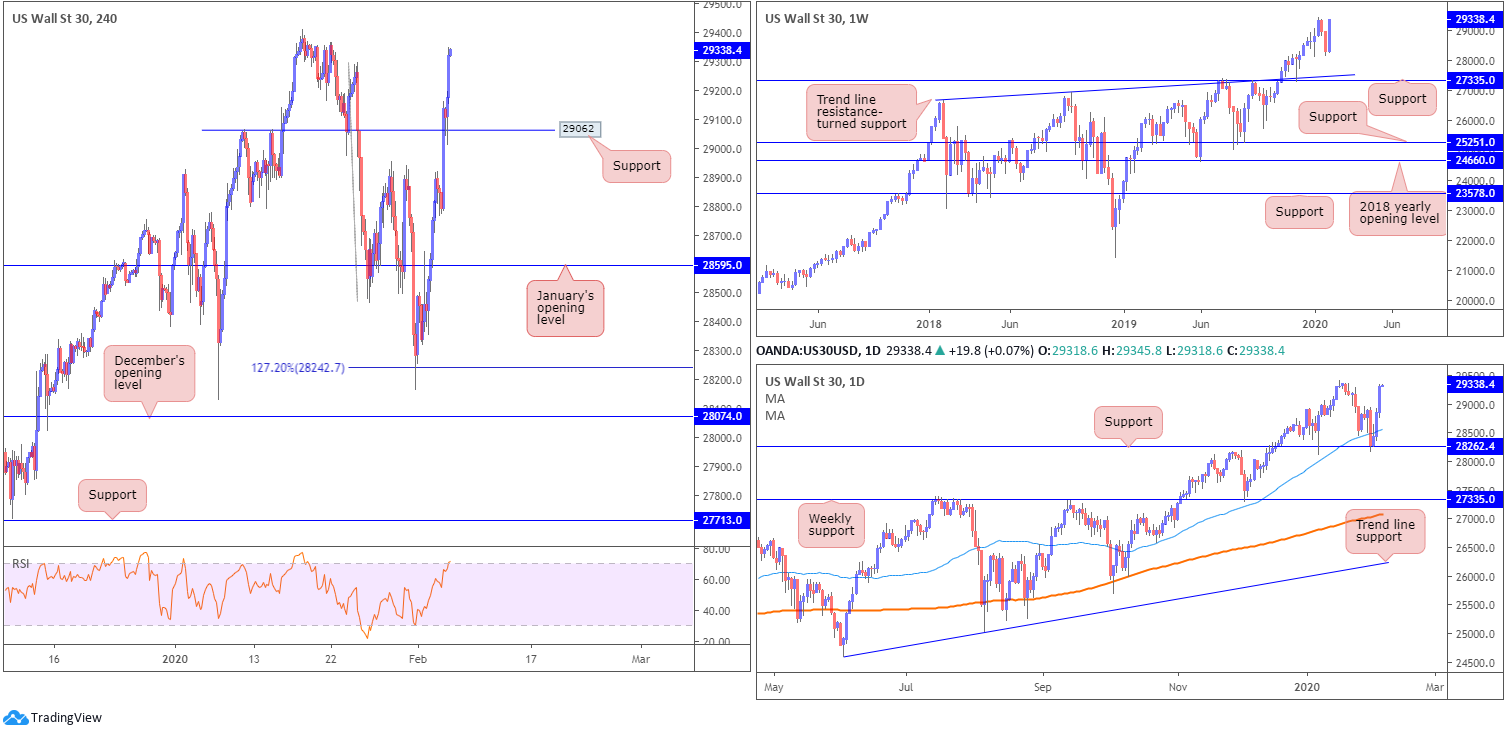
Dow Jones Industrial Average:
Solid economic reports and healthy earnings bolstered action Wednesday, with all three major benchmarks advancing. Market sentiment also took cues from reports that treatments for the Coronavirus are potentially in the works, despite the World Health Organisation stating there are no known effective therapeutics. The Dow Jones Industrial Average added 483.22 points, or 1.68%; the S&P 500 advanced 37.10 points, or 1.13% and the tech-heavy Nasdaq 100 ended higher by 33.43 points, or 0.36%.
Technically, thanks to recent bidding, the DJIA trades within striking distance of all-time highs at 29409, registered mid-January. The relative strength index (RSI), based on the H4 timeframe, is recording overbought conditions. A rejection from this region has H4 support residing around the 29062 neighbourhood. Note this base held price action higher yesterday, following a near-to-the-point retest.
A break of the said all-time high will trigger buy stops, likely forcing price into unchartered territory.
Areas of consideration:
Another retest at H4 support drawn from 29062, preferably in the shape of a H4 bullish candlestick signal (trader dependent), may be a scenario worthy of attention today. Upside targets from this point falls in at 29409, with a break suggesting a trailing stop might be worth considering.
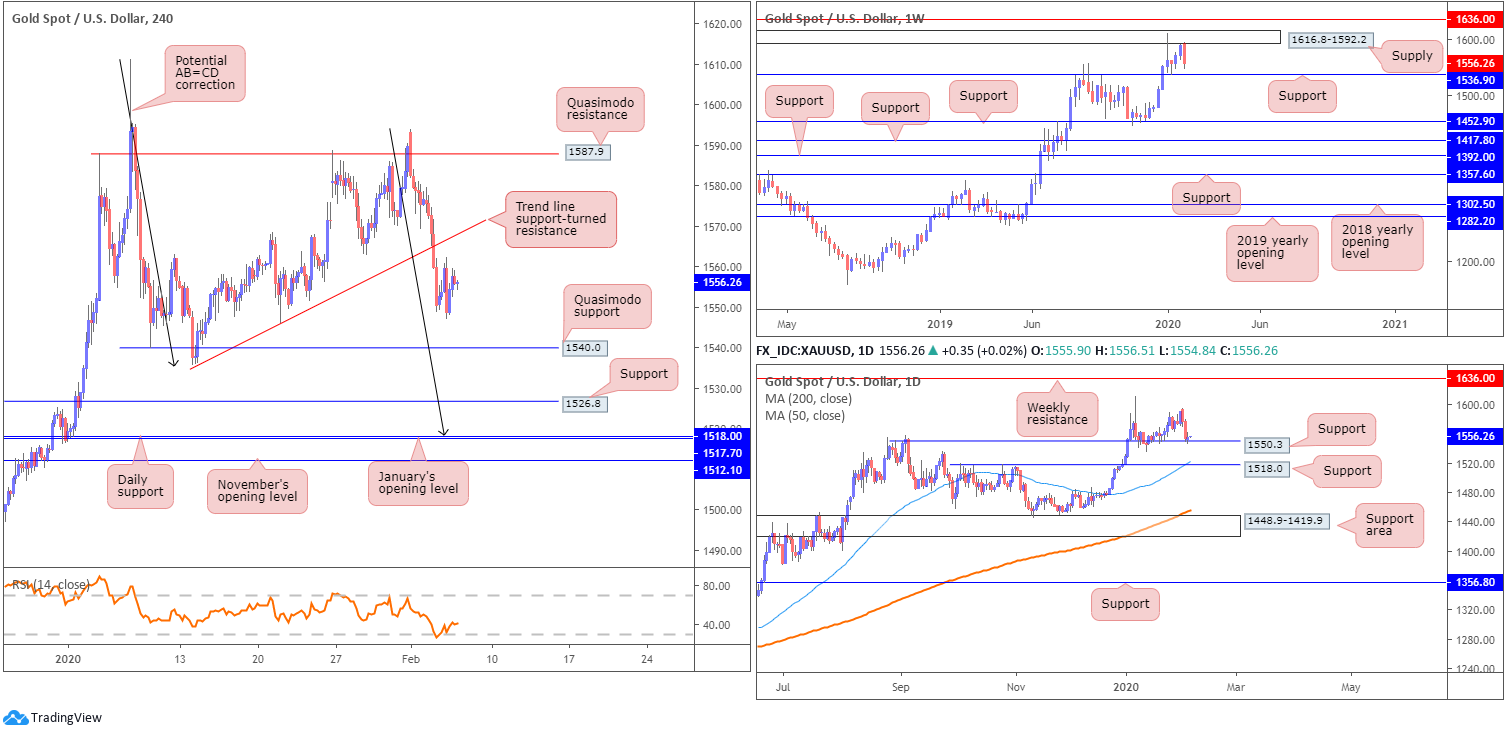
XAU/USD (GOLD):
Despite demand for safe-haven assets declining amid risk-on trade, particularly the Japanese yen and Swiss franc, the price of gold, in $ terms, concluded the session steady.
Earlier in the week, bullion tunnelled through H4 trend line support, extended from the low 1536.2, also breaching numerous intraday lows and highlighting Quasimodo support at 1540.0 as the next port of call on the H4 timeframe.
While short-term activity portends further downside, daily movement shook hands with support coming in at 1550.3, fixed north of another layer of support at 1518.0, which happens to merge closely with the 50-day SMA (blue – 1521.6).
Against the backdrop of short-term movement, the weekly timeframe shows price fading the underside of supply drawn from 1616.8-1592.2, with the next point of support coming in at 1536.9.
Areas of consideration:
Although a recovery off daily support at 1550.3 may develop, the higher-probability trade/long appears to be off the H4 Quasimodo support at 1540.0. The reason? Weekly support converges closely with the level at 1536.9.
An alternative setup, albeit a little lower on the curve, is the completion of a H4 bullish AB=CD correction (black arrows) terminating at daily support from 1518.0 and January’s opening level at 1517.7. Note this level, as highlighted above, also boasts additional support from the current 50-day SMA value.
Both 1540.0 and 1518.0 represent viable levels in this market for potential buying opportunities. Traders may wait and see which level, if any, produces a H4 bullish candlestick signal before pulling the trigger. Not only will this provide entry/risk levels to work with, it’ll help identify which level is likely to hold.
The accuracy, completeness and timeliness of the information contained on this site cannot be guaranteed. IC Markets does not warranty, guarantee or make any representations, or assume any liability regarding financial results based on the use of the information in the site.
News, views, opinions, recommendations and other information obtained from sources outside of www.icmarkets.com.au, used in this site are believed to be reliable, but we cannot guarantee their accuracy or completeness. All such information is subject to change at any time without notice. IC Markets assumes no responsibility for the content of any linked site.
The fact that such links may exist does not indicate approval or endorsement of any material contained on any linked site. IC Markets is not liable for any harm caused by the transmission, through accessing the services or information on this site, of a computer virus, or other computer code or programming device that might be used to access, delete, damage, disable, disrupt or otherwise impede in any manner, the operation of the site or of any user’s software, hardware, data or property.


