
A note on lower timeframe confirming price action…
Waiting for lower timeframe confirmation is our main tool to confirm strength within higher timeframe zones, and has really been the key to our trading success. It takes a little time to understand the subtle nuances, however, as each trade is never the same, but once you master the rhythm so to speak, you will be saved from countless unnecessary losing trades. The following is a list of what we look for:
- A break/retest of supply or demand dependent on which way you’re trading.
- A trendline break/retest.
- Buying/selling tails/wicks – essentially we look for a cluster of very obvious spikes off of lower timeframe support and resistance levels within the higher timeframe zone.
- Candlestick patterns. We tend to only stick with pin bars and engulfing bars as these have proven to be the most effective.
For us, lower timeframe confirmation starts on the M15 and finishes up on the H1, since most of our higher timeframe areas begin with the H4. Stops usually placed 5-10 pips beyond your confirming structures.
EUR/USD:
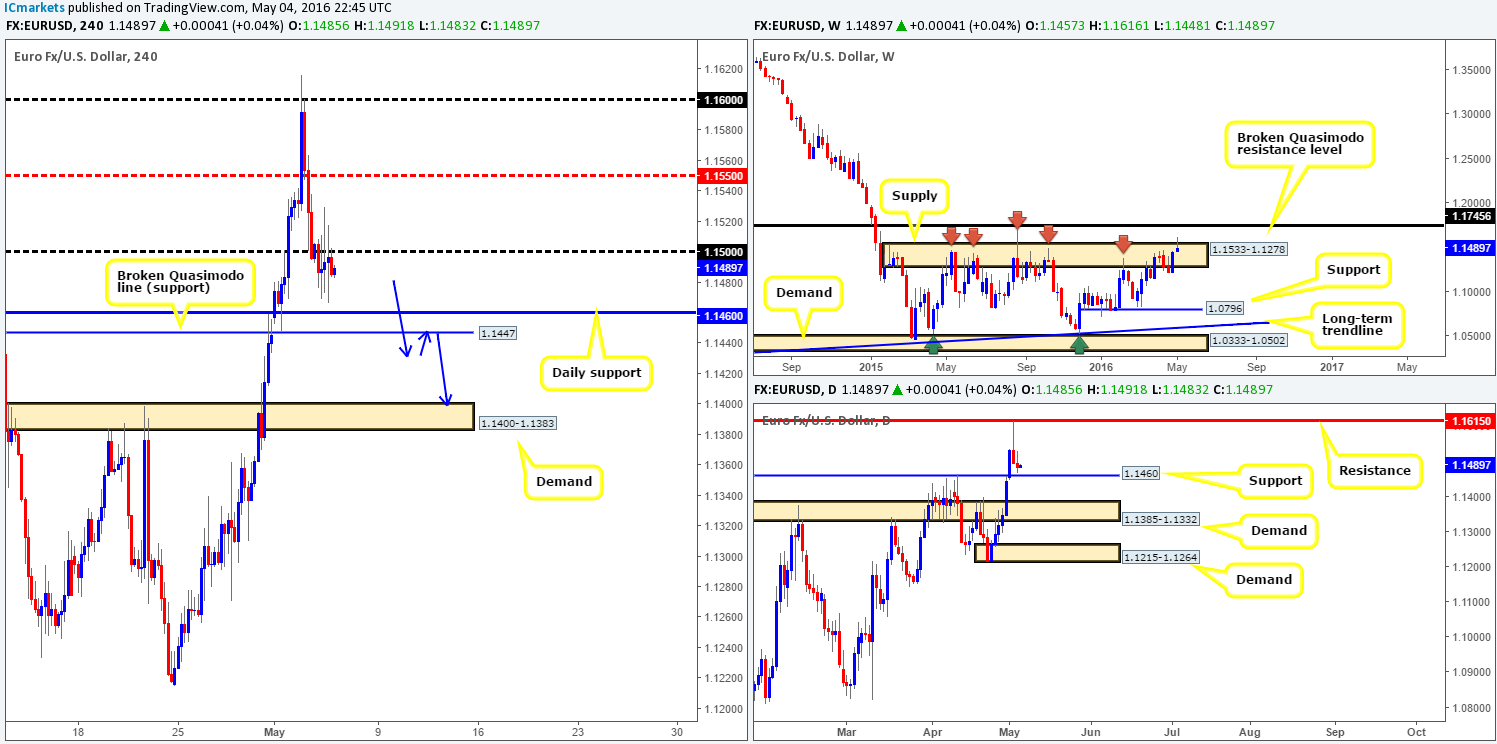
After dropping sharply from the 1.1600 line on Wednesday, Thursday’s action on the EUR, as can be clearly seen on the H4 chart, was rather subdued. The pair consolidated in relatively tight range just below the 1.1500 level between 1.1496/1.1485.
With daily support at 1.1460 now seen within touching distance, and price also trading from within weekly supply at 1.1533-1.1278, neither a long nor short seems attractive at this time. Given that the weekly timeframe is in such a sensitive area, a break above the 1.1500 hurdle would not be considered a bullish signal. However, should the EUR continue to trade lower today and close beyond both the aforementioned daily support and its neighboring H4 broken Quasimodo support at 1.1447, we see room for a possible short down to H4 demand penciled in at 1.1400-1.1383 (sits on top of daily demand at 1.1385-1.1332 – the next downside target below the current daily support level). For us to be given the green light to short following a close lower, nevertheless, we would need to see two things happen. Firstly, a retest of the broken supports as resistance, and secondly, a lower timeframe sell signal to confirm that the sellers are awake!
Levels to watch/live orders:
- Buys: Flat (Stop loss: N/A).
- Sells: Watch for price to close below 1.1460/1.1447 and look to trade any retest seen thereafter (lower timeframe confirmation required).
GBP/USD:
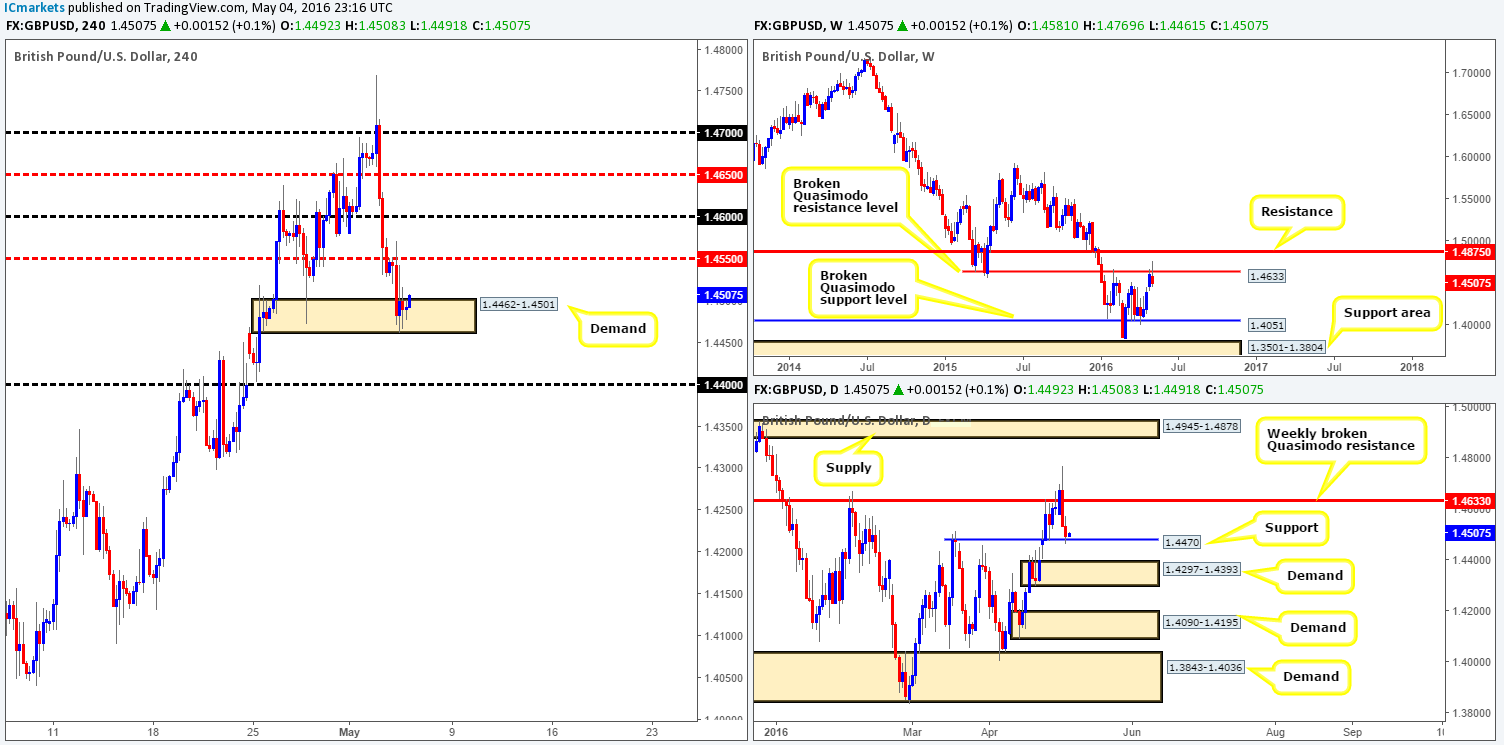
In recent sessions, the British pound sold-off from the H4 mid-way resistance at 1.4450, consequently pushing price deep into a H4 demand coming in at 1.4462-1.4501. This area is rather significant in our opinion. If you look over to the daily chart you’ll notice that it encapsulates a clear support drawn from 1.4470. Of course, when one sees two areas converge as we are here, the expectation is likely going to be for it to hold firm and rally prices. We agree, and price will likely bounce from here. However, climbing up to the weekly chart, we can see that Cable is currently trading from a weekly broken Quasimodo resistance line at 1.4633 (BQRL). Technically, this puts a strain on both the daily and H4 areas, and as a result we may see any buying pressure from here die down relatively quickly.
Assuming that the weekly sellers continue to dominate today, beyond the current H4 demand the 1.4400 handle is the next line likely on the hit list, which is essentially the top-side of daily demand (seen below the aforementioned daily support) at 1.4297-1.4393. If a break lower does indeed come to fruition and price retests the broken H4 demand as supply, there could be an opening for a small intraday short down to 1.4400.
Levels to watch/live orders:
- Buys: Flat (Stop loss: N/A).
- Sells: Watch for price to close below 1.4462-1.4501 and look to trade any retest seen thereafter (lower timeframe confirmation required).
AUD/USD:
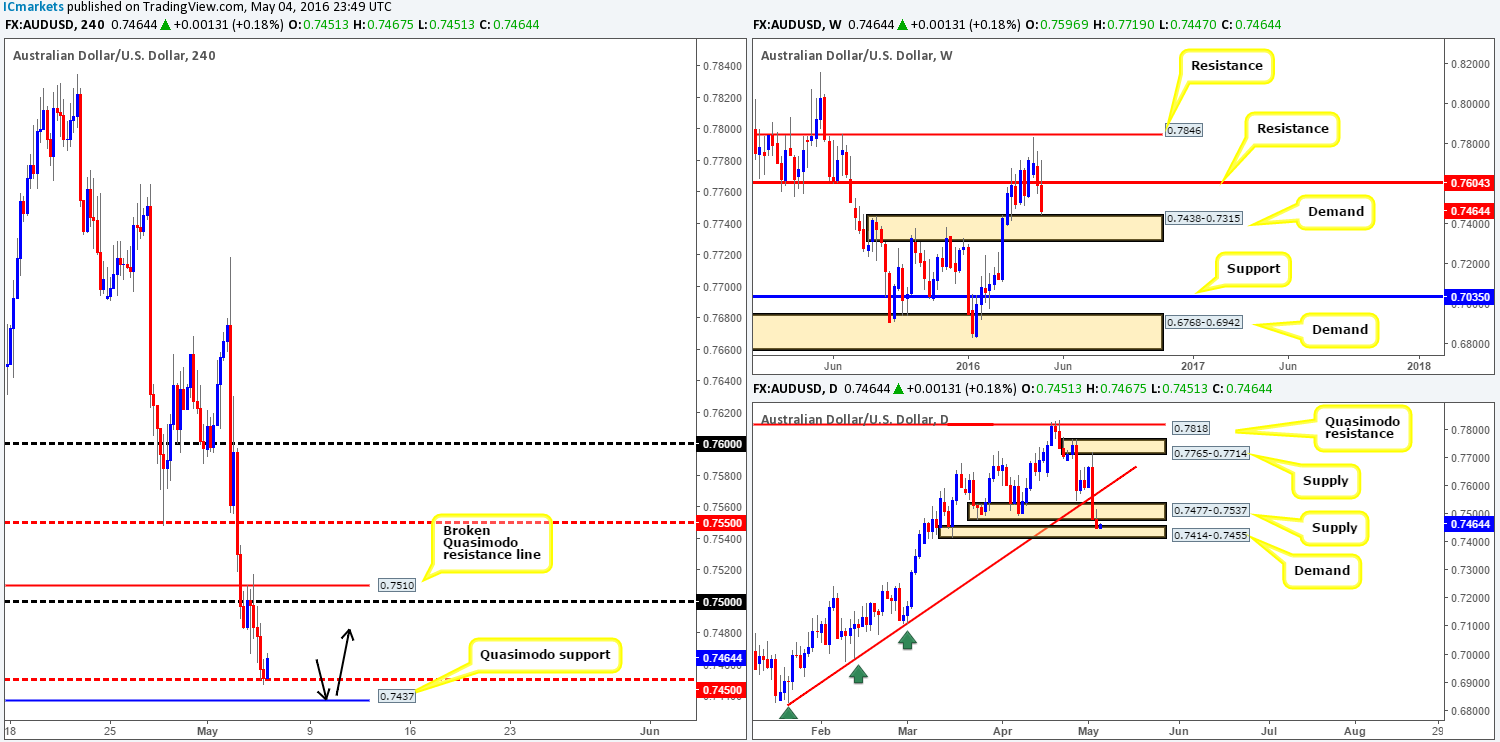
Starting with a quick look at the weekly chart this morning, it’s clear to see that price is now within touching distance of connecting with weekly demand carved from 0.7438-0.7315. Turning our attention to the daily chart, however, we can see that the commodity currency recently closed below daily demand at 0.7477-0.7537 (now acting supply), and immediately entered into a neighboring daily demand just below at 0.7414-0.7455.
Stepping across to the H4 chart, the Aussie is currently seen trading from a H4 mid-way support at 0.7450, located directly above a H4 Quasimodo support level drawn from 0.7437. Personally, we feel that the bounce from this mid-way number is likely going to fizzle out and force this market lower to shake hands with the above said H4 Quasimodo point. This is due to it converging beautifully with the top-side of the weekly demand zone mentioned above at 0.7438-0.7315.
On account of the above, we have set a pending buy order at 0.7438, and placed our stop below the current daily demand at 0.7410. Should the order fill today, we’ll be looking to take partial profits around the 0.7500 region or slightly before, since let’s not forget that there is now daily supply lurking overhead at 0.7477-0.7537.
Levels to watch/live orders:
- Buys: 0.7438 [Pending order] (Stop loss: 0.7410).
- Sells: Flat (Stop loss: N/A).
USD/JPY:
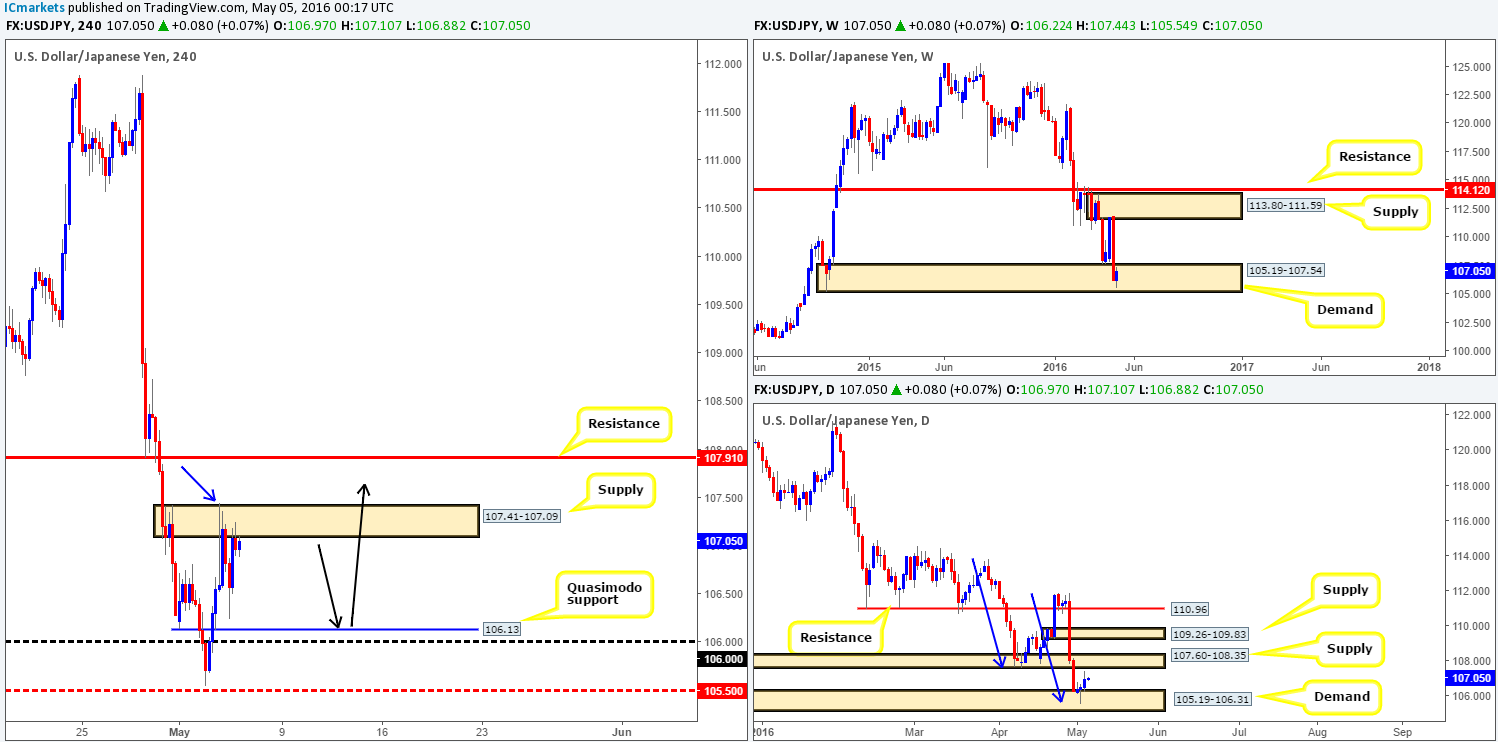
The USD/JPY is a very interesting pair to be watching at the moment! Up on the weekly chart, the buyers and sellers remain battling for position within weekly demand at 105.19-107.54, with a slight edge seen going to the bulls at the moment. On the assumption that the buyers defend this zone, we could see this pair rally back up to weekly supply drawn from 113.80-111.59. Down on the daily chart, demand at 105.19-106.31, which boasts a daily AB=CD approach (see blue arrows), continues to hold firm. The next upside target from this angle falls in at supply visible at 107.60-108.35.
As we mentioned in previous reports, we feel this pair wants higher prices. The break above H4 supply at 107.41-107.09 (blue arrow) may have consumed enough stops to allow the unit to reach H4 resistance at 107.19 (positioned within daily supply mentioned above at 107.60-108.35). With that, and the higher-timeframe picture in mind (see above), the H4 Quasimodo support line at 106.13 together with the 106.00 support handle could provide a nice platform in which to buy from today (an ideal scenario would be as per the black arrows). Of course, it is down to the individual trader if he/she chooses to enter from here at market or wait for some sort of confirmation signal. For us, we would much prefer waiting for some strength to form on the lower timeframes before risking capital (for confirmation techniques, please see the top of this report), as price could drop lower to shake hands with H4 mid-way support 105.50 region again before rallying higher.
Levels to watch/live orders:
- Buys: 106.00/106.13 [Tentative – confirmation required] (Stop loss: dependent on where one confirms this area).
- Sells: Flat (Stop loss: N/A).
USD/CAD:
The USD/CAD aggressively advanced north for a second consecutive day yesterday, reaching highs of 1.2885 by the close. Several H4 technical resistances were taken out during this bullish attack, with price now seen consolidating just above H4 mid-way support 1.2850.
In light of this recent buying, weekly price is now seen trading above a key weekly resistance level coming in at 1.2833. This is in no way a bullish signal for us, since all this could really be is a fakeout above this line before driving lower! Sliding down into the pits of the daily chart, nonetheless, current action is hovering just ahead of a daily broken Quasimodo resistance barrier at 1.2900. This – coupled with weekly structure (see above), we feel 1.2900 or even the H4 supply lurking just above at 1.2989-1.2947 are both prime locations for shorting today. 1.2900 would require lower timeframe confirmation before a trade is executed (for confirmation techniques, please see the top of this report) due to the possibility of a fakeout. H4 supply on the other hand could, dependent on the approach and time of day, be worthy of a market order owing to its position on the higher-timeframe picture (see above).
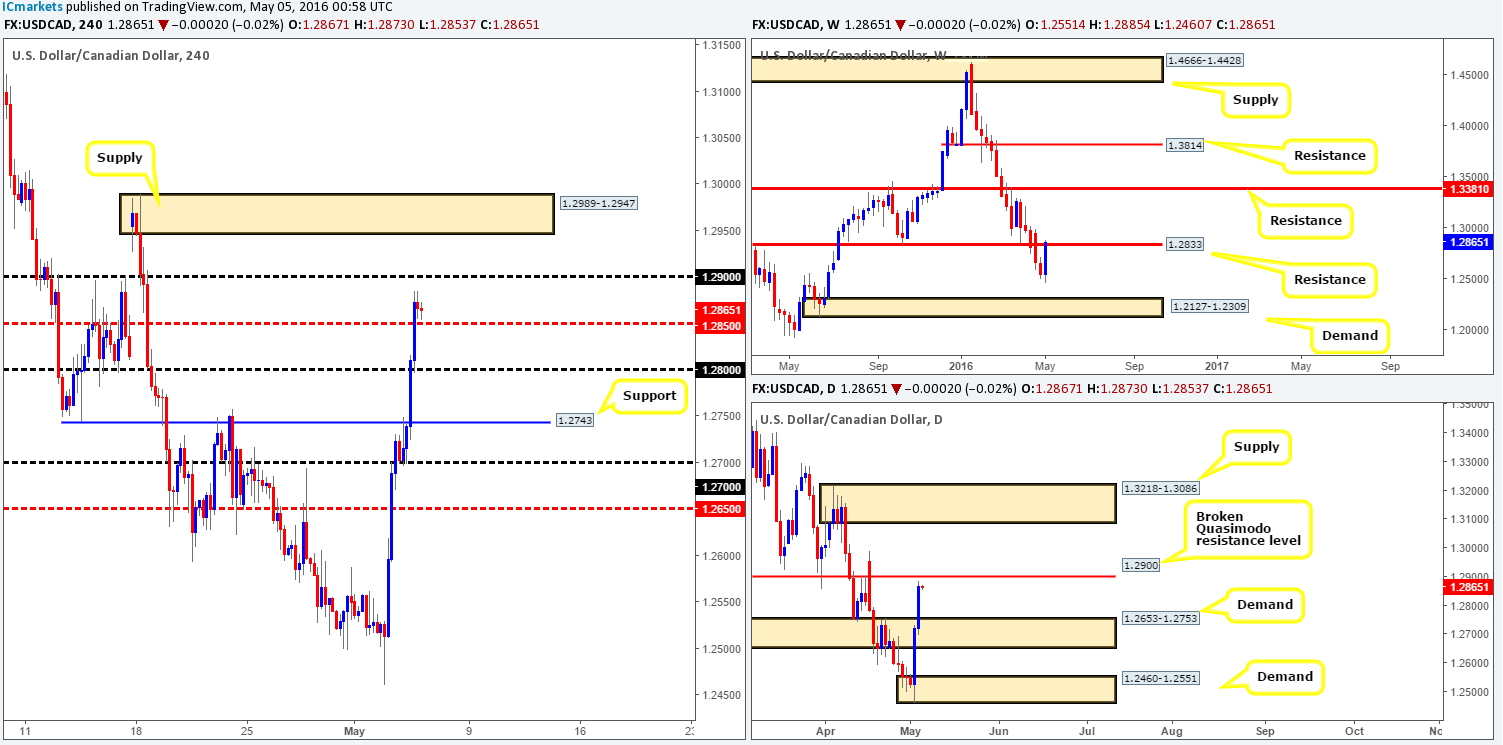
Levels to watch/live orders:
- Buys: Flat (Stop loss: N/A).
- Sells: 1.2900 region [Tentative – confirmation required] (Stop loss: dependent on where one confirms this area). 1.2989-1.2947 [Dependent on the approach and time of day a market order could be set here] (Stop loss: 1.2996).
USD/CHF:
From the top this morning, the weekly chart appears to be in the process of chalking up a nice-looking buying tail off the back of a weekly support drawn from 0.9508. This, in our book, reflects somewhat of a bullish stance for this pair. Despite this, yesterday’s brief surge in buying brought the Swissy into the jaws of a daily supply area coming in at 0.9584-0.9640, so buying this market based solely on weekly structure might not be the best path to take at the moment. Over on the H4 chart, recent activity connected with H4 supply carved from 0.9584-0.9600, which for now, seems to be holding this market lower.
In view of the above information, our team will not be pursuing buy trades UNTIL the current H4 supply is consumed. A close above here would likely clear the path north for price to challenge H4 resistance at 0.9652 (see just above the aforementioned daily supply), as well as allow traders to either buy on the breakout or conservatively wait for price to retest the broken area as demand and enter with lower timeframe confirmation (for confirmation techniques, please see the top of this report).
Of course, upon a strong close above the current H4 supply price could potentially drive as high as the daily supply seen at 0.9787-0.9755, which is the next upside target on the daily timeframe beyond the current daily supply.
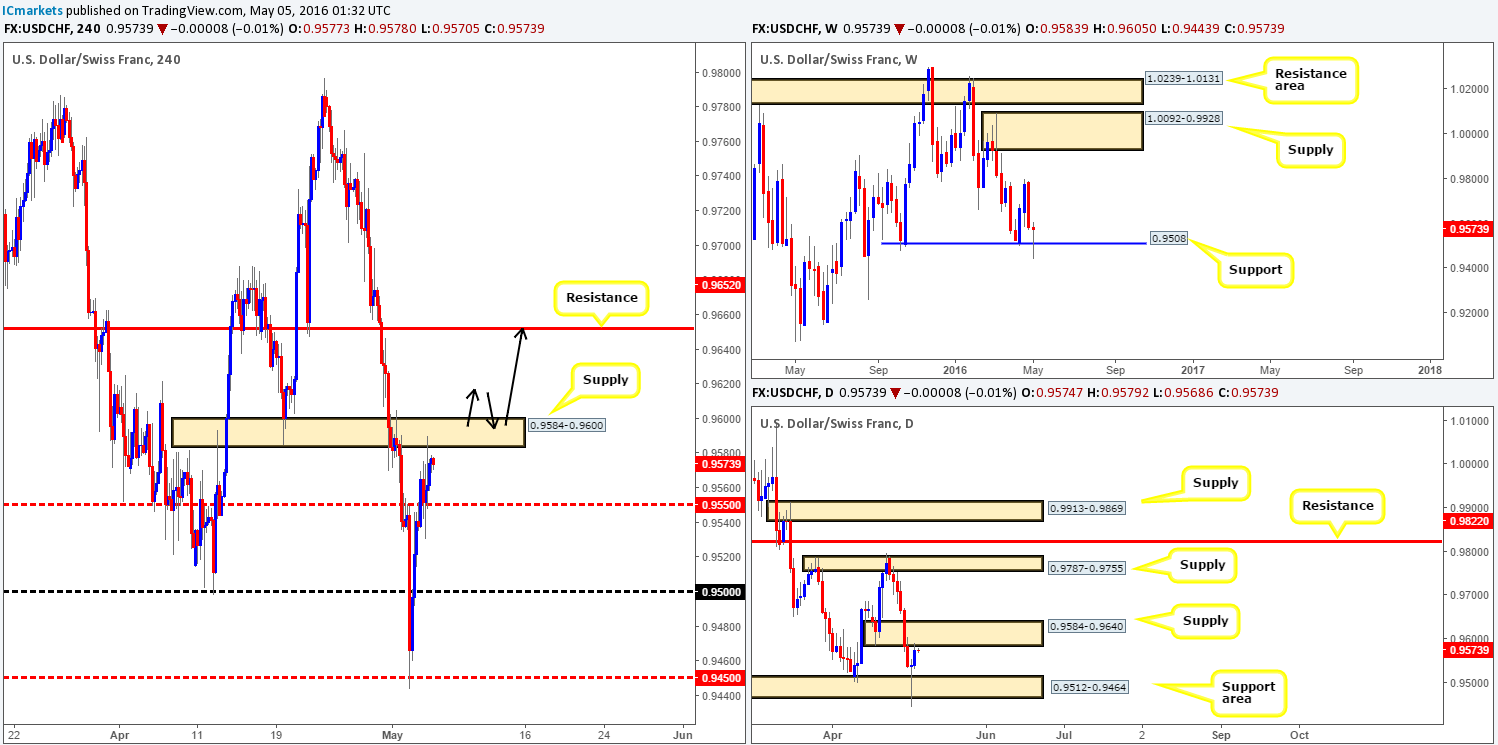
Levels to watch/live orders:
- Buys: Watch for price to close above 0.9584-0.9600 and look to trade any retest seen thereafter (lower timeframe confirmation required).
- Sells: Flat (Stop loss: N/A).
DOW 30:
U.S. stocks slipped lower for a second consecutive day yesterday, reaching lows of 17608 by the close. In spite of this, H4 structure remains the same, leaving yesterday’s battle lines on duty today. For those who did not read our previous report, the two points of interest we have logged are as follows:
- The first comes in at a H4 resistance drawn from 17920 (green circle). This level offers H4 channel resistance extended from the high 18167 as well as a 61.8% Fibonacci resistance level at 17916.
- The second can be seen lower down on the curve at H4 support carved from 17575 (red circle), which also boasts H4 channel support extended from the 17790 region, together with a deep 88.6% Fibonacci support band at 17557.
In our book, both of the above said levels are high-probability reversal zones. Nevertheless, the upper H4 resistance is strong enough to condone a trade without confirmation. The lower, however, will require confirmation. Our reasoning lies within the higher-timeframe structure. The upper H4 resistance has the backing of weekly flow trading from a weekly resistance area at 18365-18158, as well as daily resistance from 17894. The lower H4 support on the other hand only has the daily demand at 17396-17554 in its corner.

Levels to watch/live orders:
- Buys: 17575 region [Tentative – confirmation required] (Stop loss: dependent on where one confirms this area).
- Sells: 17920 [Pending order] (Stop loss: should be placed above the H4 descending channel limit).
GOLD:
Based on the weekly chart, the yellow metal continues to suggest bearish intent. Not only is weekly supply holding firm at 1307.4-1280.0, but over on the U.S. dollar index steady support is being seen around the 92.621 region. On the other side of the ledger, daily movement recently closed below daily support at 1283.4 (now acting resistance), and came within a few pips of connecting with daily demand at 1270.8-1257.5.
Given that price is now retesting the underside of the recently broken daily support at 1283.4 (see above) and seeing as how price took out the H4 broken Quasimodo support at 1279.7 yesterday, H4 action will likely continue lower from current price to H4 support at 1269.6. Therefore, we will be watching for selling strength to form on the lower timeframes in hope of finding a suitable sell trade. Should price rally, however, our cut-off point for shorting this market is a break above the high marked with a blue arrow at 1289.5.
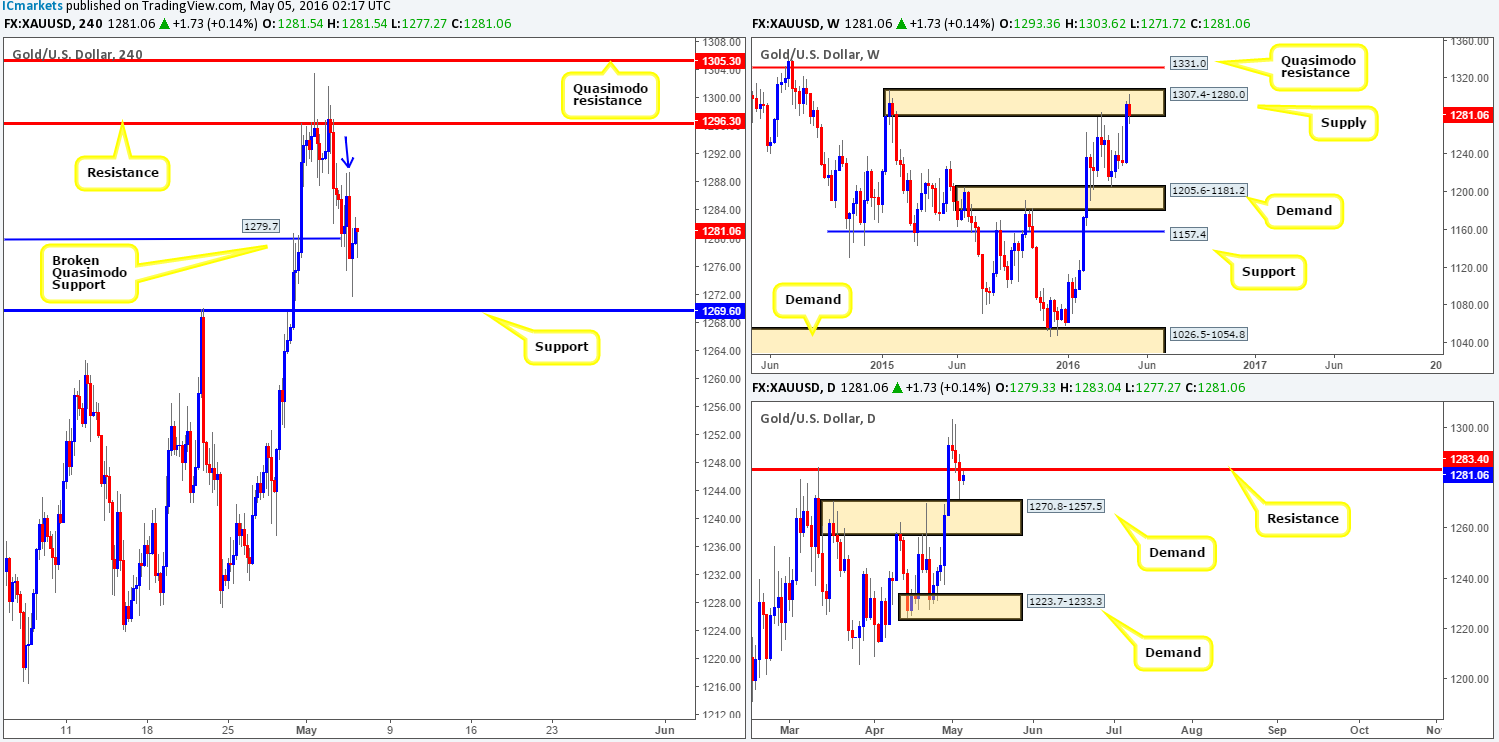
Levels to watch/live orders:
- Buys: Flat (Stop loss: N/A).
- Sells: Watch price for short entries around the 1281.0 region (lower timeframe confirmation required).


