
Key risk events today:
OPEC Meetings; BoE Gov Carney Speaks; BoC Gov Poloz Speaks.
(Previous analysis as well as outside sources – italics).
EUR/USD:
For traders who read Wednesday’s technical briefing you may recall the following:
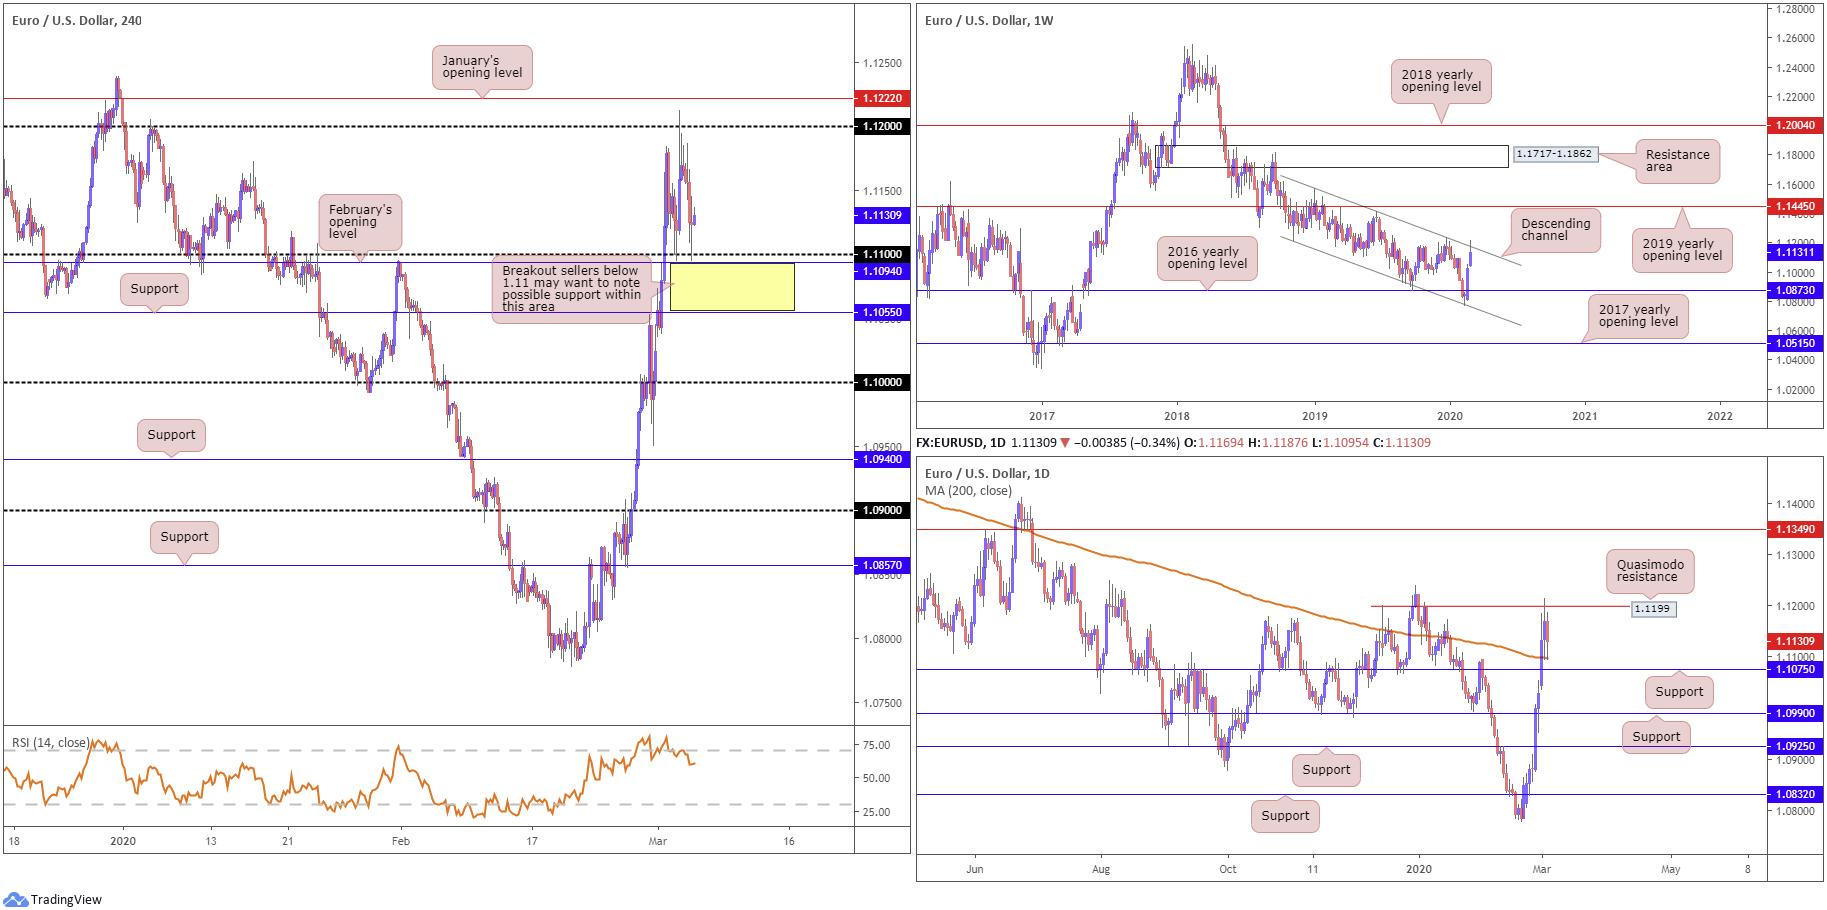
The test of 1.12 could be interesting as possible resistance, having seen daily Quasimodo resistance at 1.1199 merge with the level, along with the current weekly channel resistance in motion and January’s opening level operating nearby at 1.1222. A pullback from this neighbourhood could see 1.11 brought back in view, closely shadowed by the 200-day SMA (orange – 1.1097).
As reflected in yesterday’s movement, price extended losses south of 1.12 and did indeed test 1.11. Note also we connected with the 200-day SMA and came within touching distance of challenging February’s opening level at 1.1094.
Price on the weekly timeframe, as briefly emphasised above, recently touched gloves with channel resistance, extended from the high 1.1569. This follows a stronger-than-expected rotation off channel support, taken from the low 1.1109, and sustained upside north of the 2016 yearly opening level at 1.0873.
Areas of consideration:
Price holding off 1.11 is likely a combination of fresh buyers entering the market, largely based off the 200-day SMA, and a wave of short covering from 1.12.
Considering weekly price shows signs of softness from channel resistance, a breach of 1.11 could be on the cards today.
Movement under 1.11 will attract breakout sellers, this is common. Trouble, however, lies ahead in the shape of a daily support priced in close by at 1.1075 and H4 support at 1.1055 (yellow zone), a threat to breakout orders south of 1.11. A more conservative approach for sellers might be waiting for the current H4 support (1.1055) to give way, theoretically unlocking the door for an approach to the key figure 1.10, closely shadowed by daily support at 1.0990. This offers 55 points of room to manoeuvre, free of support, according to chart studies.
GBP/USD:
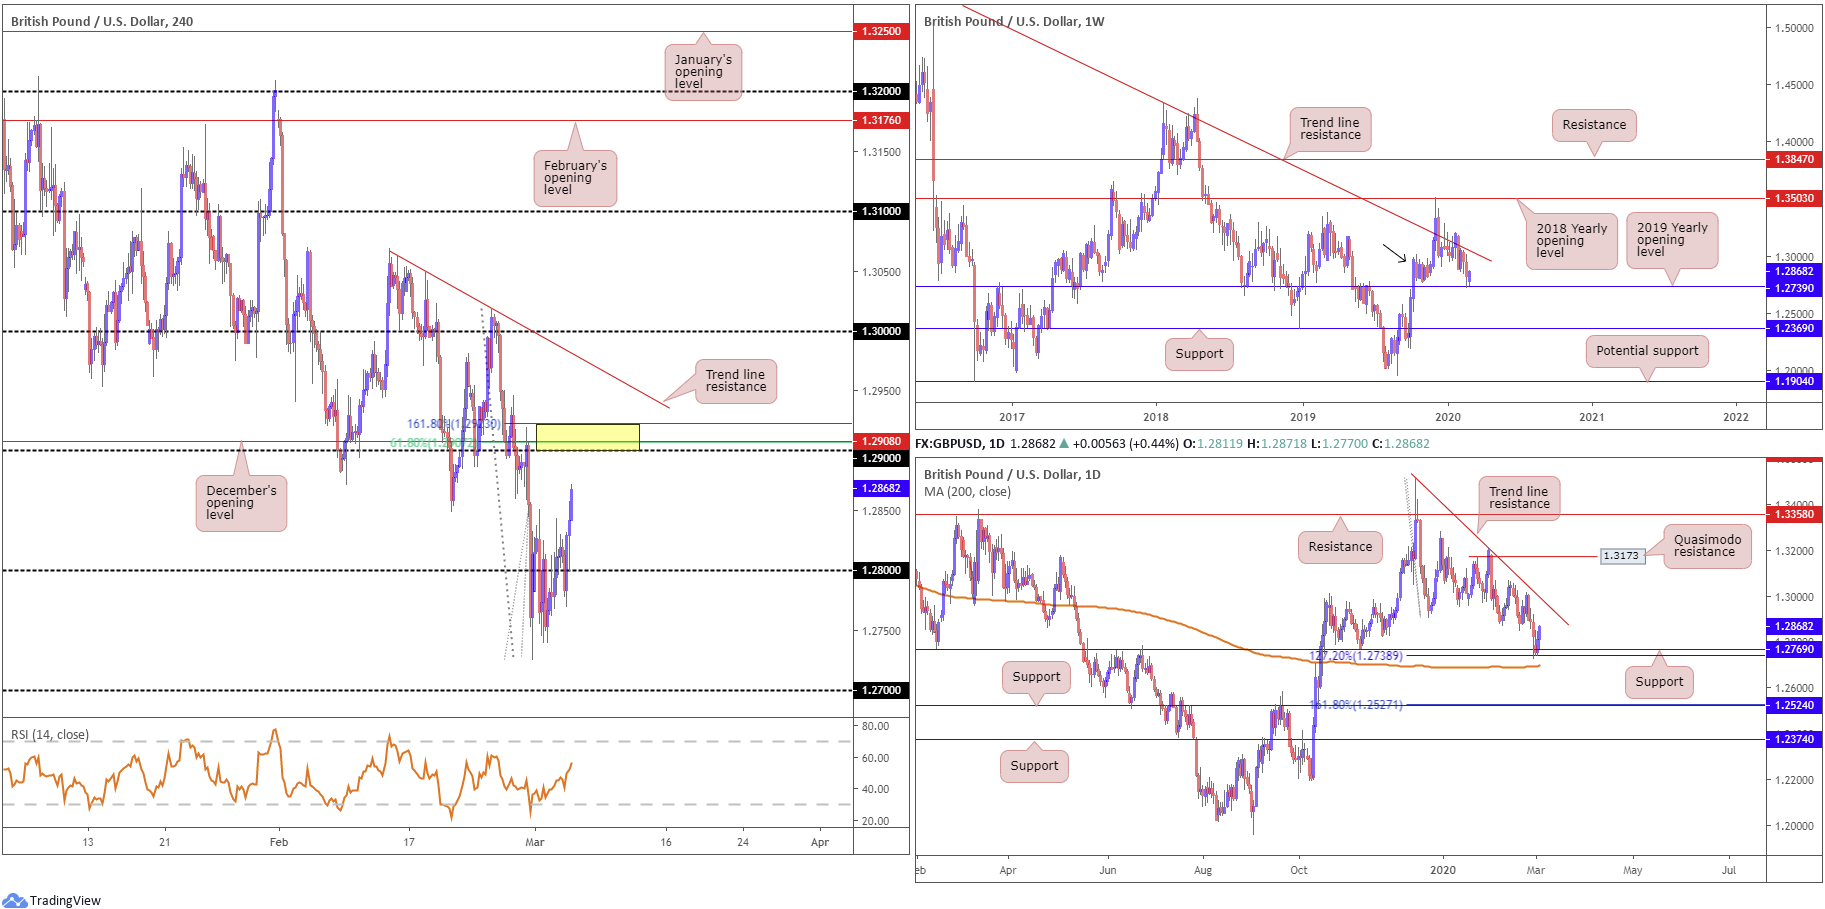
Mid-way through London on Wednesday, a breach of 1.28 to the upside was seen, swiftly followed by two retests. Early US hours observed the pound firm north of 1.28, clearing out remaining buy stops and standing the H4 candles within striking distance of 1.29. Technically, 1.29 is accompanied by December’s opening level at 1.2908, a corresponding 61.8% Fibonacci retracement and a 161.8% Fibonacci extension point at 1.2923 (yellow). Also of note, we crossed through the 50.0 value on the relative strength index (RSI), currently trading at 55.45.
Higher up on the curve, technical action has weekly price interacting with the 2019 yearly opening level at 1.2739, off YTD lows. A breach of the said support may side-line hopes of recovery and shine the spotlight on support from 1.2369.
In conjunction with the weekly timeframe, we can see price action on the daily timeframe ran into a particularly interesting area of support at 1.2769, a 127.2% Fibonacci extension at 1.2738 and the 200-day SMA. Note the said SMA has been flattening since mid-October 2019. Trend line resistance, extended from the high 1.3514, is next in line should we continue higher. Failure to hold at 1.2769, nonetheless, has support at 1.2524 to target, which happens to merge closely with a 161.8% Fibonacci extension at 1.2527.
Areas of consideration:
The area between 1.2923 and the round number 1.29 (yellow) on the H4 timeframe offers potentially healthy resistance, albeit lacking higher-timeframe convergence. In fact, by attempting to fade this level lures you into direct conflict with higher-timeframe buying off current supports. H4 sellers out of 1.2923/1.29, therefore, may seek additional confirmation before engaging.
A pullback from the aforementioned H4 zone could lead to 1.28 re-entering the fold.
AUD/USD:
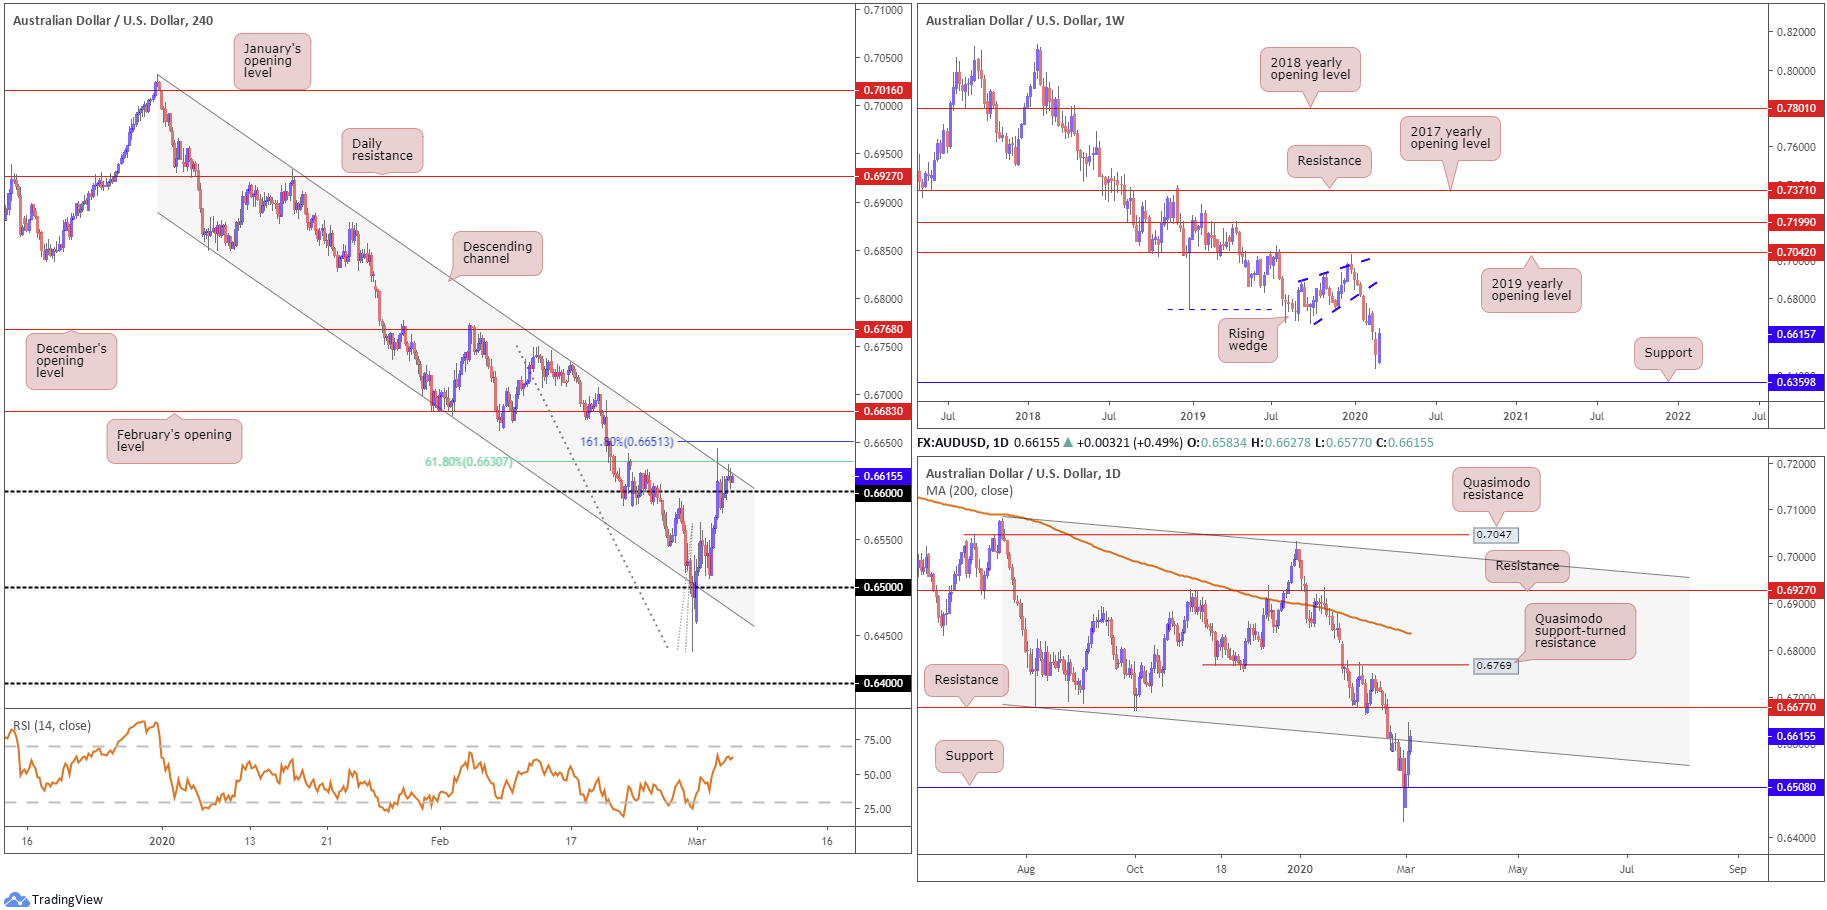
Marginally better-than-expected Australian growth data in the December quarter 2019 provided fresh impetus to the AUD/USD market in early trade Wednesday, pushing through orders at 0.66. As evident from the H4 chart, price action remained north of the figure throughout the day, though is capped by channel resistance, extended from the high 0.7031. Also dovetailing closely with the channel formation is a 61.8% Fibonacci retracement value at 0.6630 and a 161.8% Fibonacci extension point at 0.6651.Technicians will also note the relative strength index (RSI) is nearing overbought waters, hovering a touch beneath 64.00.
On more of a broader perspective, daily activity recently checked in with channel support-turned resistance, taken from the low 0.6677. Surpassing this level today could lead to resistance at 0.6677 making its debut. This follows a disorderedly response from support coming in at 0.6508. Traders may find the convergence of the said daily channel resistance and the H4 resistance structures mentioned above of interest.
AUD/USD on the weekly scale still, despite recent recovery above 0.66, has eyes for support coming in at 0.6359. Eight out of nine weeks has seen the pair register losses, since topping a touch south of the 2019 yearly opening level at 0.7042, and completing a five-month rising wedge pattern. Note the primary trend has faced south since 2018, and we’re now testing decade lows in this market.
Areas of consideration:
A H4 close south of 0.66 would be an interesting scenario today, helping to confirm seller intent off H4 and daily resistances, targeting daily support underlined above at 0.6508, closely trailed by the 0.65 handle on the H4 timeframe.
Conservative traders may elect to wait and see if a retest forms at the underside of 0.66 before pulling the trigger. This helps confirm seller intent. Though like everything trading, nothing is guaranteed. Adopting strict risk management at all times is a must.
USD/JPY:
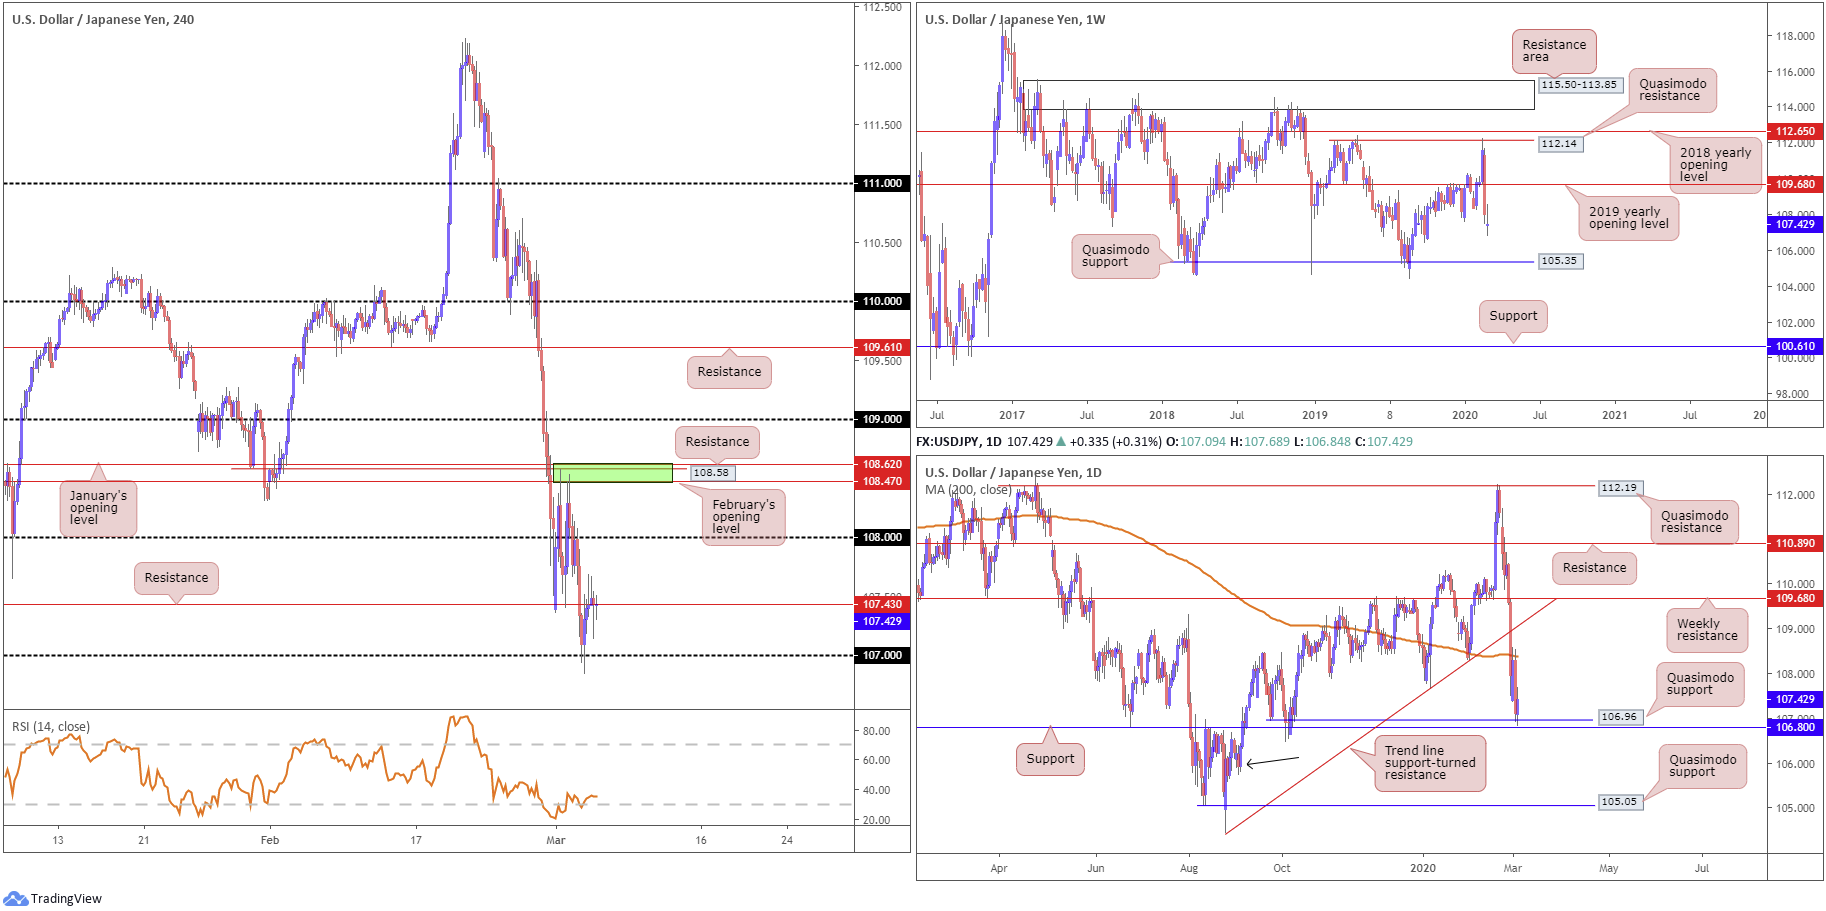
Following Fed-induced loss Tuesday, Wednesday refreshed multi-month lows at 106.84 in early activity, possibly tripping sell stops beneath the 107 handle on the H4 timeframe. Broad-based USD bidding lifted USD/JPY north of 107 in recent trade, however, surpassing resistance at 107.43 and clocking highs at 107.68, before mildly receding into the close. Prowling above current resistance, airspace visible to 108 is seen, with a break exposing a familiar resistance zone at 108.62/108.47 (green). In terms of the relative strength index (RSI) the value is seen crawling out of oversold ground, up from 20.30.
Crossing into higher-timeframe space, daily price is attempting to find legs off Quasimodo support at 106.96, reinforced by support at 106.80. The 200-day SMA (orange – 108.37) remains viable resistance on this scale, as does trend line support-turned resistance, taken from the low 104.44. Aside from possible support emerging from the 105.70ish neighbourhood (black arrow), the next port of call on this timeframe can be seen around Quasimodo support at 105.05.
The story on the weekly timeframe had price action record its largest weekly drop since July 2016 last week. Buying in this market could position price back around the 2019 yearly opening level at 109.68, whereas additional loss could see the 106.48 September (2019) 30th low enter play, with following support located around a Quasimodo formation off 105.35. Note this weekly Quasimodo support aligns closely with daily Quasimodo support at 105.05.
Areas of consideration:
The fact we have daily Quasimodo support at 106.96 surviving yesterday’s assault to multi-month lows, a decisive H4 close above H4 resistance at 107.43 may transpire today, despite room to explore lower levels on the weekly timeframe.
Intraday buying opportunities could present themselves above H4 resistance should we gather traction, targeting 108. Waiting for a retest to form off 107.43 might be worthy of consideration, knowing weekly sellers could hinder upside. The retest will likely be viewed as added confirmation buyers reside around the area.
USD/CAD:
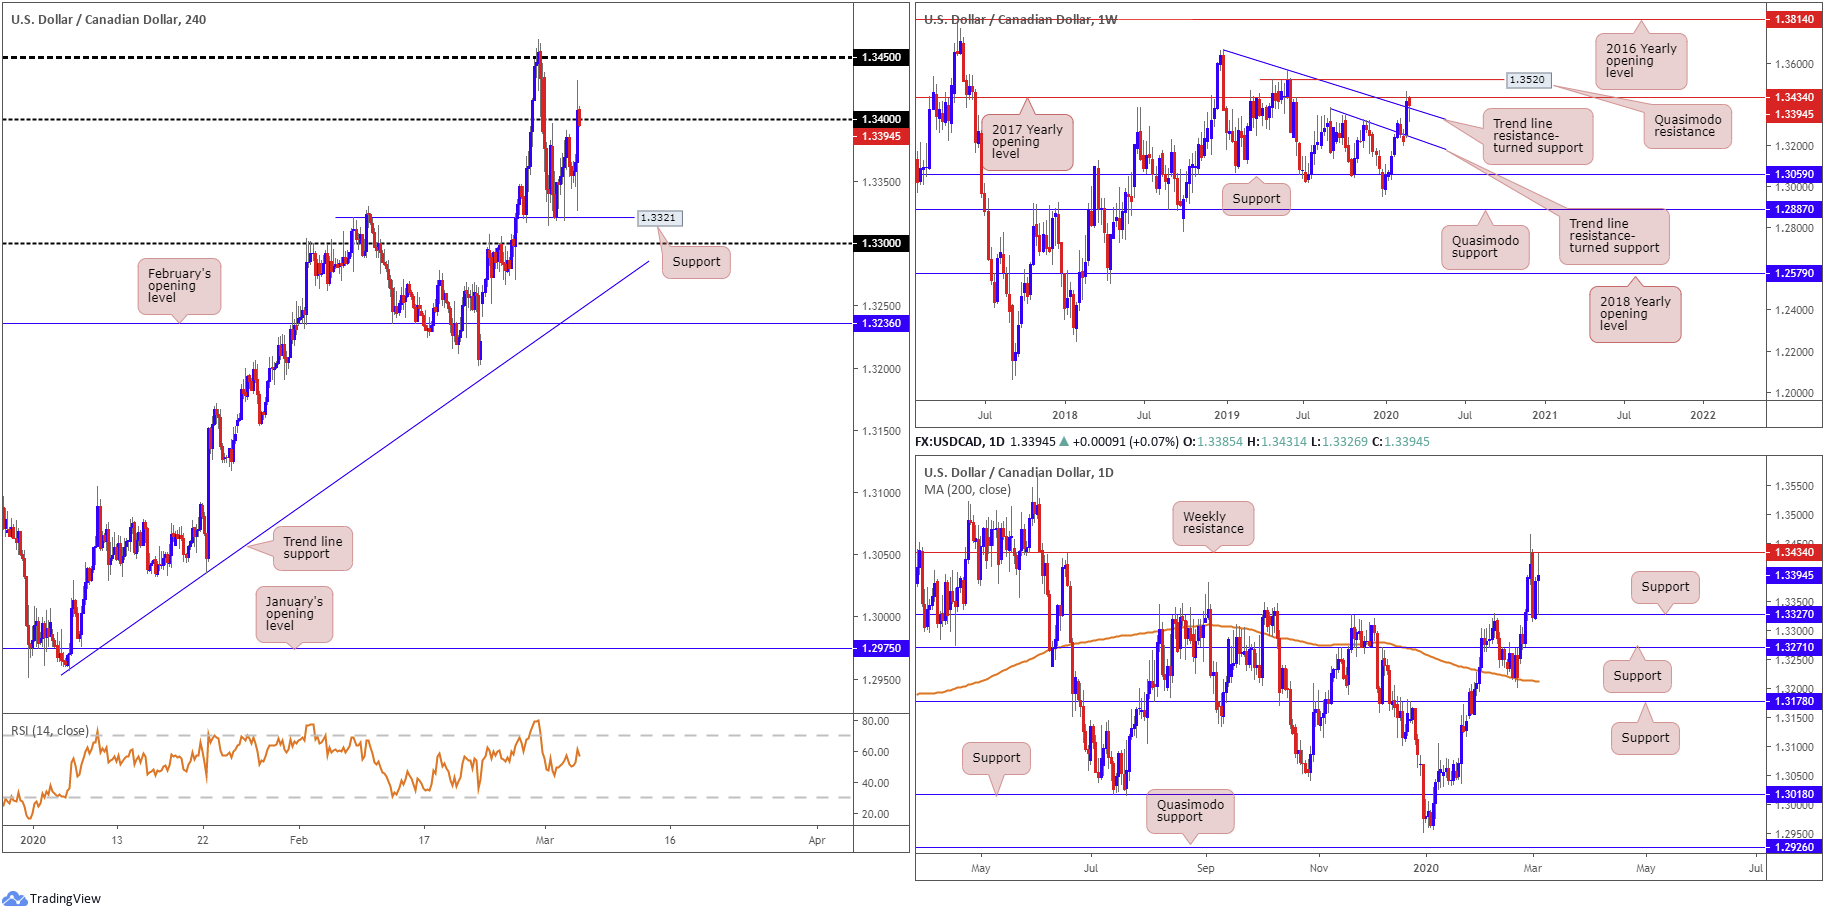
Hot on the heels of the FOMC’s emergency policy move Tuesday, the Bank of Canada (BoC) lowered its target for the overnight rate by 50 basis points to 1 ¼ percent Wednesday, as expected. This guided USD/CAD strongly higher, extending ground north of H4 support at 1.3321 and dismantling orders at 1.34 on the H4 timeframe, reaching a session high at 1.3431. Assuming we establish footing north of 1.34 today, a revisit of 1.3450 may be in store, a level which held price action lower last Friday. It might also interest some traders to note the relative strength index (RSI) is seen hovering just south of overbought territory.
On a wider perspective, weekly price has buyers and sellers squaring off between resistance at 1.3434, the 2017 yearly opening level, and a trend line resistance-turned support, from the high 1.3664. By the same token, daily price has the current weekly resistance in sight at 1.3434, while daily support resides around 1.3327.
Areas of consideration:
Intraday, buy stop-liquidity is likely consumed above 1.34, perhaps encouraging moves to 1.3450ish. Lower-timeframe support exists around 1.3390, which could provide additional incentive to defend 1.34 as support today.
Longer term, though, we face weekly resistance at 1.3434, despite price holding somewhat above trend line resistance-turned support. As such, traders are urged to tread carefully today. The technical picture, particularly weekly flow, offers an indecisive tone, and may cause a bounce in either direction, defiling otherwise sound intraday setups.
USD/CHF:
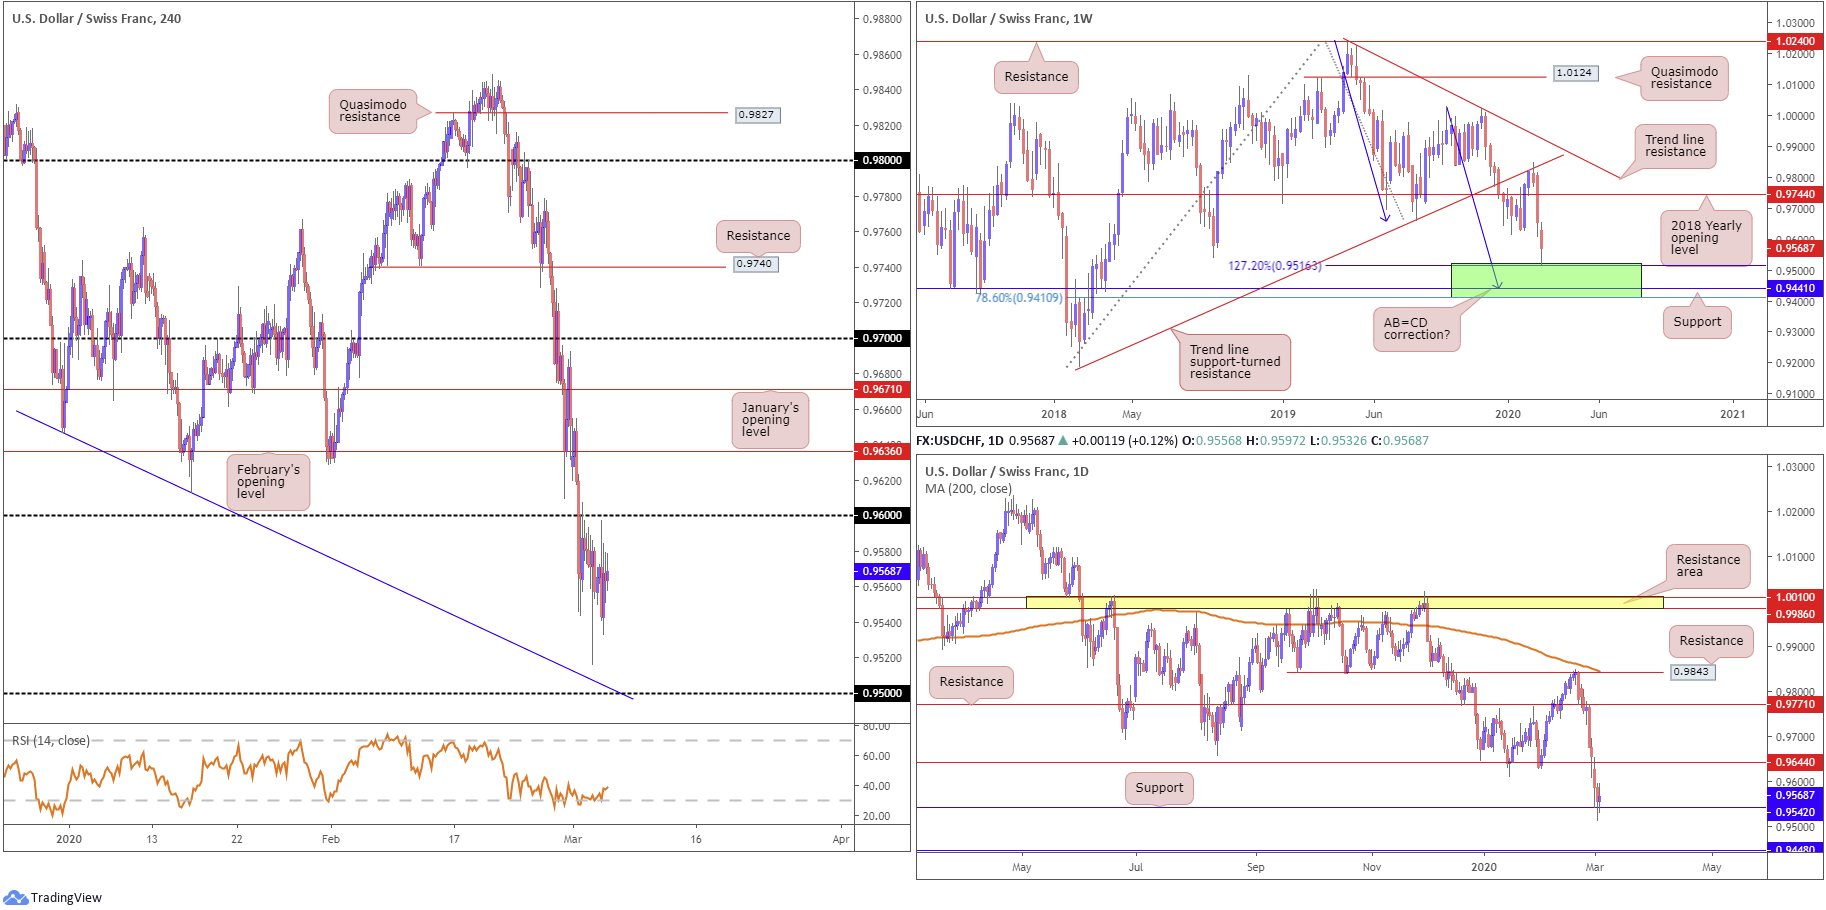
Technically, limited change was seen in this market Wednesday, fluctuating within Tuesday’s range between 0.9597/0.9515.
As highlighted in Wednesday’s technical briefing, Tuesday witnessed a knee-jerk reaction to 0.9516, levels not seen since March 2018, after the Federal Reserve’s surprise decision to cut interest rates by 50 bps. Following the initial response, the unit staged a modest recovery a touch north of H4 trend line support (blue line), taken from the low 0.9646, and the round number 0.95, though failed to reconnect with 0.96. Wednesday’s activity, as you can see, came within touching distance of 0.96, though lacked energy to tackle the round number. The relative strength index (RSI) remains loitering within oversold territory, unable to break 50.0.
Price action on the daily timeframe had the pair nudge through the 0.9542 September 21st low (2018) in recent trade, likely running a truckload of sell stops in the process. Support at 0.9448 is in sight should we overthrow current support, while further rejection could land the market at resistance drawn from 0.9644.
0.9410/0.9516, which entered the fight yesterday, offers potential support on the weekly timeframe (green) – comprised of a 78.6% Fibonacci retracement at 0.9410, support at 0.9441 and a 127.2% AB=CD bullish correction (black arrows) at 0.9516.
Areas of consideration:
Testing the weekly support area coming in at 0.9410/0.9516, along with price action potentially running sell stops beneath the 0.9542 September 21st low (2018), could spark a recovery in this market. A break above 0.96 would help validate buyer intent and likely entice breakout buying. H4 resistance resides at 0.9636, February’s opening level, followed by daily resistance at 0.9644 and then January’s opening level at 0.9671.
Dow Jones Industrial Average:
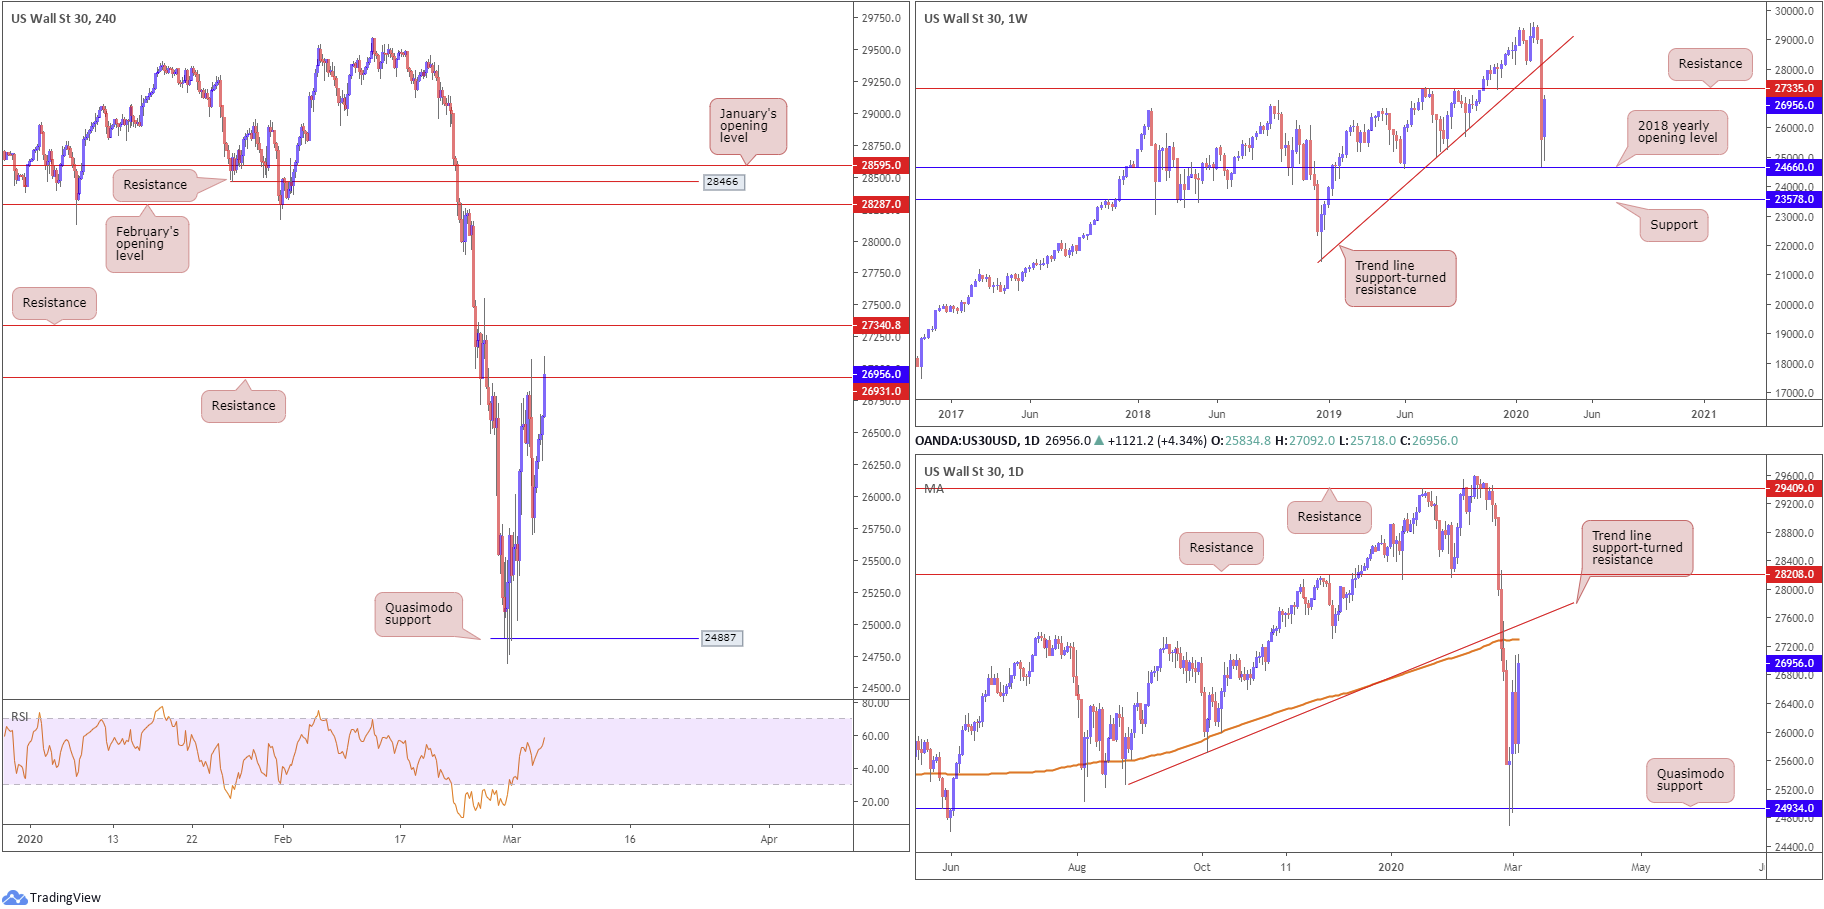
US equities staged an impressive recovery Wednesday as the market warmed to the Federal Reserve’s surprise interest-rate cut and support from other central banks. The Dow Jones Industrial Average added 1173.45 points, or 4.53%; the S&P 500 gained 125.75 points, or 4.19% and the tech-heavy Nasdaq 100 ended higher by 283.49 points, or 3.19%.
Technical research reveals weekly price nearing resistance at 27335, following last week’s action bottoming a touch north of the 2018 yearly opening level at 24660. The aforementioned resistance is a key level in this market – expect the possibility of activity developing from this region. In line with the weekly timeframe, we can see price action on the daily timeframe closing in on the 200-day SMA (orange – 27301), closely followed by trend line support-turned resistance, taken from the low 25264.
Across the page on the H4 timeframe, we recently stabbed through familiar resistance at 26931, after extending north of Tuesday’s session low at 25700. The current H4 resistance at 26931 offers little in terms of supporting confluence, both locally and from the higher timeframes, despite recently capping upside.
The more appealing resistance on the H4 timeframe, in terms of technical studies, resides around 27340. Not only does it boast strong history, the level converges closely with weekly resistance at 27335 and daily resistances, the 200-day SMA and the trend line support-turned resistance.
Areas of consideration:
H4 resistance at 27340 is likely eyed as a potential ceiling today, having noted surrounding confluence. A pullback from here will likely make its way to 26931, an acting support. However, moves beyond here to 25700 is also a possible scenario, re-opening the door for bearish themes, either on the downside breakout candle close (H4), or, for more conservative traders, a retest motion at the underside of 26931.
XAU/USD (GOLD):
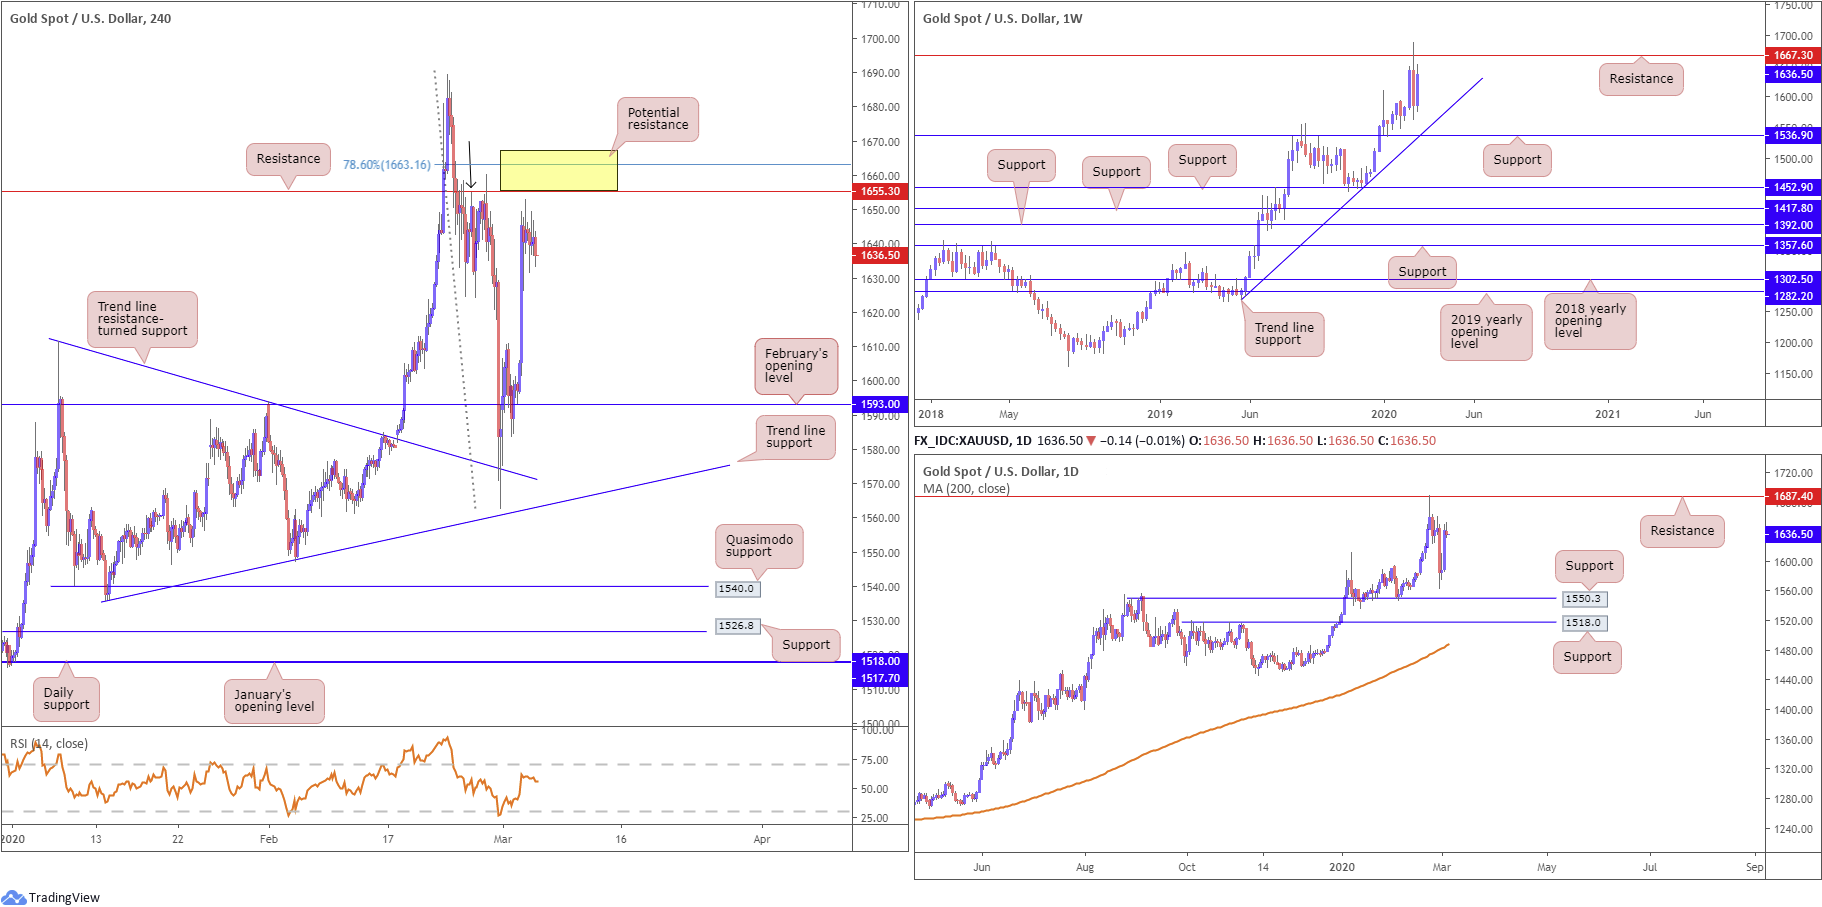
Bullion alternated between tepid gains/losses Wednesday, confined in a narrow trading band just south of weekly tops. As a result of yesterday’s lacklustre performance, much of the following report will echo points put forward in yesterday’s briefing.
Demand for the safe-haven metal surged Tuesday after the US Federal Reserve announced a surprise rate cut of 50 bps. US government bonds rallied, sending yields lower; the Japanese yen also caught a strong bid as did the Swiss franc.
Technically, bullion retested February’s opening level at 1593.0, albeit not to-the-point, and advanced, with price action on the H4 timeframe seen closing in on resistance at 1655.3 (also denotes Quasimodo resistance [see left shoulder marked with black arrow]). What’s also interesting is a 78.6% Fibonacci retracement ratio standing at 1663.1. Note also the relative strength index (RSI) is poised to shake hands with overbought levels.
The weekly timeframe shows that despite the week concluding in the shape of a bearish outside candle pattern, capped by resistance at 1667.3, gold recently reclaimed all of the prior week’s losses. As a result, traders could see the said resistance re-enter the fray this week.
On the daily timeframe, support at 1550.3 was left unchallenged prior to the recent advance, with upside reasonably free until crossing swords with resistance coming in at 1687.4.
Areas of consideration:
Between the 78.6% H4 Fibonacci retracement at 1663.1 and resistance at 1655.3, a potential ceiling is seen. However, in order to avoid whipsaws, traders may embrace weekly resistance at 1667.3, expanding 1663.1/1655.3, marked using a yellow box. Although this area now encompasses weekly structure, daily resistance falls in at 1687.4; therefore, the possibility of price running through the said reversal zone is still conceivable. Consequently, traders may seek additional confirmation before committing.
The accuracy, completeness and timeliness of the information contained on this site cannot be guaranteed. IC Markets does not warranty, guarantee or make any representations, or assume any liability regarding financial results based on the use of the information in the site.
News, views, opinions, recommendations and other information obtained from sources outside of www.icmarkets.com.au, used in this site are believed to be reliable, but we cannot guarantee their accuracy or completeness. All such information is subject to change at any time without notice. IC Markets assumes no responsibility for the content of any linked site.
The fact that such links may exist does not indicate approval or endorsement of any material contained on any linked site. IC Markets is not liable for any harm caused by the transmission, through accessing the services or information on this site, of a computer virus, or other computer code or programming device that might be used to access, delete, damage, disable, disrupt or otherwise impede in any manner, the operation of the site or of any user’s software, hardware, data or property.


