
EUR/USD:
Although the single currency managed to post marginal gains from its bounce off of a H4 Quasimodo support at 1.2258 on Wednesday, it was unable to capture the 1.23 handle.
In terms of yesterday’s economic data, there is not really much to shout about. US ADP employment report saw an increase of 241K in private payrolls in March, beating consensus. There was a small bid in USD, but moves were brief. The US ISM Non-manufacturing fell from 59.5 to 58.8, versus a 59.0 market consensus.
As the market ended the day relatively unchanged, higher-timeframe structure remains the same as in Wednesday’s outlook. On the weekly timeframe, price recently exited beyond the lower edge of a major-league weekly supply at 1.2569-1.2287, which has held price captive since late January. Downside targets from this angle fall in around the weekly support band at 1.2044, shadowed closely by the 2018 yearly opening level at 1.2004. Daily flow, on the other hand, is seen trading within striking distance of a daily support area coming in at 1.2246-1.2164 that communicates beautifully with a long-term daily trend line support etched from the low 1.0569. This area, like the weekly supply zone, has also capped market action since late January.
Potential trading zones:
Well done to those who took advantage of yesterday’s bounce from the aforementioned H4 Quasimodo support, as this was a noted move to watch out for in Wednesday’s report.
Moving forward, the team has noted that the said H4 Quasimodo may present another buying opportunity today in the shape of a fakeout. Watch for H4 price to chalk up a bullish pin-bar formation (see chart for example) that pierces through the Quasimodo and taps the top edge of the converging daily support area and daily trend line (sits ten or so pips below). The ultimate take-profit target from here can be set at 1.2446: a daily resistance. Short-term targets, however, can be found at 1.23, followed by the H4 resistance at 1.2336.
Data points to consider today: US unemployment claims; FOMC member Bostic speech.

Areas worthy of attention:
Supports: 1.2258; 1.2246-1.2164; daily trend line support; 1.2044; 1.2004.
Resistances: 1.23; 1.2336; 1.2446; 1.2569-1.2287.
GBP/USD:
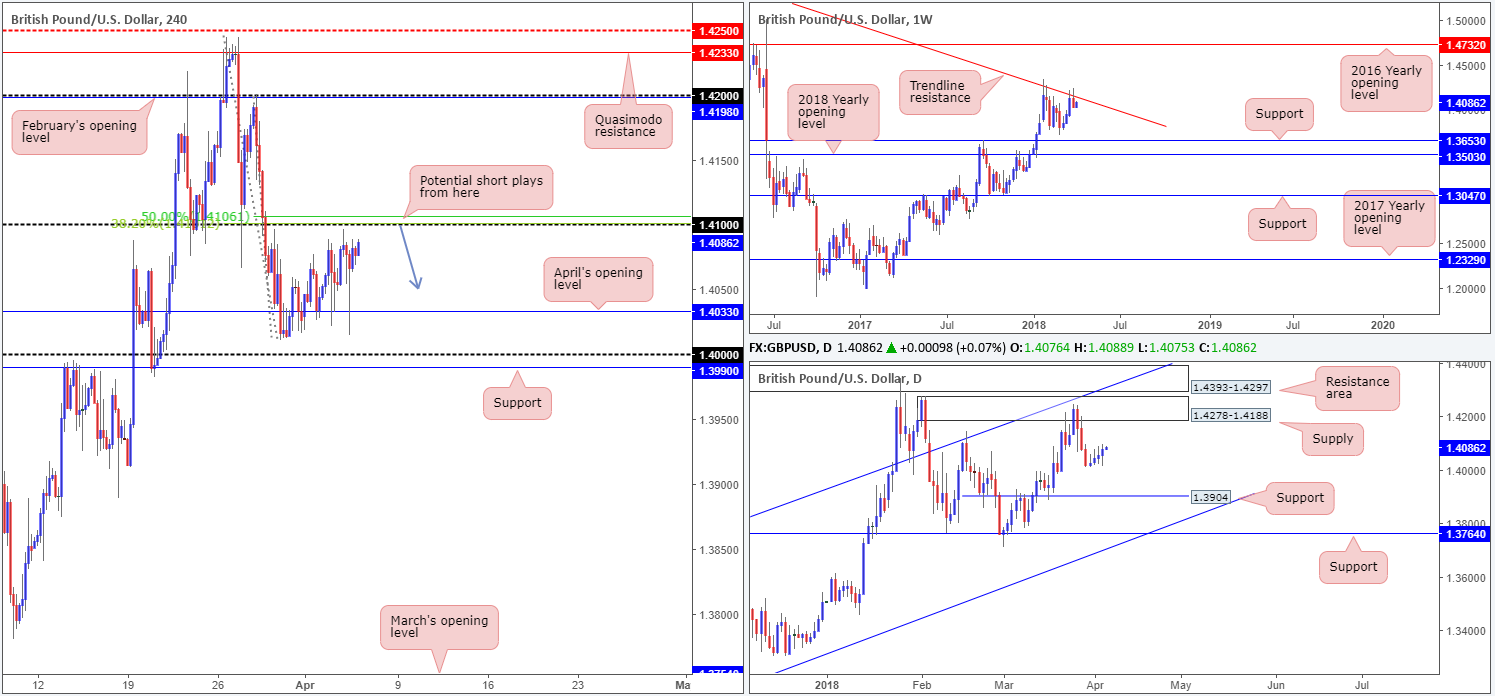
The GBP/USD initially fell following a weak UK construction PMI on Wednesday, with the downfall accelerating in early US hours after the release of better-than-expected ADP out of the US. The ADP report sparked a small bid in USD, but moves were fleeting, which, in turn, reignited GBP buying off of April’s opening level seen on the H4 timeframe at 1.4033. In a similar fashion to Wednesday’s outlook, the next port of call on the H4 scale, should the bulls continue to bid the market higher, can be seen at the 1.41 handle, shadowed closely by a H4 50.0% resistance value carved in at 1.4106 and a H4 38.2% Fib resistance at 1.4101.
While intraday traders hone in on a potential move north, weekly movement is seen trading blows with a weekly trend line resistance taken from the high 1.5930. Having seen this line force price in excess of 500 pips lower in early January, there’s a chance we may see history repeat itself here. On the other side of the spectrum, daily flows trade in no man’s land between a daily supply zone at 1.4278-1.4188 and a daily support at 1.3904.
Potential trading zones:
In light of the weekly trend line resistance, the team’s spotlight is still firmly pressed on the 1.41 neighborhood today. Coupled with the highlighted converging Fibonacci ratios, a reaction from this region is likely.
Ideally, the initial take-profit zone can be set at the aforementioned April’s opening level, followed then by the key figure 1.40. A break of this line could the potentially open up the path south to the daily support mentioned above at 1.3904. As you can see, there is potential for huge gains!
Data points to consider today: UK services PMI; US unemployment claims; FOMC member Bostic speech.
Areas worthy of attention:
Supports: 1.4033; 1.40; 1.3990; 1.3904.
Resistances: 1.41; 1.4278-1.4188; weekly trend line resistance.
AUD/USD:
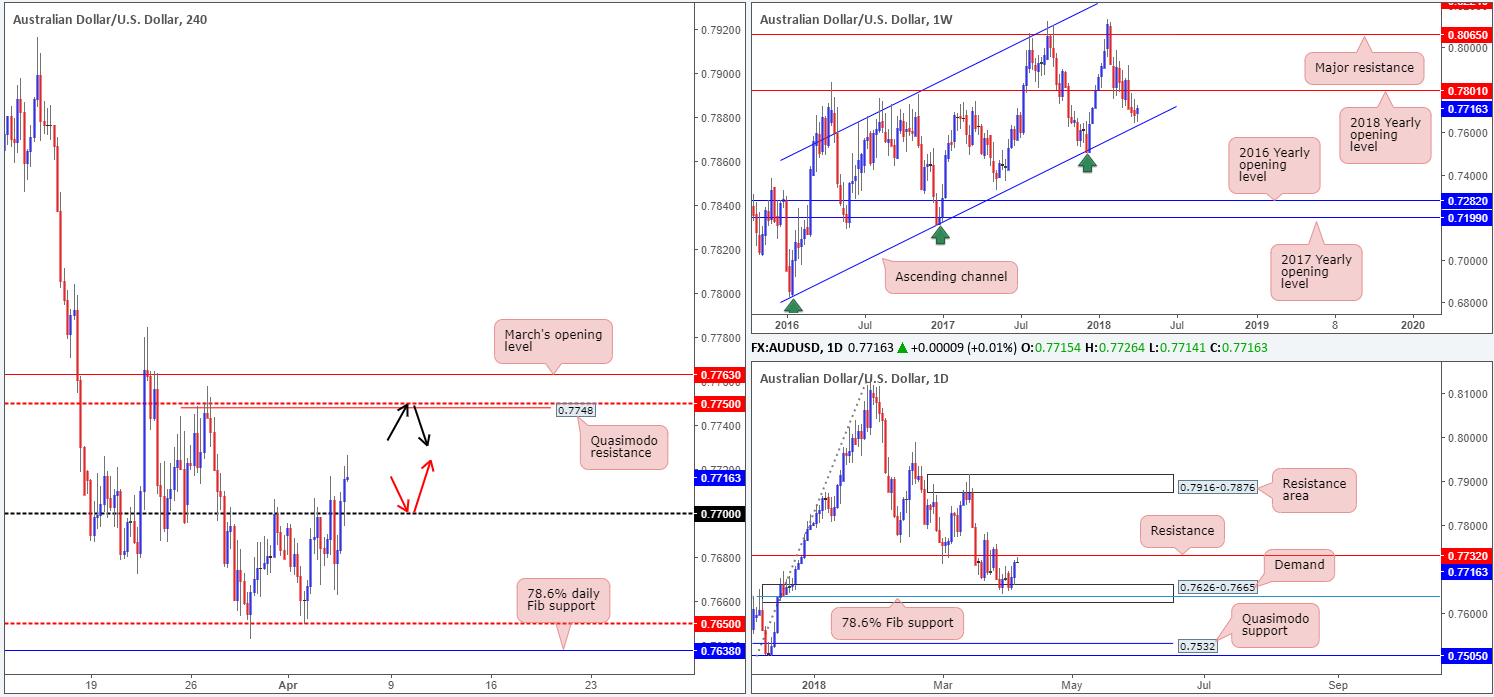
The commodity currency, as you can see, staged an advance on Wednesday, following an upside beat on Aussie retail sales. The pair, however, lost ground after shaking hands with a high of 0.7717 as China hit the US with a round of reciprocal tariffs. The AUD/USD was able to stabilize mid-way through London’s session at a low of 0.7662, reclaiming the 0.77 handle and pressing to a high of 0.7721 by the day’s end.
Although intraday traders are now likely honing in on the H4 mid-level resistance at 0.7750, shadowed closely by a H4 Quasimodo resistance at 0.7748, we may see price action turn lower before this point. Directly overhead, the team has penciled in a strong daily resistance level at 0.7732, which boasts a robust history. From another point of view, though, weekly price recently turned higher just north of a long-term weekly channel support taken from the low 0.6827.
Potential trading zones:
Longer term, this is a tricky market to read given the conflicting opinions being seen on the weekly and daily charts.
Short term (H4 and lower), nevertheless, 0.77 could be an ideal spot look for an intraday retest play (see red arrows). Failing that, shorts from the 0.7750 region may be an alternative strategy (see black arrows). However, do keep in mind that a potential fakeout up to March’s opening level at 0.7763 could be seen.
Data points to consider today: AUD trade balance; US unemployment claims; FOMC member Bostic speech.
Areas worthy of attention:
Supports: 0.77; weekly channel support.
Resistances: 0.7750/48; 0.7763; 0.7732.
USD/JPY:
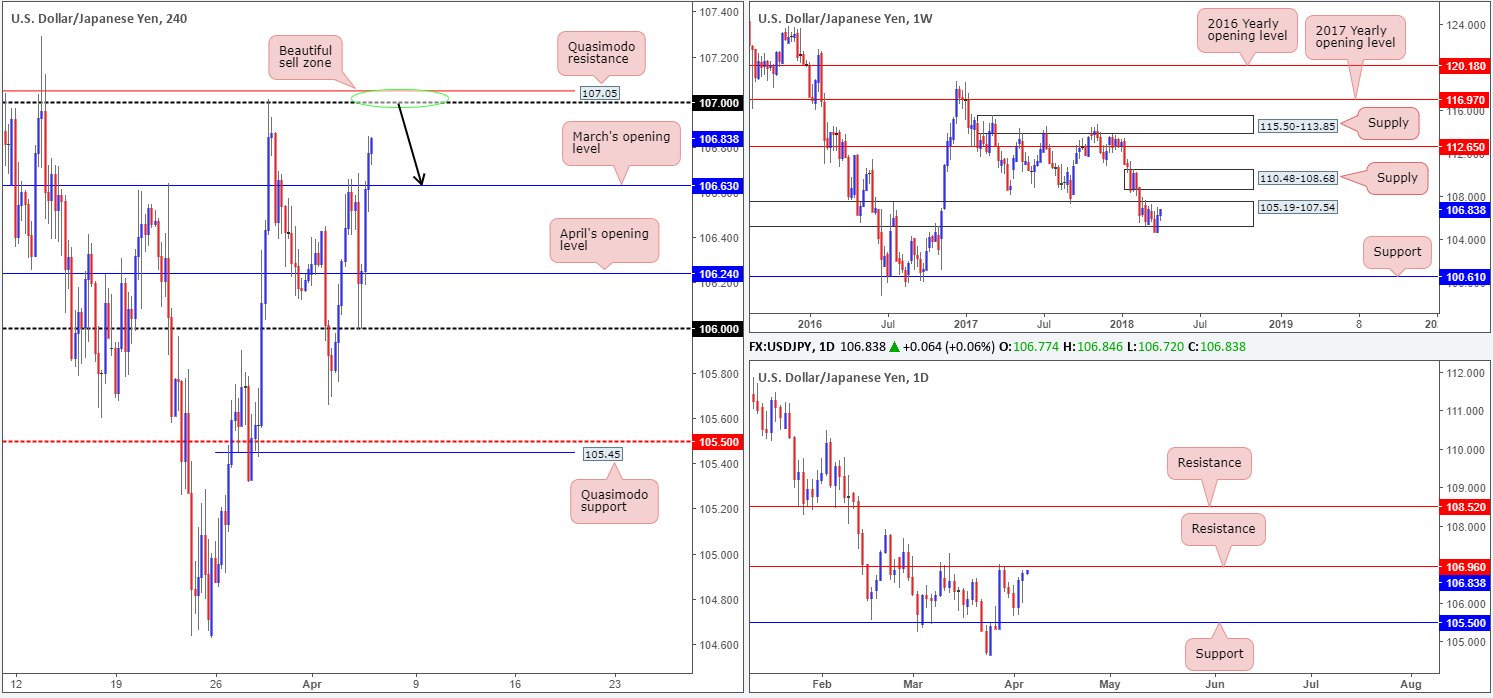
During the course of Wednesday’s sessions, some of the bid havens had deflated slightly, helping lift the USD/JPY to higher ground. The pair initially plunged alongside US equities amid European trade on escalating tensions between the US and China. Despite this, Wall Street managed to turn things around and punch to fresh highs, consequently pulling H4 price (USD/JPY) north from the 106 handle to a high of 106.84.
Recent movement, as you can probably see on the daily picture, brought the unit up to within shouting distance of a daily resistance level pegged at 106.96. Weekly price, on the other hand, is a little trickier to read. Following a decisive close beneath 105.19-107.54, the USD/JPY rotated back to the upside last week in strong fashion. At this point in time, it is still difficult to know whether 105.19-107.54 is a support or resistance area!
Potential trading zones:
The focus remains on the 107 handle seen overhead on the H4 timeframe. Not only is it shadowed closely by a H4 Quasimodo resistance at 107.05, it is also positioned nearby the daily resistance mentioned above at 106.96.
With stop-loss orders sited above the apex of the H4 Quasimodo head at 107.29, a move down to at least March’s opening level at 106.63 is likely on the cards – plenty of room for partial profit taking!
Data points to consider today: US unemployment claims; FOMC member Bostic speech.
Areas worthy of attention:
Supports: 106.63.
Resistances: 107; 107.05; 106.96.
USD/CAD:
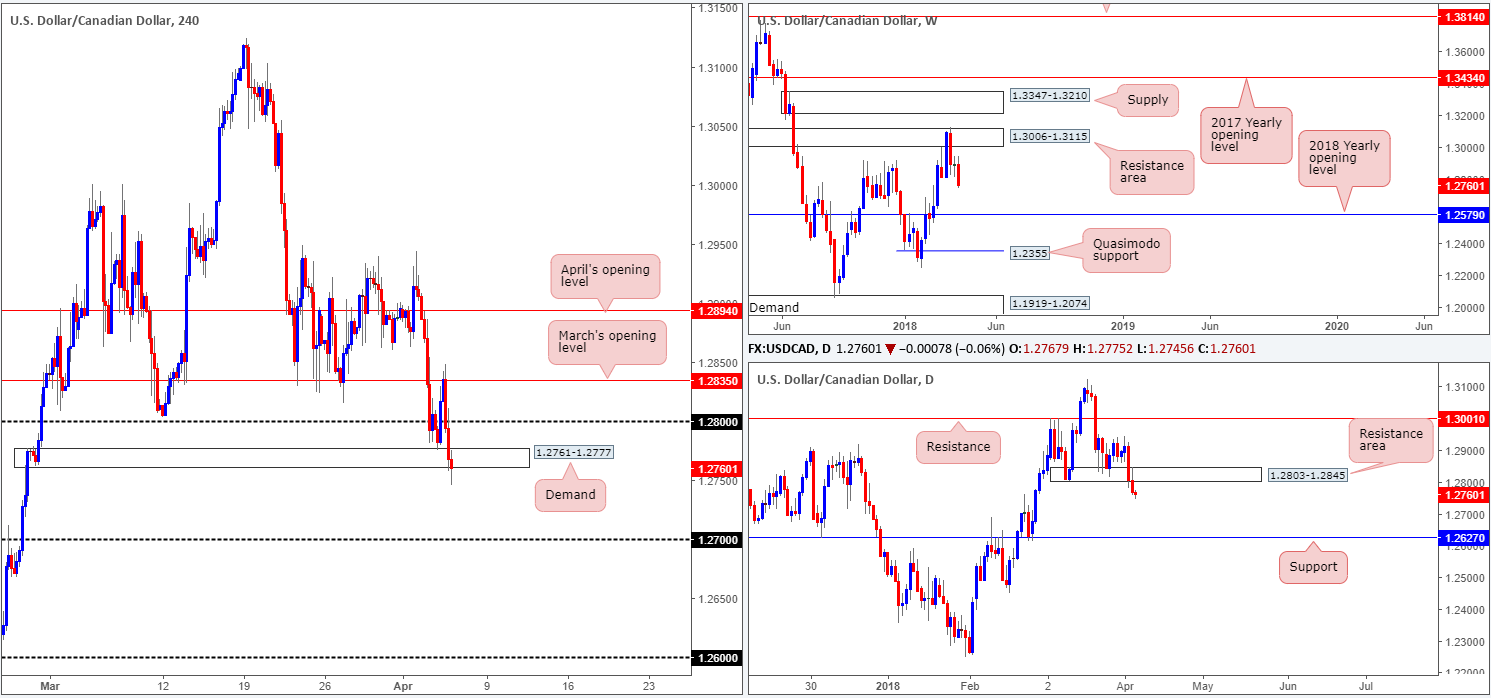
The Canadian dollar continued to ride the positive wind of NAFTA commentary on Wednesday, with the USD/CAD seen registering its second consecutive daily loss.
On the weekly timeframe, further downside is still very much a strong possibility. Continued selling from current prices shows room to press as far south as the 2018 yearly opening level at 1.2579. Turning the focus over to the daily timeframe, we can see that recent movement has positioned the pair beneath daily demand at 1.2803-1.2845 (now acting daily resistance area). The next port of call beyond here can be seen in the shape of a daily support level at 1.2627.
Looking over at the H4 timeframe, the pair established firm resistance in the market going into yesterday’s US session after retesting March’s opening level at 1.2835. The move pushed through the 1.28 handle and, in recent hours, pierced through H4 demand plotted at 1.2761-1.2777. Tripping stop-loss order beneath here may have potentially set the stage for a continuation move south to 1.27 today.
Potential trading zones:
Traders should consider waiting to see if H4 price can close beneath the noted H4 demand. This – coupled with a retest to the underside of the area that holds – would be enough evidence to suggest a short, targeting 1.27 as an initial take-profit zone.
Data points to consider today: US unemployment claims; FOMC member Bostic speech; CAD trade balance.
Areas worthy of attention:
Supports: 1.27; 1.2761-1.2777; 1.2579; 1.2627.
Resistances: 1.28; 1.2835; 1.2803-1.2845.
USD/CHF:
The US dollar increased in value against its Swiss counterpart on Wednesday, despite trade war fears plaguing the markets.
Finally conquering the 0.96 handle seen on the H4 timeframe, the move almost immediately positioned the unit around the underside of a H4 supply pulled from late Jan 2018 at 0.9633-0.9612. Traders might also want to note that surrounding the current H4 supply is a larger supply zone seen on the daily timeframe at 0.9666-0.9589. Selling from the H4 supply comes with a couple of cautionary points to consider. Firstly, you will be shorting into a trending market. Secondly, last week’s action established a base of support off of a weekly area marked at 0.9443-0.9515 in the shape of a strong-looking weekly bullish engulfing candle.
Potential trading zones:
Although there are clear risks in shorting this market, we feel that a decisive H4 close beneath the 0.96 handle would be considered a bearish cue to take prices down to at least the H4 mid-level support plotted at 0.9550. In order to pin down an entry, however, we would strongly recommend waiting for H4 price to retest the underside of 0.96 in the shape of a full or near-full-bodied H4 bear candle. That way, you can be reasonably confident that bearish intent is present.
Data points to consider today: US unemployment claims; FOMC member Bostic speech; CHF Gov. Board Member Maechler speech.

Areas worthy of attention:
Supports: 0.96; 0.9550; 0.9443-0.9515.
Resistances: 0.9633-0.9612; 0.9666-0.9589.
DOW 30:
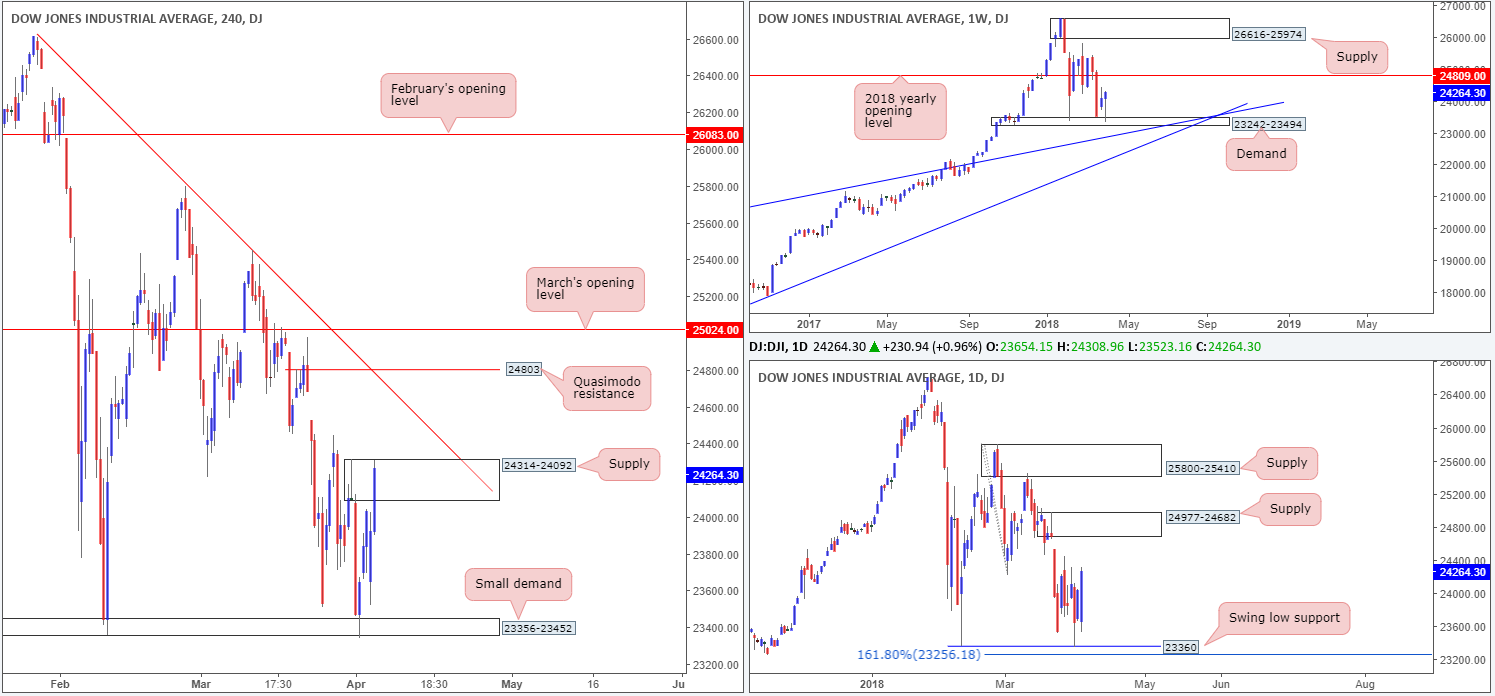
The Dow Jones Industrial Average put in a strong performance on Wednesday, despite risk aversion sending the index lower at the opening bell.
Concluding the day up nearly 1%, we can see that the H4 candles aggressively drove into a H4 supply area formed at 24314-24092. Should the unit climb higher today, there’s a chance that the H4 Quasimodo resistance level at 24803/H4 trend line resistance extended from the high 26608 may be brought into the fray.
According to the higher-timeframe picture, further upside is likely. The next upside target on the daily timeframe is seen around a daily supply pegged at 24977-24682, which houses a 2018 yearly opening level printed on the weekly timeframe at 24809. Also worthy of note is the strong candle reaction seen off of the weekly demand area at 23242-23494, currently on track to end the week in the shape of a weekly bullish pin-bar formation.
Potential trading zones:
Technically speaking, we still feel price could potentially climb higher. However, traders likely remain fearful of any fresh trade actions.
Longs above the current H4 supply could be an option today, targeting the lower edge of the noted daily supply/H4 trend line resistance. A preferred method of entry, however, would be waiting for H4 price to retest the broken H4 supply as a support area before pulling the trigger.
Data points to consider today: US unemployment claims; FOMC member Bostic speech.
Areas worthy of attention:
Supports: 23242-23494.
Resistances: 24314-24092; 24803; H4 trend line resistance; 24977-24682.
GOLD:
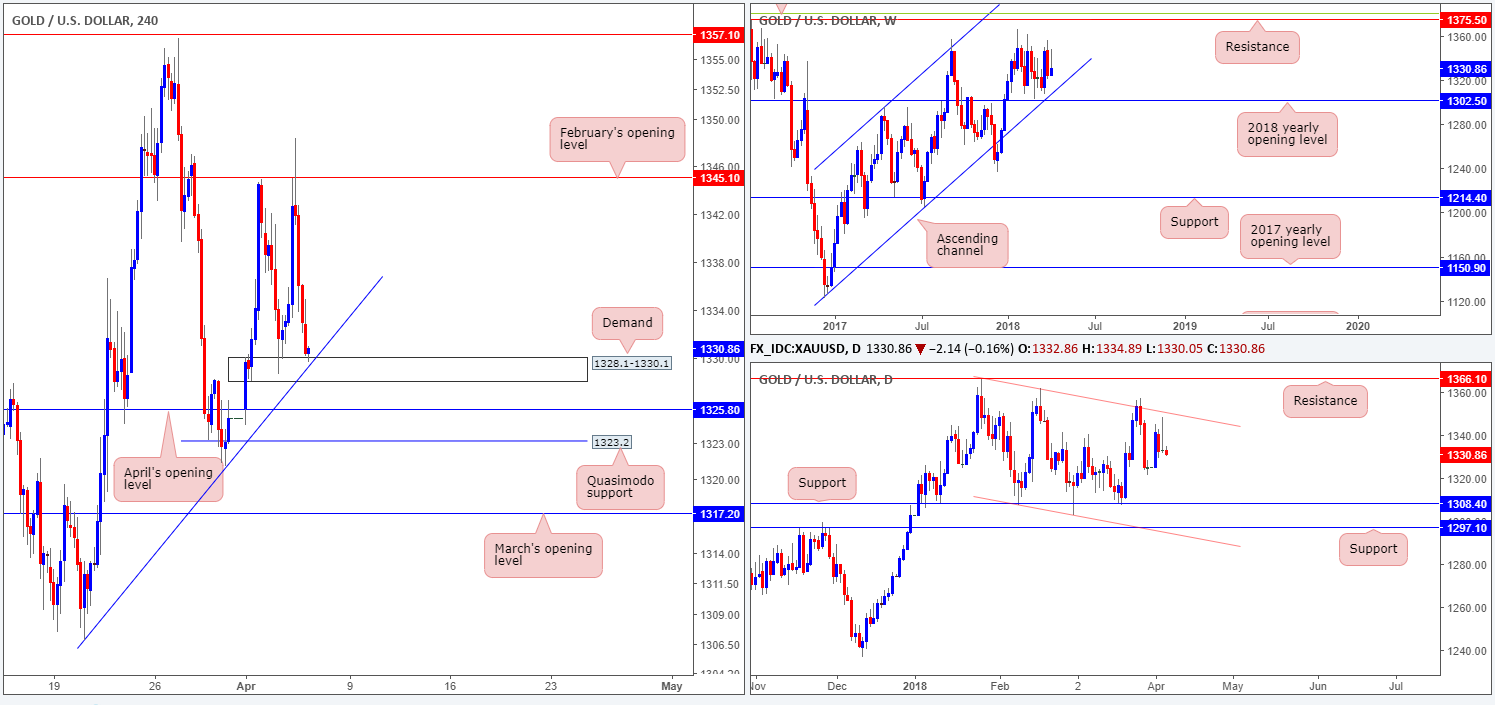
As the US dollar holds on to its gains, the price of bullion aggressively punched lower in recent trading. Unable to sustain gains beyond February’s opening level seen on the H4 timeframe at 1345.1, the yellow metal fell sharply and ended the day closing just north of a proven H4 demand base coming in at 1328.1-1330.1 (in recent hours, this area has been tested and is currently holding).
Yesterday’s push north, prior to the descent, came within touching distance of connecting with a daily channel resistance line extended from the high 1366.0. It might also be worth noting that yesterday’s action closed in the form of a daily bearish pin-bar formation. Meanwhile, weekly price remains floating between the 2018 yearly opening level at 1302.5 (fuses closely with a long-term weekly channel support etched from the low 1122.8) and weekly resistance pegged at 1375.5/38.2% weekly Fib resistance at 1381.0.
Potential trading zones:
Given Tuesday’s reaction off of the current H4 demand area, buying pressure may very well be weak. What we do like here, however, is the convergence of a H4 trend line support taken from the low 1306.9. This could be enough to entice buyers to bid prices higher from here again today (interested buyers are recommended to wait for a H4 full or near-full-bodied bullish candle to form, thus proving that there is buying interest). Should the current demand fail, nonetheless, keep an eye on April’s opening level seen nearby at 1325.8 and a H4 Quasimodo support at 1323.2.
Areas worthy of attention:
Supports: 1328.1-1330.1; 1325.8; 1323.2; 1302.5; weekly channel support.
Resistances: 1345.1; 1375.5; daily channel resistance.
This site has been designed for informational and educational purposes only and does not constitute an offer to sell nor a solicitation of an offer to buy any products which may be referenced upon the site. The services and information provided through this site are for personal, non-commercial, educational use and display. IC Markets does not provide personal trading advice through this site and does not represent that the products or services discussed are suitable for any trader. Traders are advised not to rely on any information contained in the site in the process of making a fully informed decision.
This site may include market analysis. All ideas, opinions, and/or forecasts, expressed or implied herein, information, charts or examples contained in the lessons, are for informational and educational purposes only and should not be construed as a recommendation to invest, trade, and/or speculate in the markets. Any trades, and/or speculations made in light of the ideas, opinions, and/or forecasts, expressed or implied herein, are committed at your own risk, financial or otherwise.
The use of the site is agreement that the site is for informational and educational purposes only and does not constitute advice in any form in the furtherance of any trade or trading decisions.
The accuracy, completeness and timeliness of the information contained on this site cannot be guaranteed. IC Markets does not warranty, guarantee or make any representations, or assume any liability with regard to financial results based on the use of the information in the site.
News, views, opinions, recommendations and other information obtained from sources outside of www.icmarkets.com.au, used in this site are believed to be reliable, but we cannot guarantee their accuracy or completeness. All such information is subject to change at any time without notice. IC Markets assumes no responsibility for the content of any linked site. The fact that such links may exist does not indicate approval or endorsement of any material contained on any linked site.
IC Markets is not liable for any harm caused by the transmission, through accessing the services or information on this site, of a computer virus, or other computer code or programming device that might be used to access, delete, damage, disable, disrupt or otherwise impede in any manner, the operation of the site or of any user’s software, hardware, data or property.


