
A note on lower timeframe confirming price action…
Waiting for lower timeframe confirmation is our main tool to confirm strength within higher timeframe zones, and has really been the key to our trading success. It takes a little time to understand the subtle nuances, however, as each trade is never the same, but once you master the rhythm so to speak, you will be saved from countless unnecessary losing trades. The following is a list of what we look for:
- A break/retest of supply or demand dependent on which way you’re trading.
- A trendline break/retest.
- Buying/selling tails/wicks – essentially we look for a cluster of very obvious spikes off of lower timeframe support and resistance levels within the higher timeframe zone.
- Candlestick patterns. We tend to only stick with pin bars and engulfing bars as these have proven to be the most effective.
We search for lower timeframe confirmation between the M15 the H1 timeframes, since most of our higher-timeframe areas begin with the H4. Stops are usually placed 5-10 pips beyond confirming structures.
EUR/USD:
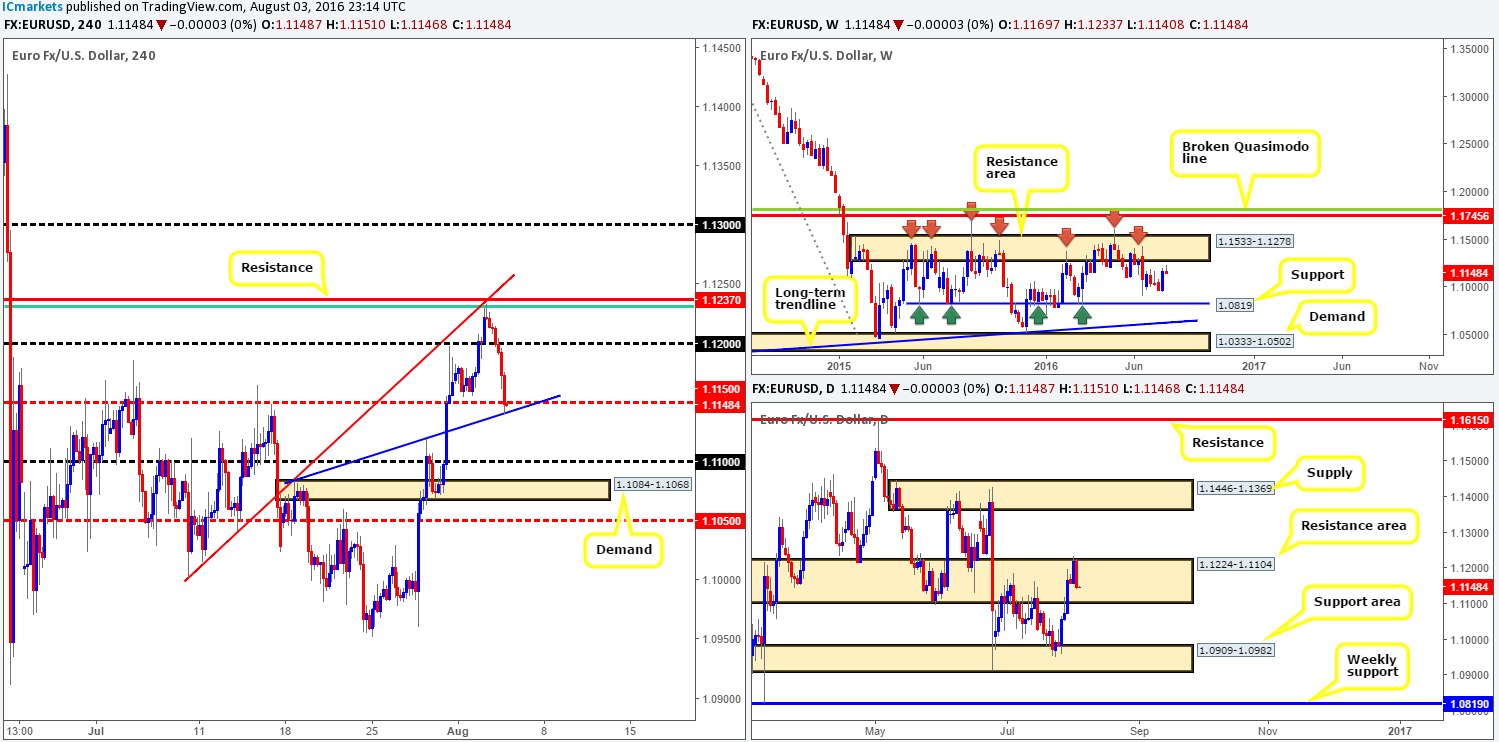
Recent action saw the single currency extend lower yesterday, following a to-the-pip reaction from the H4 61.8% Fib at 1.1231. Bolstered by a H4 resistance line at 1.1237, as well as a H4 trendline swap taken from the low 1.1069 and also better than expected US private employment data, this move collectively managed to erase Wednesday’s gains!
As can be seen from the from the H4 chart, the pair concluded trade around the H4 mid-way support drawn in at 1.1150 which intersects beautifully with a minor H4 trendline support taken from the high 1.1084. Although there’s a relatively nice-looking H4 supply seen nearby on the USDX around the 95.85/95.68 region that could potentially halt further selling today, we still feel the 1.1150 line is on the verge of giving up. The reason? Take a quick peek at the daily chart. The candles remain trading within a relatively long-term daily resistance area penciled in at 1.1224-1.1104, with room seen to move lower.
Our suggestions: Should a H4 close be seen below both 1.1150 as well as the above said H4 trendline support, look to short down to at least the 1.11 region. Aggressive traders may look to sell the breakout candle with their stops a few pips above the wick, while more conservative traders will likely wait to see if price retests the underside of this broken barrier as resistance before making a decision. Now, for us personally we favor the latter since we also would like to see a lower timeframe sell signal form following the retest (see the top of this report) before our capital is put at risk.
Levels to watch/live orders:
- Buys: Flat (Stop loss: N/A).
- Sells: Watch for price to close below the H4 mid-way support 1.1150 and look to trade any retest seen thereafter (lower timeframe confirmation required).
GBP/USD:
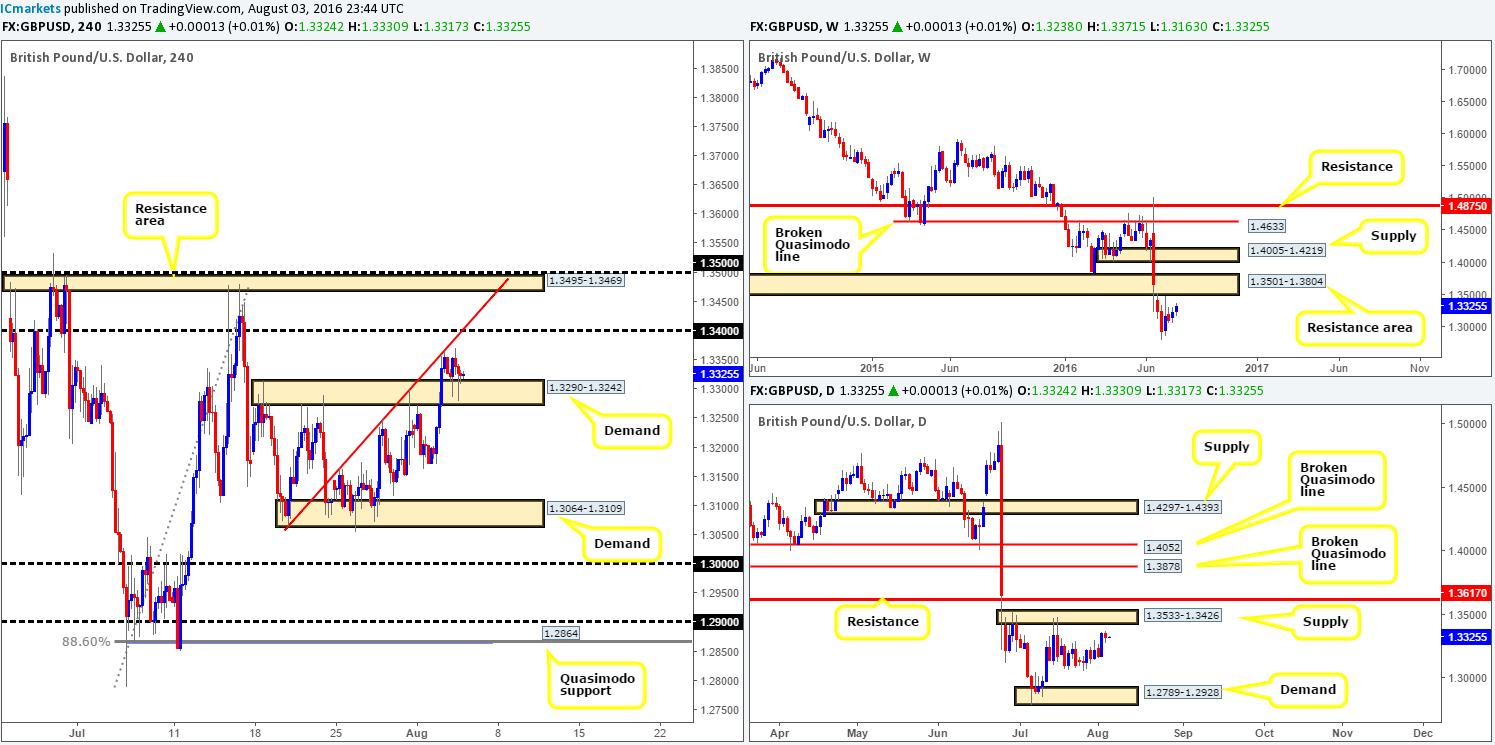
In comparison to Tuesday’s rally cable took on more of a sober approach yesterday, ranging around ninety pips between the H4 trendline swap extended from the low 1.3064 and a H4 demand base seen at 1.3290-1.3242. With the highly anticipated BoE rate decision set to hit the spotlight later on today, we feel price will remain within yesterday’s range until then as traders take on a more cautious stance.
An area to keep an eye on during this event is the weekly resistance barrier coming in at 1.3501-1.3804 and by extension the daily supply at 1.3533-1.3426 which is glued to underside of this weekly zone. Attempting to trade during the above said event is not something our team would advise. Waiting for the dust to settle, and then looking to reassess the landscape before making trading decisions would, at least in our opinion, be the more conservative route to take. Yes it is boring, we know! But this is trading and it should be just that, boring, disciplined and methodical.
Levels to watch/live orders:
- Buys: Flat (Stop loss: N/A).
- Sells: Flat (Stop loss: N/A).
AUD/USD:
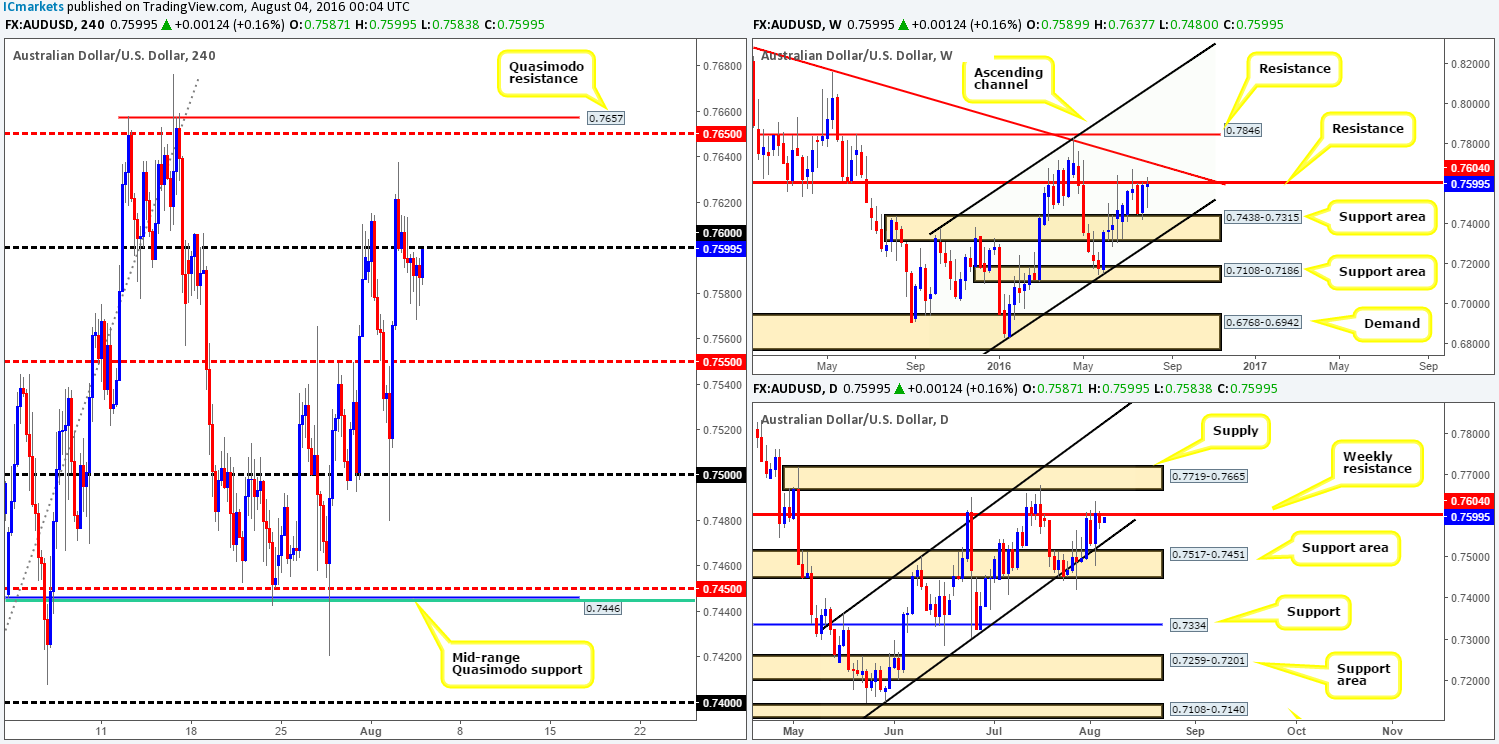
In view of weekly price still meandering around the weekly resistance level registered at 0.7604, technically speaking the pair is likely to sell off back down to the weekly support area seen at 0.7438-0.7315. However, with the daily chart pointing out that a daily channel support line (extended from the low 0.7148) is lurking just below the weekly level, this is certainly a concern from a selling standpoint!
Stepping across to the H4 chart, we can see that the commodity currency has just recently retested the 0.76 band. While we do agree that the daily channel support line is troublesome, a short from 0.76 (preferably with the backing of a lower timeframe signal) is still a possibility down to the H4 mid-way support 0.7550, since this is where the daily channel line comes together.
Our suggestions: Look for lower timeframe entries (see the top of this report for lower timeframe entry techniques) off of the 0.76 barrier today, targeting the H4 mid-way support 0.7550. As we already know that this line intersects with a daily channel support so we would advise liquidating 70% of your position here and reducing risk to breakeven. Leave the remaining 30% in the market to run as there’s still a possibility that price could reach the aforementioned weekly support area!
Levels to watch/live orders:
- Buys: Flat (Stop loss: N/A).
- Sells: 0.76 region [Tentative – confirmation required] (Stop loss: dependent on where one confirms this area).
USD/JPY:
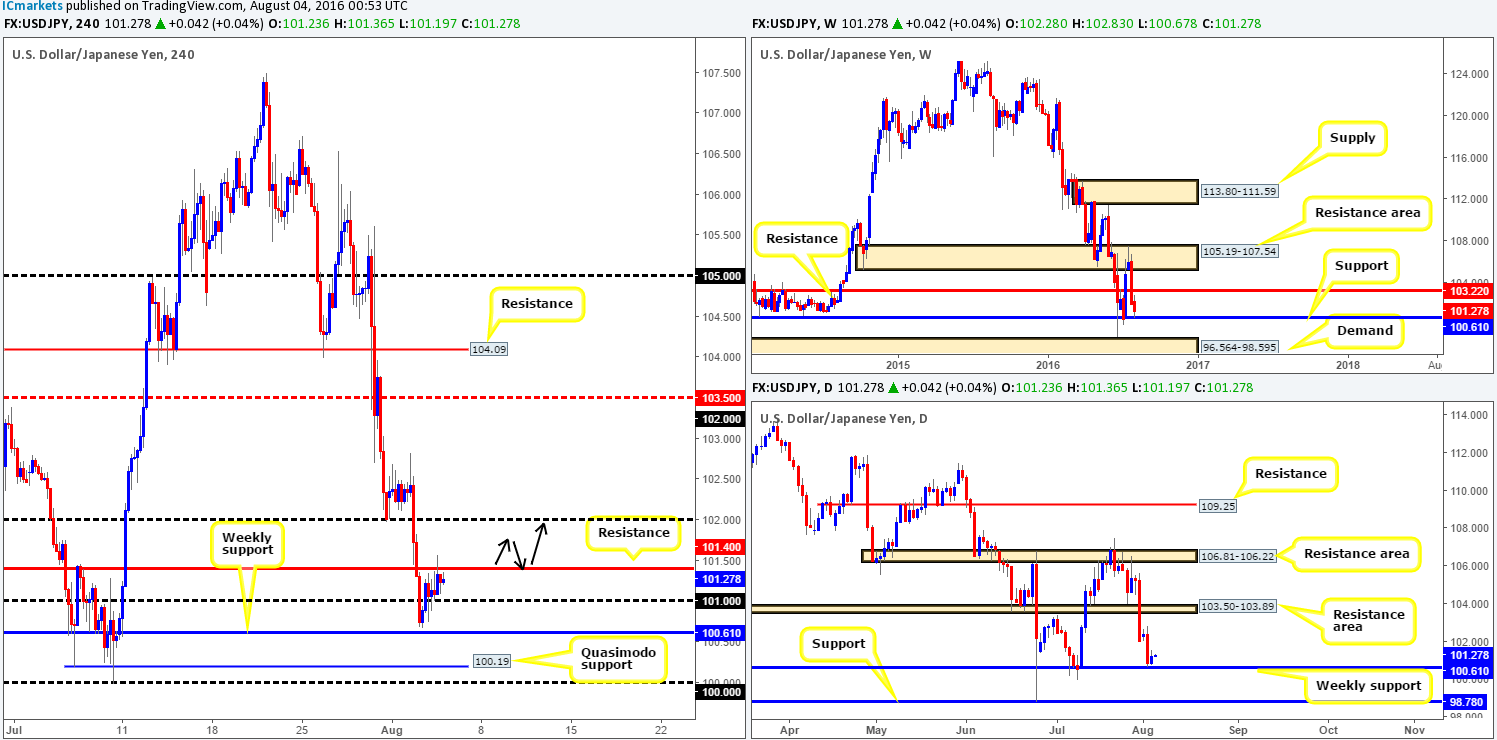
As can be seen from the H4 chart, the USD/JPY extended to highs of 101.56 going into the US session yesterday, consequently tapping into offers around a H4 resistance line at 101.40. The response from this level has so far been soft, with little follow-through selling being seen. This – coupled with the fact that price recently bounced a few pips ahead of a major weekly support line at 100.61 suggests that the 101.40 line is likely going to be consumed today!
.Our suggestions: With the above in mind, we feel the best course of action to take today is to wait for a H4 close above 101.40 and look to take advantage of any retest seen at this level (see black arrows). Due to price recently bouncing off of a major weekly support boundary, entering on a successful retest is, at least in our book, sufficient enough to take a trade, targeting 102 as an initial take-profit target.
Levels to watch/live orders:
- Buys: Watch for price to close above the H4 resistance line at 101.40 and look to trade any retest seen thereafter.
- Sells: Flat (Stop loss: N/A).
USD/CAD:
For those who read our previous report on the USD/CAD you may recall us mentioning to watch for a H4 close below the 1.31 handle followed by a retest to enter short. As you can see, this played out nicely and is now within striking distance of connecting with the H4 trendline support extended from the low 1.2677. This line along with the key figure 1.30 is where our team would be looking to be liquidating some of our position. Well done to any of our readers who managed to pin down a position here!
From a higher-timeframe perspective, there’s a good chance price may extend beyond the 1.30 line. Weekly price remains clinging to a weekly supply zone at 1.3295-1.3017 with space seen to move down to a weekly trendline support extended from the high 1.1278, which coincides with a weekly 38.2% Fib support at 1.2661 (taken from the low 0.9406). In addition to this, the unit also shows room to move lower on the daily chart down to a cluster area of daily trendline supports taken from the following lows: 1.2460 and 1.2839.
Our suggestions: If, like us, you missed the sell from 1.31 yesterday, you may want to focus your sights on the 1.30 area. A close below here followed by a convincing retest would be enough to condone a short trade, targeting the aforementioned daily trendlines.

Levels to watch/live orders:
- Buys: Flat (Stop loss: N/A).
- Sells: Watch for price to close below the 1.30 handle and look to trade any retest seen thereafter.


