EUR/USD:
Focus shifted to Eurozone service PMIs and retail sales in early London Wednesday, both reporting better-than-forecast numbers. March’s Eurozone PMI services business activity index rose further above the 50.0 no-change mark, reaching a level of 53.3, from 52.8 in February. The latest reading was the best recorded since last November (Markit). February’s seasonally adjusted volume of retail trade increased by 0.4% in both the euro area (EA19) and EU28, according to estimates from Eurostat, the statistical office of the European Union.
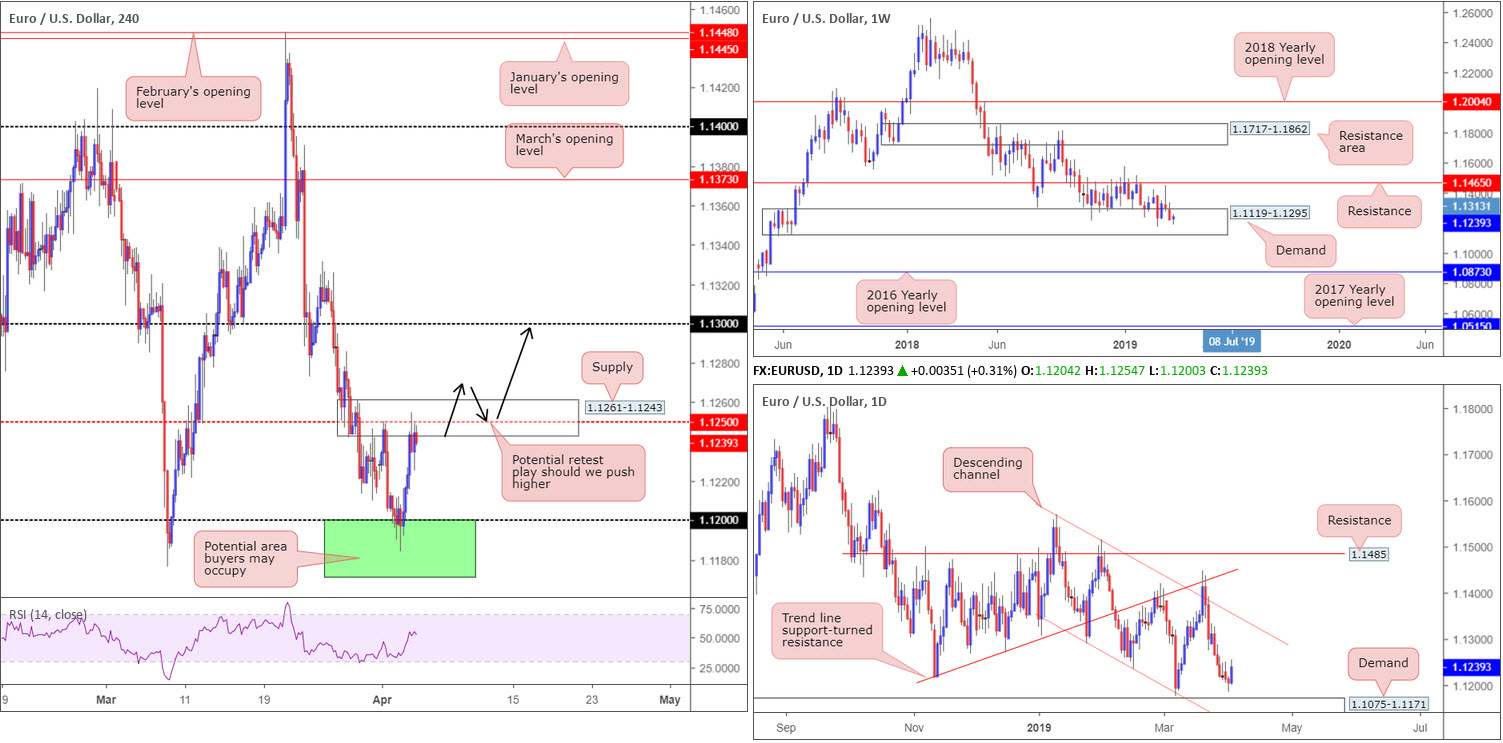
Upbeat Eurozone data, coupled with a waning greenback, lifted the euro out of the 1.1171/1.12 green zone on the H4 timeframe. This was a noted area of interest in Wednesday’s briefing due to its connection with neighbouring structure: sited within the walls of weekly demand at 1.1119-1.1295; positioned less than thirty points above a daily demand zone at 1.1075-1.1171 and located within striking distance of the yearly low at 1.1176. Well done to any of our readers who managed to jump aboard this move.
Going forward, we can see H4 supply at 1.1261-1.1243 is now in motion, along with 1.1250 psychological resistance. Above here, limited resistance is visible until reaching 1.13.
Areas of consideration:
In the event a decisive push beyond the current H4 supply is observed today, a retest play (black arrows) could be something to keep an eye out for, targeting 1.13 as the initial take-profit zone. Be sure to include risk/reward calculations in your trading decision. From entry to the first target, having at least a 1:2 ratio is favourable.
Today’s data points: ECB Monetary Policy Meeting Accounts.
GBP/USD:
At 48.9 in March, down from 51.3 in February, the headline seasonally adjusted IHS Markit/CIPS UK services PMI business activity Index posted below the 50.0 no-change mark for the first time since July 2016. EU President Juncker also said on Wednesday that UK Parliament must approve the Withdrawal Agreement by next Friday (12th April) if it wants another short extension to the Article 50 Brexit process.
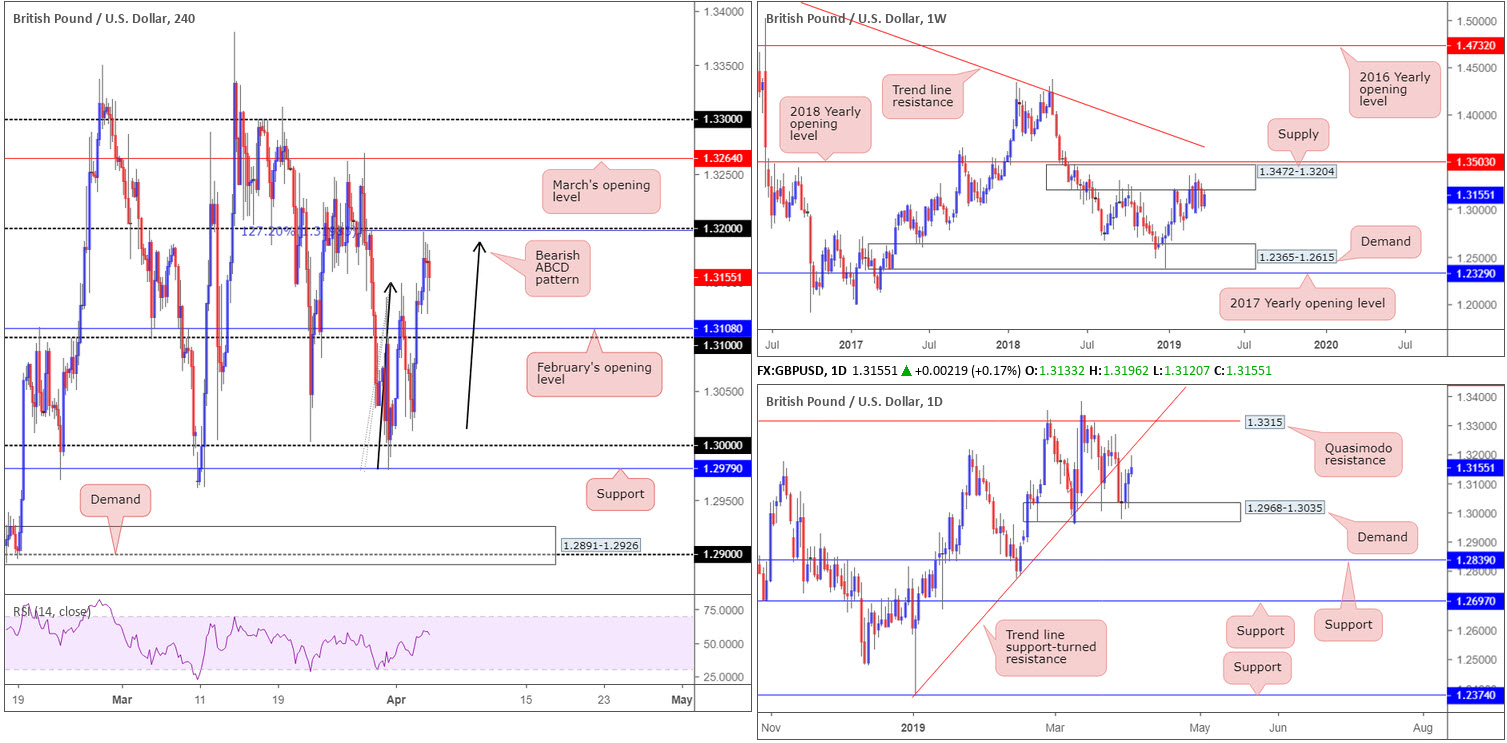
Latest developments witnessed the GBP/USD top just south of 1.32 on the H4 timeframe, which happens to merge with a 127.2% ABCD (black arrows) bearish pattern. The response thus far could trigger another round of selling today and potentially draw the candles towards February’s opening level at 1.3108, followed closely by 1.31.
The story on the weekly timeframe shows the unit trading from supply drawn from 1.3472-1.3204. Since the end of February this has been home to many traders as price flips between gains/losses. The next obvious downside target from here falls in around demand at 1.2365-1.2615. Daily price, on the other hand, has trend line support-turned resistance (extended from the 1.2373) in sight.
Areas of consideration:
Further downside from 1.32 is likely today, not only because of the psychological resistance and converging ABCD pattern, but also due to where we’re coming from on the weekly timeframe: supply mentioned above at 1.3472-1.3204.
A retest at 1.32 in the shape of a handsome H4 bearish candlestick pattern (entry/risk levels can be determined according to this structure) serves as an ideal trigger for seller intent.
Today’s data points: Limited.
AUD/USD:
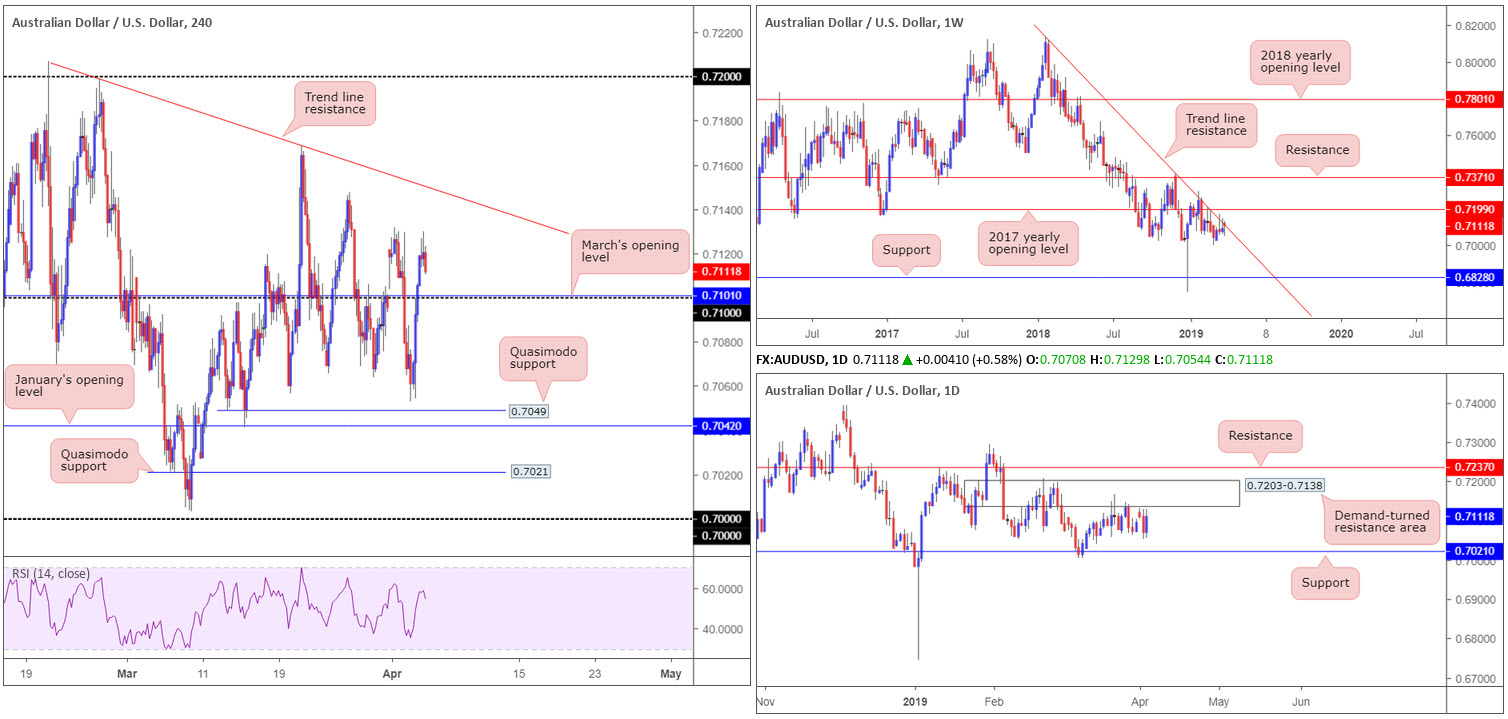
The Australian dollar dipped its toe back into positive territory Wednesday, reclaiming all of Tuesday’s losses. A combination of upbeat Aussie retail sales and a surplus trade balance, China data continuing to show stabilisation and iron ore prices bounding higher, allowed the H4 candles to reclaim 0.71+ status.
Although the move above 0.71 may be viewed as a bullish cue to press higher – potentially towards trend line resistance (taken from the high 0.7206) – the higher timeframes scream resistance at the moment. Longer-term flows reveal weekly action challenging a long-standing trend line resistance (etched from the high 0.8135). The market could eventually observe a selloff take shape from here as downside appears reasonably free until connecting with support coming in at 0.6828. Further adding to this bearish note, the daily timeframe has its candles hovering just south of a demand-turned resistance area positioned at 0.7203-0.7138, with support plotted at 0.7021 as the next downside target.
Areas of consideration:
Entering long from 0.71 is a chancy trade for reasons stated above.
In the event our higher-timeframe reading is accurate and H4 action overthrows 0.71 to the downside again, selling this market (preferably on a retest – entry and risk levels can be determined according to the rejection candle’s structure) towards Quasimodo support at 0.7049 is an option.
Today’s data points: Limited.
USD/JPY:
Of late, trading volume has been somewhat lacklustre, eking out a marginal gain of 0.15% Wednesday.
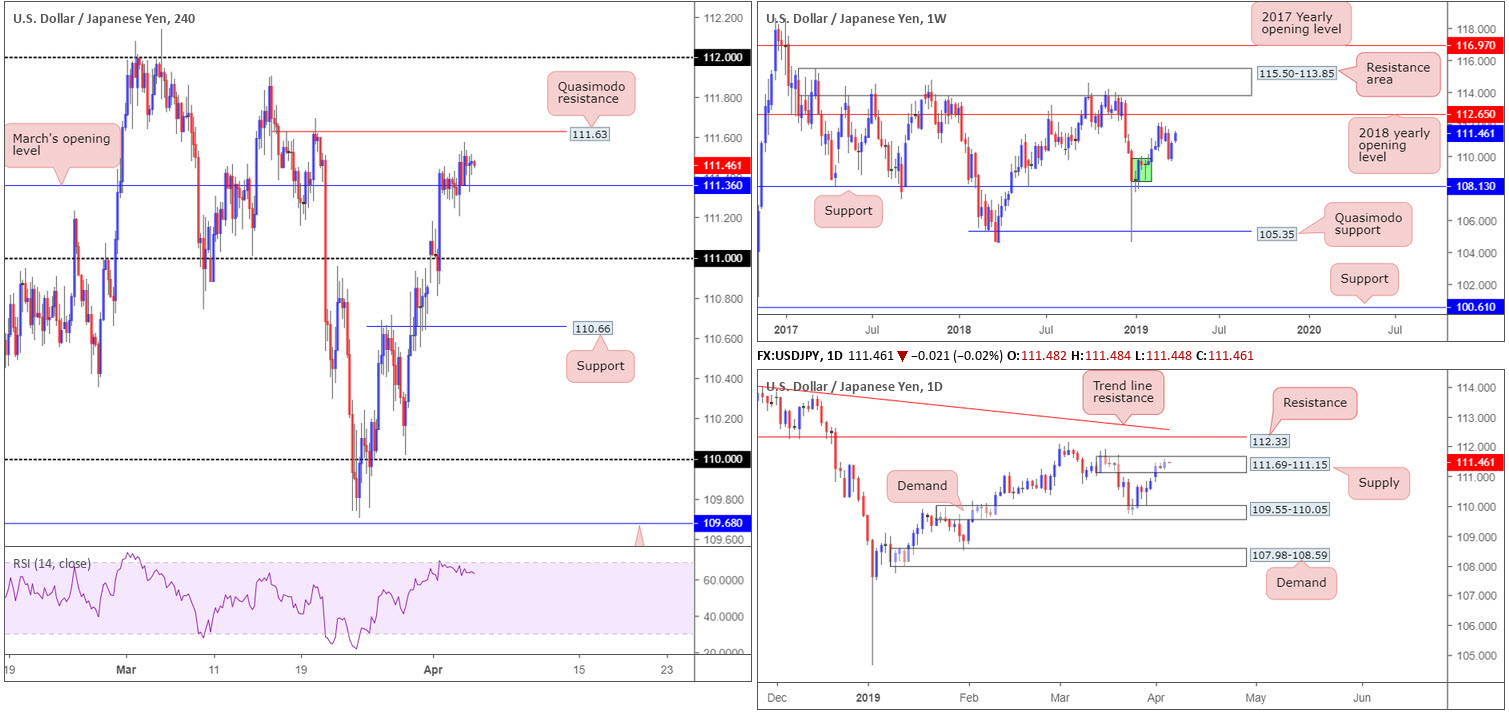
Although the pair is entrenched within a quiet spell, H4 price is establishing a floor of support off March’s opening level at 111.36. Nearby resistance is seen around 111.63: a Quasimodo formation. Beyond here, the 111.90 March 15 high is in view, though the 112 handle is seen as the more prominent resistance. A decisive push back underneath 111.36, nonetheless, may call for a move towards 111.
The Quasimodo resistance mentioned above at 111.63 is of interest today. Daily supply at 111.69-111.15, as you can see, encases the said Quasimodo structure within its upper limits. Further supporting sellers from this point is the H4 RSI indicator grinding lower from overbought territory.
Areas of consideration:
In light of the current H4 Quasimodo resistance being set within daily supply, a sell from here is certainly something to consider. Entry at 111.63 is optimal with a stop-loss order positioned above the upper limit of daily supply at 111.70ish. The first point of concern from here falls in around 111.36. A break beyond here, as highlighted above, likely clears the runway south towards 111.
In the event 111.63 holds and reaches only 111.36, this already offers incredibly attractive risk/reward.
Today’s data points: Limited.
USD/CAD:
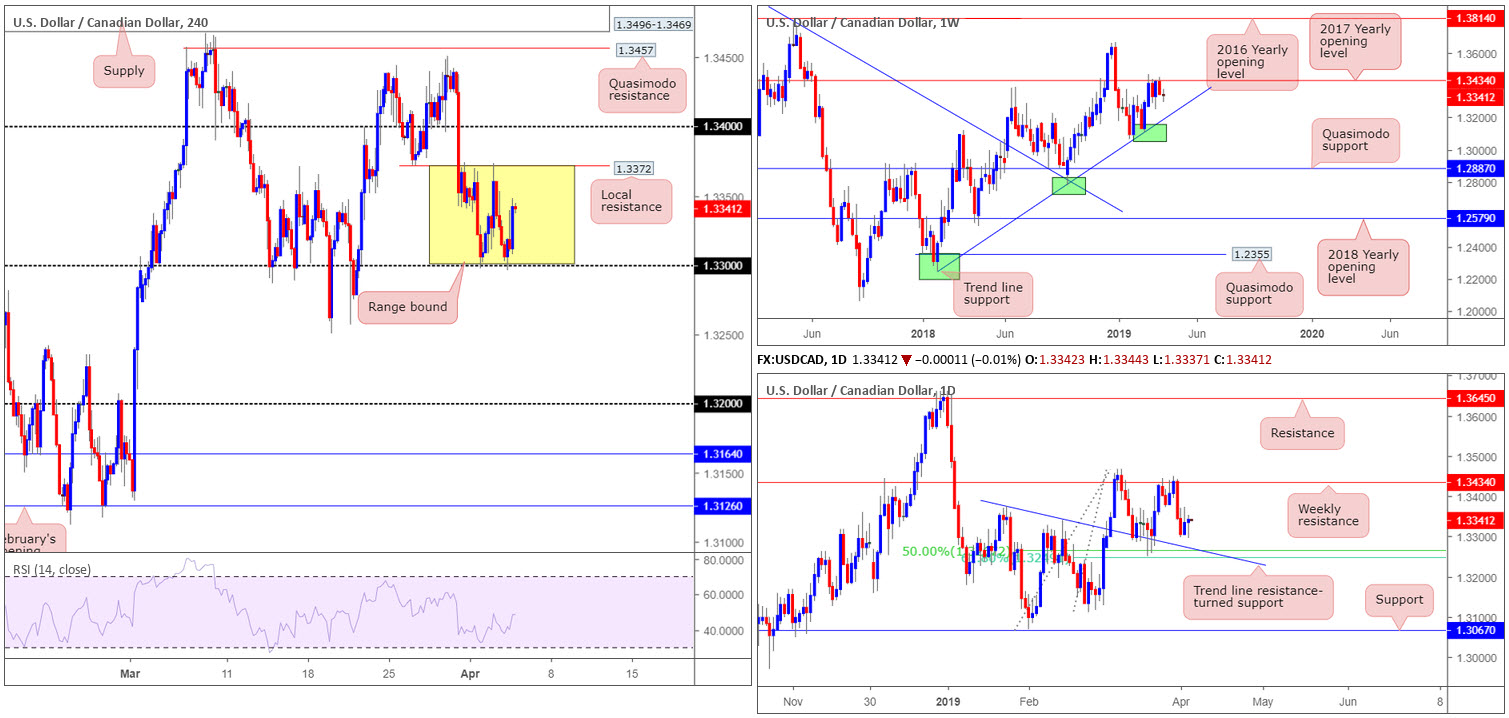
Outlook unchanged due to lacklustre movement.
Since last Friday, despite WTI refreshing 2019 highs, the USD/CAD has been busy chiselling out a medium-term consolidation on the H4 timeframe between the round number 1.33 and local resistance pencilled in at 1.3372. Outside of this border, the 1.3250 March 19 low is in sight, followed by 1.32. To the upside, however, 1.34 can be seen.
On a wider perspective, the pair remains engaged with notable resistance at 1.3434 on the weekly timeframe (the 2017 yearly opening level) following a dominant push higher from trend line support (taken from the low 1.2247). In conjunction with weekly movement, daily flow has room to also generate additional selling, targeting a 50.0% support at 1.3267, which happens to merge closely with a 61.8% Fibonacci support at 1.3248 and a trend line resistance-turned support (extended from the high 1.3375).
Areas of consideration:
With daily candles likely to eventually bring in 1.3260ish and weekly price indicating we may head for levels beyond here, the current range on the H4 timeframe is unlikely to breakout to the upside.
On account of this, the research team notes a H4 close beneath 1.33 is possible, perhaps enough to underline a sell towards the 50.0% support at 1.3267 on the daily timeframe as the initial target, followed closely by 1.3250 on the H4.
While breakout traders may be satisfied entering short at the close of a H4 breakout candle, conservative traders may opt to wait and see if a retest at the underside of 1.33 is seen before pulling the trigger. An ideal scenario would be for the retest to form in the shape of a H4 (or a lower-timeframe pattern if you prefer) bearish candlestick formation, as traders can use this to outline entry/risk levels as well as define seller intent.
Today’s data points: Canadian Ivey PMI.
USD/CHF:
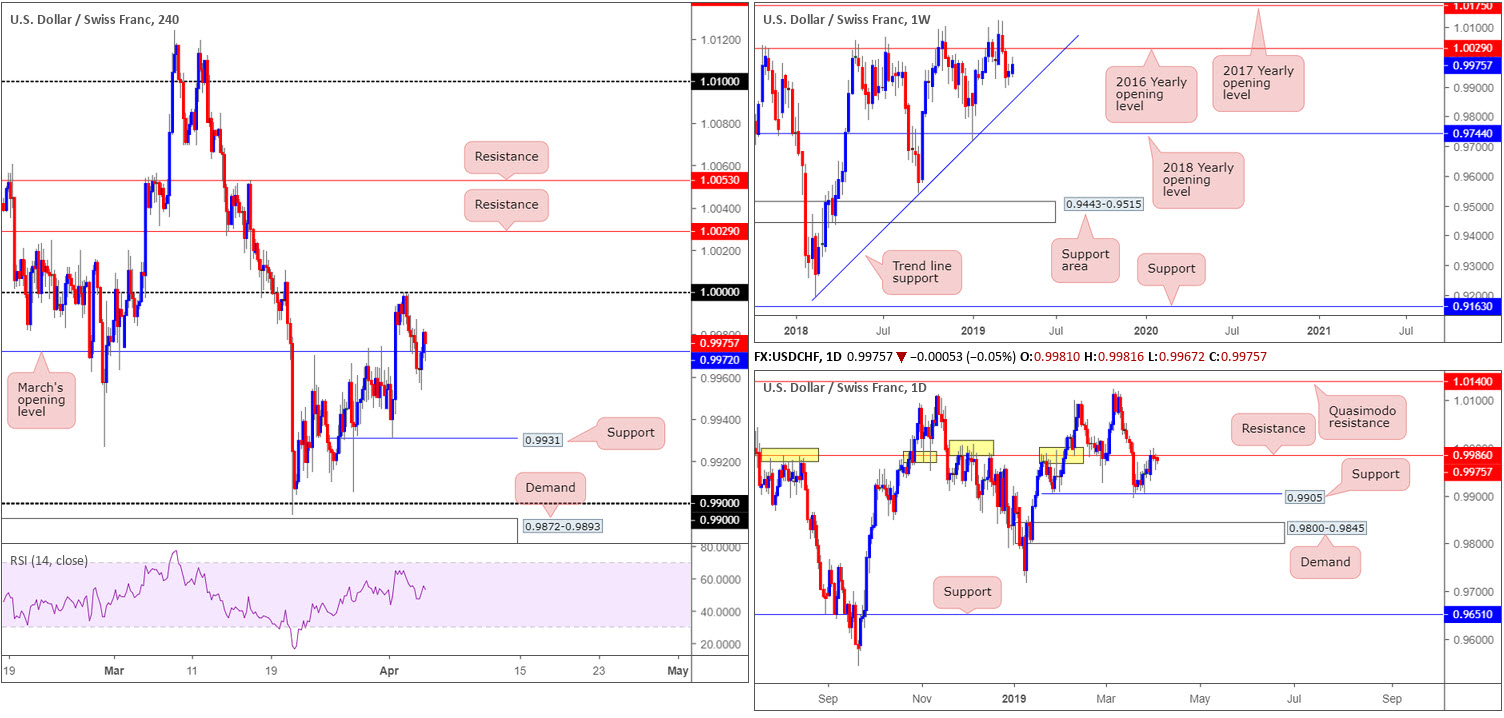
Kicking things off from the top this morning, weekly movement is seen eyeing a possible retest of its 2016 yearly opening level at 1.0029 as resistance, after failing to test nearby trend line support (etched from the low 0.9187).
A closer reading on the daily timeframe reveals the candles recently broke the 0.9926 Feb 28 low, challenged support at 0.9905 and shortly after retested notable resistance plotted at 0.9986 (history dating as far back as November 2017).
Across the chart on the H4 timeframe, March’s opening level at 0.9972 failed to hold as support in early London Wednesday, eventually testing lows of 0.9953 before reclaiming 0.9972 as support into the closing bell. As long as 0.9972 holds as support today, a retest of 1.0000 (parity) is a likely event. 1.0000, coupled with daily resistance plotted nearby at 0.9986, is an area sellers may find interesting today.
Should we push for higher ground, nevertheless, two layers of resistance are visible at 1.0053 and 1.0029. Note the latter represents the 2016 yearly opening level on the weekly timeframe.
Areas of consideration:
Between 1.0000 (parity) and 0.9986, the current daily resistance is, according to our technical studies, a reasonably solid sell zone. As round numbers are prone to fakeouts, though, entering on additional confirmation is a point worth considering – entry and risk levels can then be determined according to your chosen confirmation method. In terms of the next support target, March’s opening level mentioned above at 0.9972 is a potentially troublesome support to keep in mind. Beyond here, H4 support at 0.9931 is also in sight.
Today’s data points: Limited.
Dow Jones Industrial Average:
US equities traded higher Wednesday, resuming a rally after a pause in the previous session, fuelled on the back of optimism over trade talks with Beijing and as China’s economy showed fresh signs of recovery.
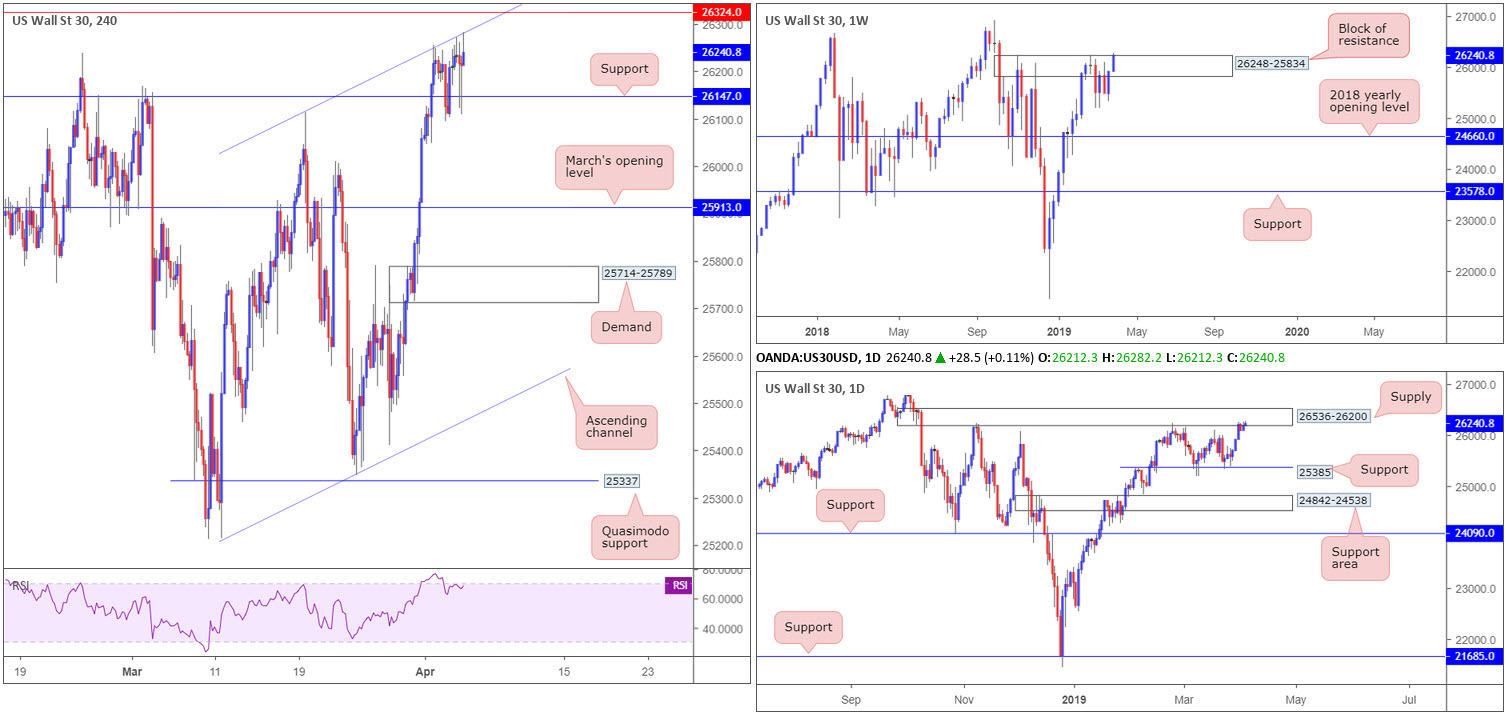
Up 0.38% on the day, the Dow Jones Industrial Average is now chewing on the top edge of a resistance zone on the weekly timeframe at 26248-25834. A clean sweep beyond here could see the index knocking on the door of the all-time high 26939. A closer reading of price action on the daily timeframe directs the spotlight towards supply pencilled in at 26536-26200. Note this area has capped upside on a number of occasions as it is glued to the top edge of the weekly resistance mentioned above at 26248-25834.
H4 flows, as of current price, is seen shaking hands with channel resistance (drawn from the high 26114), following the index guarding nearby support at 26147. Overhead, traders’ crosshairs are likely fixed on resistance at 26324. It might also be worth pencilling in the RSI indicator is currently displaying divergence out of overbought territory.
Areas of consideration:
Traders looking to sell this market based on H4 price testing channel resistance and daily action crossing swords with supply at 26536-26200 are likely caught between a rock and a hard place at the moment. Should a sell enter the market at current price, not only are you placing the order against potential H4 buying from support at 26147, you’re also likely selling into weekly breakout buyers above the resistance area at 26248-25834.
Potential sellers in this market are, on account of the above, best off waiting and seeing if the H4 candles close beneath support mentioned above at 26147. Not only does this likely clear the way south towards March’s opening level at 25913, it also helps confirm seller intent from daily supply and potentially indicates the break of weekly resistance may in fact be a fakeout to press lower rather than a continuation signal.
Today’s data points: Limited.
XAU/USD (GOLD):
Outlook unchanged due to lacklustre movement.
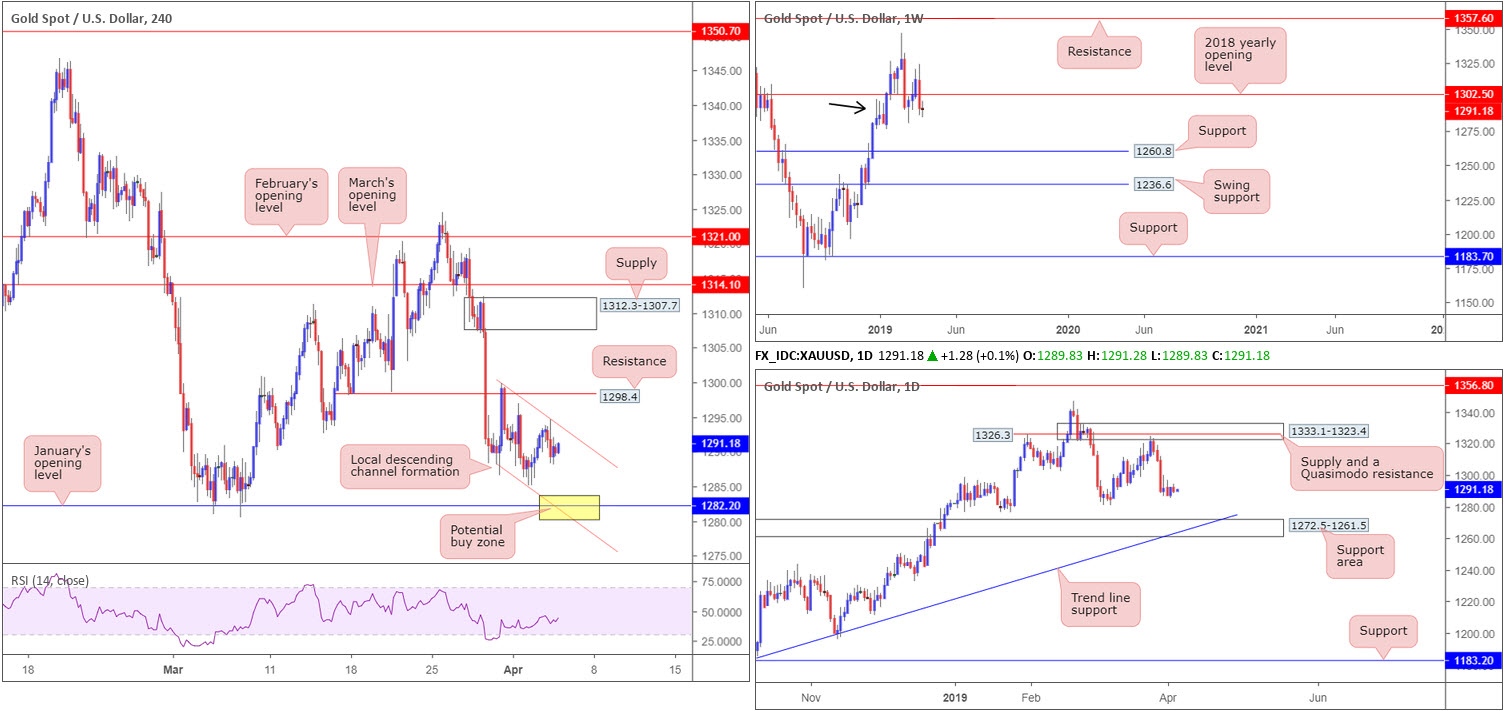
Since the beginning of the week the H4 candles have been grinding lower, compressed within a local descending channel pattern (high 1299.8). Outside of this formation, eyes are likely on resistance coming in at 1298.4 and January’s opening level at 1282.2. The next area of interest beyond 1298.4 falls in around supply at 1312.3-1307.7, which, as you can see, boasts strong downside momentum from its base.
The broader picture remains unchanged. Weekly price recently snapped back beneath its 2018 yearly opening level at 1302.5, by way of a strong bearish engulfing candle. Although viewed by some as a bearish cue to potentially push lower, it is worth pencilling in demand (black arrow) at 1276.9-1295.8. A break south of this area has support at 1260.8 to target.
Immediate support on the daily timeframe to be aware of is the 1281.0 March 7 low, followed by a support area coming in at 1272.5-1261.5 and merging trend line support (taken from the low 1160.3).
Areas of consideration:
As the yellow metal recently re-entered the jaws of weekly demand at 1276.9-1295.8, albeit on the back of strong selling, a bounce from January’s opening level on the H4 timeframe at 1282.2 is a possibility today. Along with its merging channel support on the H4 timeframe, the level houses additional confluence in the form of the 1281.0 March 7 low (daily timeframe). An added bonus would be H4 price chalking up bullish a candlestick signal off 1281.0/1282.2, consequently identifying buyer intent and also serving as a base to determine entry and risk levels.
The accuracy, completeness and timeliness of the information contained on this site cannot be guaranteed. IC Markets does not warranty, guarantee or make any representations, or assume any liability with regard to financial results based on the use of the information in the site.
News, views, opinions, recommendations and other information obtained from sources outside of www.icmarkets.com.au, used in this site are believed to be reliable, but we cannot guarantee their accuracy or completeness. All such information is subject to change at any time without notice. IC Markets assumes no responsibility for the content of any linked site. The fact that such links may exist does not indicate approval or endorsement of any material contained on any linked site.
IC Markets is not liable for any harm caused by the transmission, through accessing the services or information on this site, of a computer virus, or other computer code or programming device that might be used to access, delete, damage, disable, disrupt or otherwise impede in any manner, the operation of the site or of any user’s software, hardware, data or property.


