
A note on lower timeframe confirming price action…
Waiting for lower timeframe confirmation is our main tool to confirm strength within higher timeframe zones, andhas really been the key to our trading success. It takes a little time to understand the subtle nuances, however, as each trade is never the same, but once you master the rhythm so to speak, you will be saved from countless unnecessary losing trades. The following is a list of what we look for:
- A break/retest of supply or demand dependent on which way you’re trading.
- A trendline break/retest.
- Buying/selling tails – essentially we look for a cluster of very obvious spikes off of lower timeframe support and resistance levels within the higher timeframe zone.
- Candlestick patterns. We tend to only stick with pin bars and engulfing bars as these have proven to be the most effective.
EUR/USD:
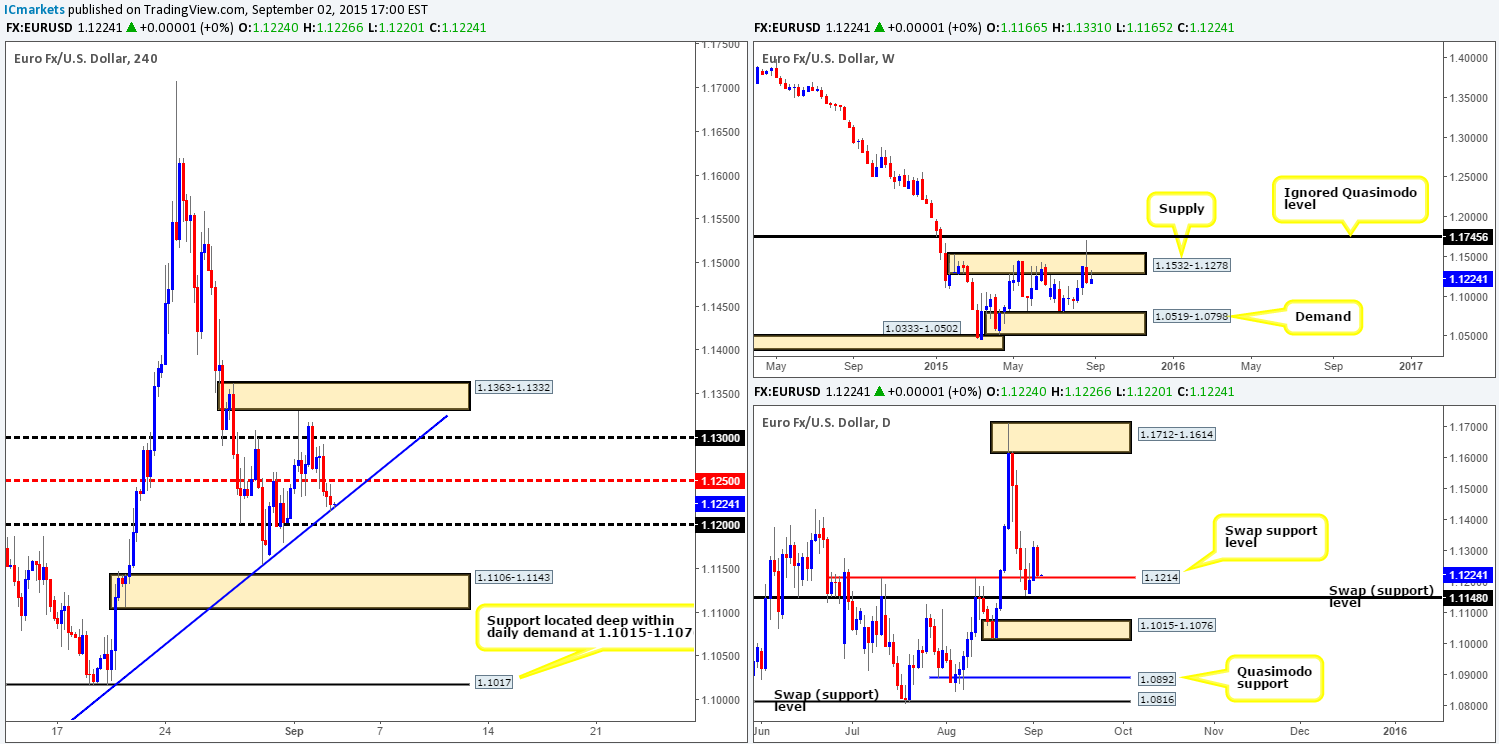
Early into yesterday’s sessions, price found support from the mid-level number 1.1250. This, as you can see though, was short-lived as mid-way through London trade, price aggressively punched through bids sitting at this barrier and ended the day testing a 4hr ascending trendline extended from the low 1.0854.
This pair, as far as we can see is rather a difficult one to trade today. Here’s why:
- The next upside target from the aforementioned 4hr ascending trendline falls in at 1.1250 –about twenty pips all in all!
- Due to the 1.1200 handle sitting just below the 4hr trendline, a fake lower is highly likely.
- With bids seen holding the EUR higher on the daily timeframe around a daily swap (support) level at 1.1214 and offers controlling this pressure from weekly supply at 1.1532-1.1278, there is somewhat of a tug-of-war being seen here with little confirmed direction.
Considering that there is little room for prices to move today on the 4hr chart, as well as the higher timeframes currently bumping heads, our team’s position will remain flat going into today’s sessions.
Levels to watch/live orders:
- Buys:Flat (Stop loss: N/A).
- Sells: Flat (Stop loss: N/A).
GBP/USD:
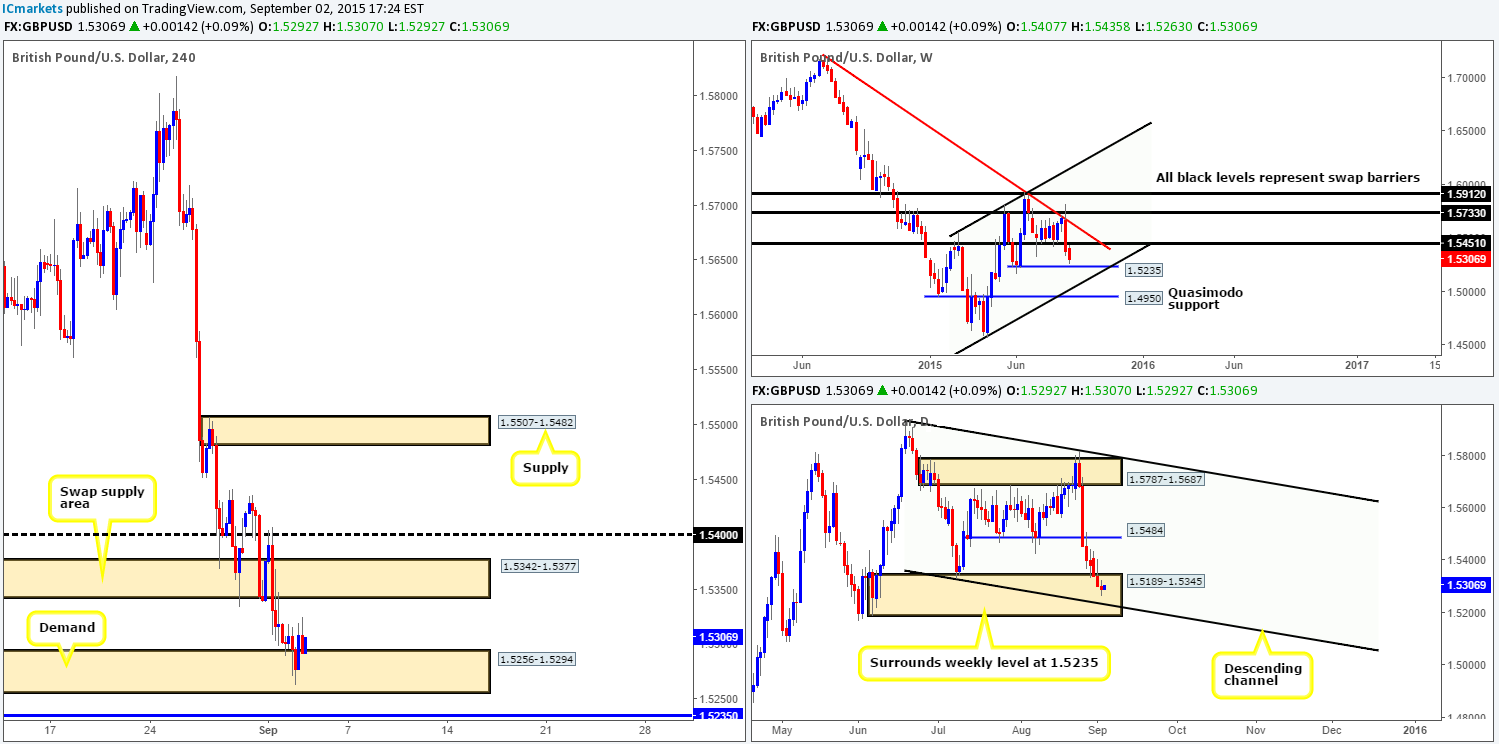
After price shook hands with the 4hr demand area at 1.5256-1.5294 yesterday, a strong ceiling of offers were hit around the 1.5320 mark. In the event that price fails to overcome this 4hr intraday resistance level today, it is likely we’ll see the GBP drive lower.
This, at least to us, is a relatively good thing as twenty pips below the aforementioned 4hr demand base lurks a weekly swap (support) level at 1.5235. In addition, we can also see that this weekly level converges beautifully with not only a daily descending channel support (1.1329), but also with a large daily demand zone at 1.5189-1.5345. So, all in all, we believe this to be a fantastic buy zone within this market.We have set an alert at 1.5245, which, if triggered, we’ll begin watching price action very closely for a confirmed long trade.
If, however, price manages to overcome offers at 1.5320 today, then in all honesty, we’d be happy to stay out of the market since there is only twenty pips room to the next upside 4hr target – 1.5342-1.5377.
Levels to watch/ live orders:
- Buys: 1.5235 region [Tentative – confirmation required] (Stop loss: dependent on where on confirms this area).
- Sells: Flat (Stop loss: N/A).
AUD/USD:
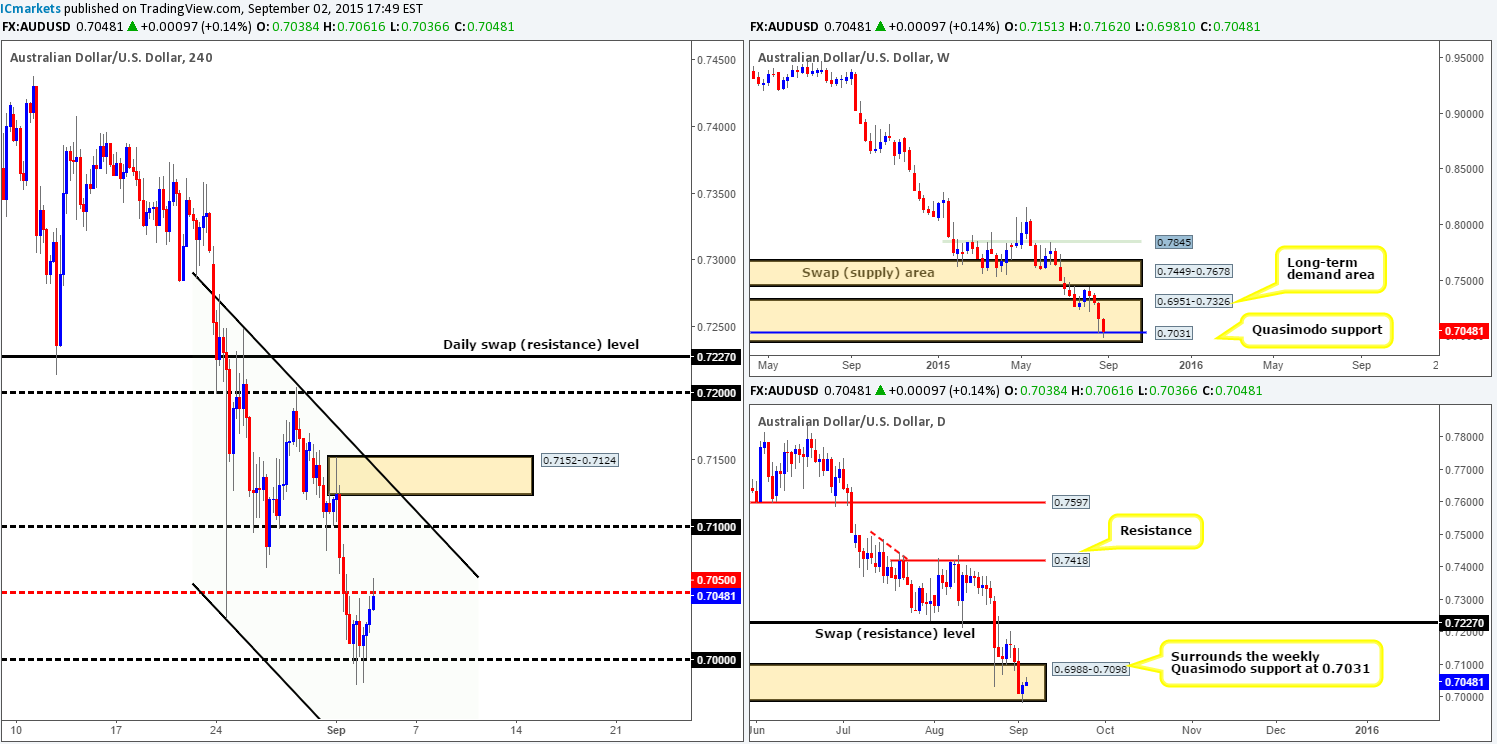
During the course of yesterday’s sessions, an impressive array of buying tails formed around the large psychological barrier 0.7000. Despite this, it was only once we entered into U.S. trade did we see price rally up towards the mid-level number 0.7050.
With price now tagging in offers around the 0.7050 mark, where do we go from here? Well, the weekly action still remains trading around a weekly Quasimodo support at 0.7031, which is located deep within weekly demand drawn from 0.6951-0.7326. Meanwhile, the daily chart shows price recently faked below daily demand at 0.6988-0.7098, and printed a small bullish candle. However, when comparing this candle to that of Tuesdays it is clear to see that the bulls still have a long way to go before being considered worthy opponents.
With everything taken into consideration, our team has decided to primarily focus on 0.7050 today. If this hurdle is taken out, this could suggest further upside towards 0.7100. Should 0.7050 be retested as support following a break, then we’d buy this market if corresponding lower timeframe confirmation is seen. Conversely, in the event that 0.7050 holds as resistance, and subsequently paints lower timeframe selling strength, we’d short this market, targeting 0.7000.
Levels to watch/ live orders:
- Buys: Watch for offers around 0.7050 to be consumed and then look to trade any retest seen at this level (confirmation required).
- Sells: 0.7050 [Tentative – confirmation required] (Stop loss: dependent on where one confirms this level).
USD/JPY:
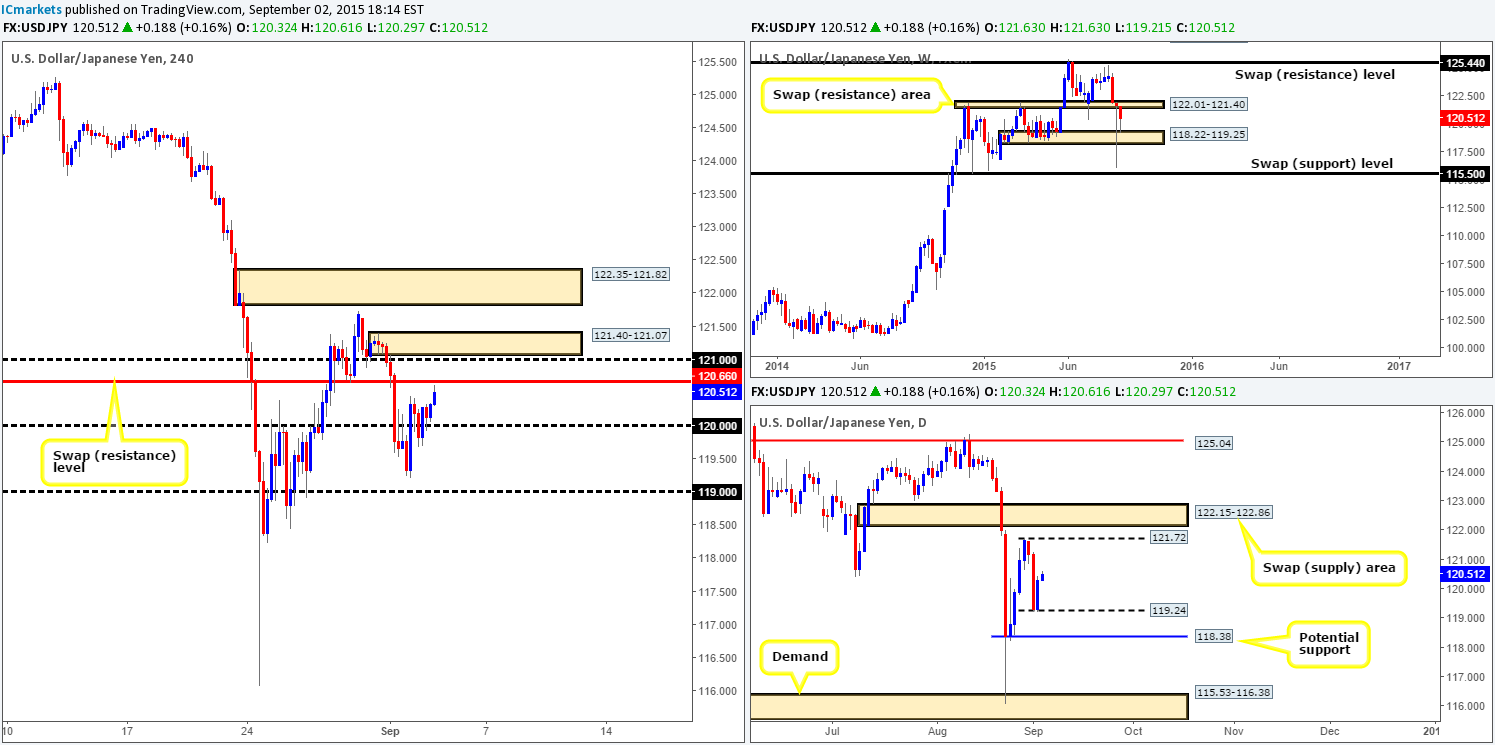
Following Tuesday’s last-minute push above 120.00, price retested this hurdle as support going into the early hours of trade yesterday. This, as we can see from the 4hr chart, eventually sent the USD/JPY up to the lower limits of a 4hr swap (resistance) level at 120.66, which is currently holding firm.
Given that both the weekly and daily timeframes show support in the market (weekly: 118.22-119.25 daily: 119.24), we’re not keen on shorting the current 4hr resistance barrier. With that being said though, even with a break above this number there is very little room for prices to move. Forty pips above here we have 120.00, followed closely by a 4hr supply zone coming in at 121.40-121.07.
Due to the somewhat cramped conditions seen on the 4hr timeframe, we’ve decided to place this pair on the back burner for the time being and remain flat.
Levels to watch/ live orders:
- Buys: Flat (Stop loss: N/A).
- Sells:Flat (Stop loss: N/A).
USD/CAD:
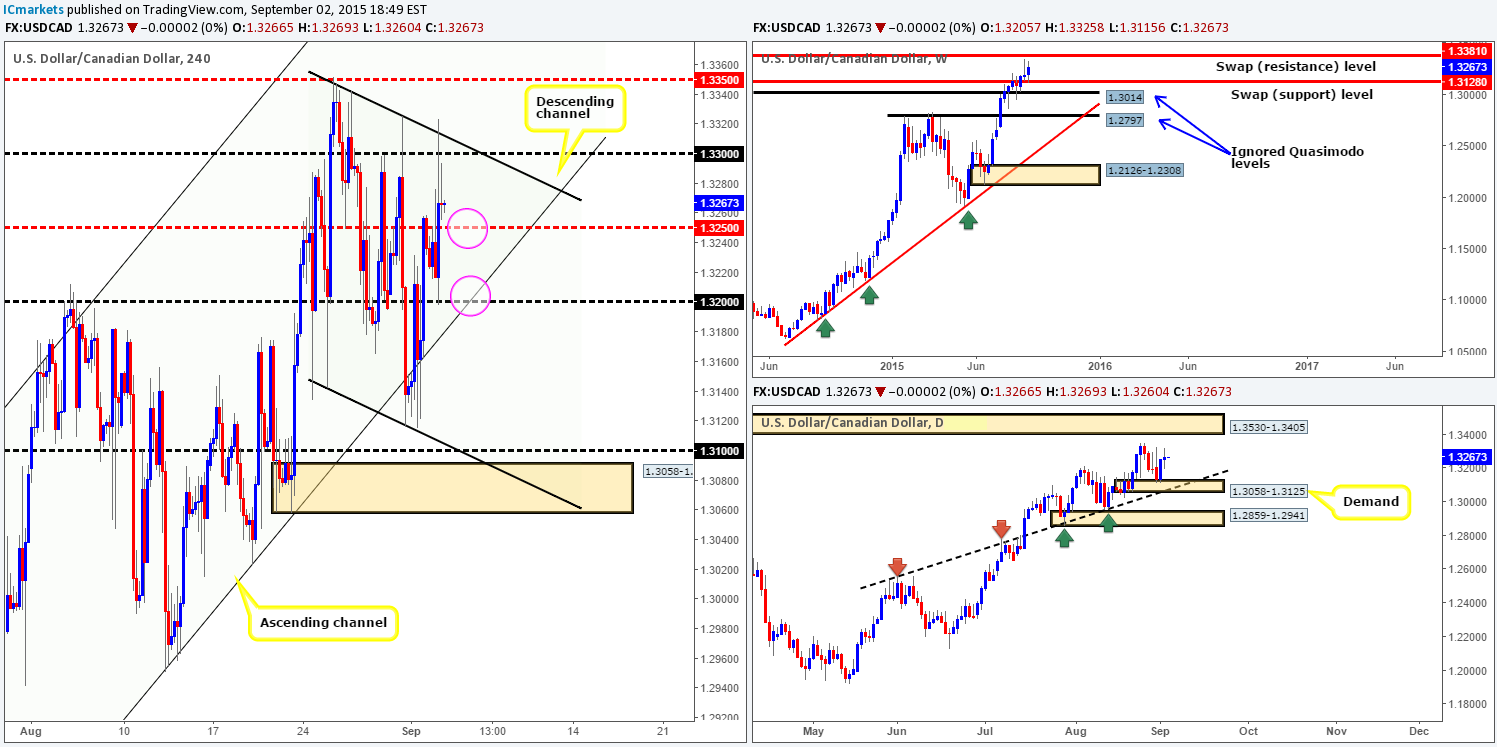
This morning’s analysis will kick-off with a look at the weekly timeframe. Current trade points out that price is holding firm above the weekly swap (support) level at 1.3128. The next upside target to keep an eye from here falls in at 1.3381 – a weekly swap (resistance) level. Scrolling down to the daily timeframe, however, reveals that following the rebound from daily demand at 1.3058-1.3125, price painted a clear indecision candle during yesterday’s session. Should the bulls manage to take back control here, price will likely rally up to daily supply coming in at 1.3530-1.3405, which is positioned just above the aforementioned weekly swap (resistance) level.
Turning our attention to the 4hr timeframe, we can see that the USD/CAD rallied heavily from 1.3200 going into U.S. trade yesterday. Consequent to this, price took out 1.3250 and ended with the market crossing swords with not only 1.3300, but also Monday’s high 1.3325 and the upside limit of a recently formed 4hr descending channel (1.3352).
With the higher timeframes clearly suggesting there is room to continue advancing (see above), we favor longs over shorts for the time being. With that, we’re going to closely monitor 1.3250 and also 1.3200 (converges with the lower limit of 4hr ascending channel [1.2536]) during today’s sessions for confirmed buy trades.
Levels to watch/ live orders:
- Buys:1.3250/1.3200[Tentative – confirmation required] (Stop loss: dependent on where one confirms this level).
- Sells: Flat (Stop loss: N/A).
USD/CHF:
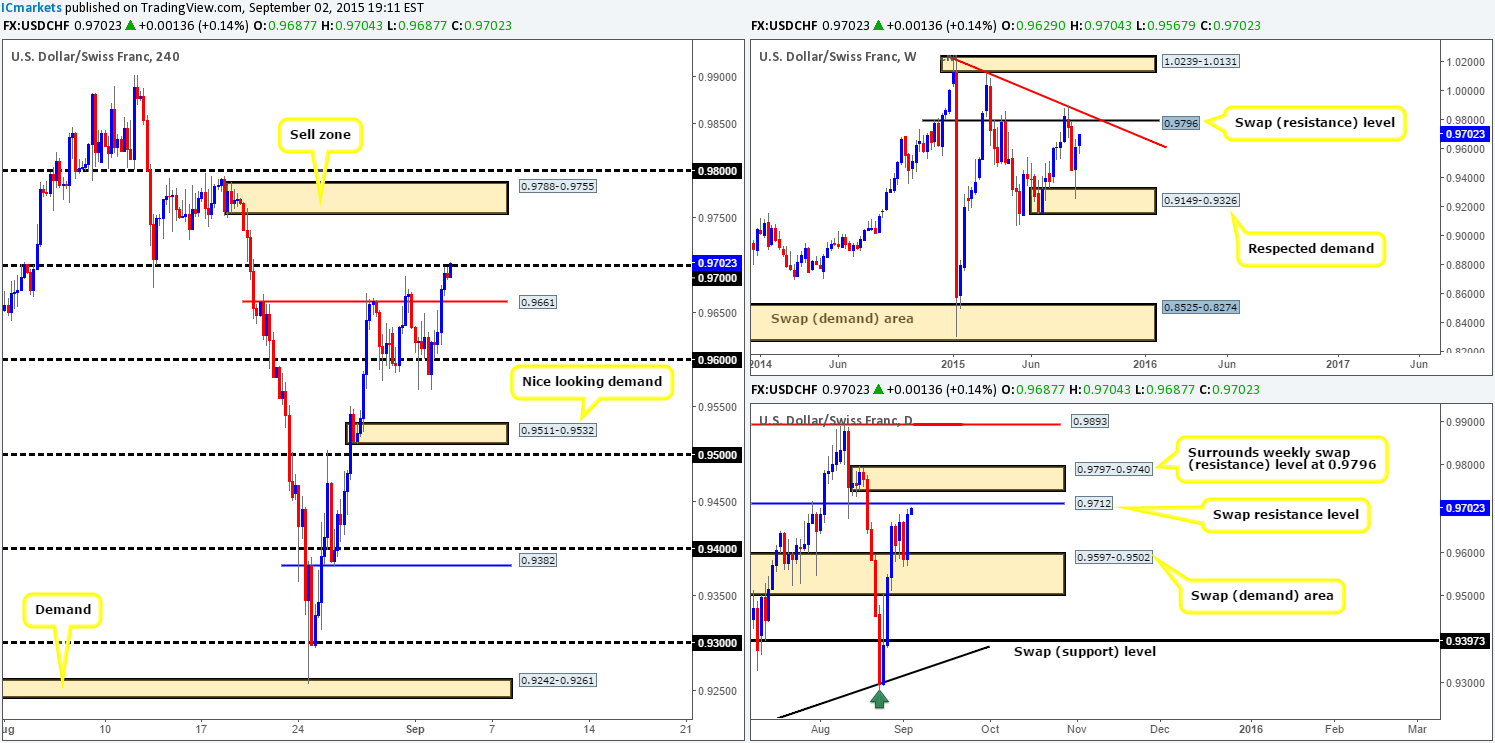
For those read our previous report: http://www.icmarkets.com/blog/wednesday-2nd-september-daily-technical-outlook-and-review/ you may recall us mentioning to watch for 0.9600 to be consumed. In addition to this, we also suggested that if 0.9600 was indeed taken out, then there may be a buy trade on the retest of this number, targeting 0.9661. As you can see, the above did in fact come to fruition. Well done to any of our readers who managed to lock in some green pips from this move.
As we write, price is nibbling at offers around the psychological number 0.9700. At first glance, shorting from here seemed legit considering this level merged so nicely with a daily swap (resistance) barrier at 0.9712. However, upon closer inspection, the combined 4hr supply/round number area just above it at 0.9788-0.9755/0.9800 looks to be the more promising zones of the two. The reason for why is due to it being positioned around a weekly swap (resistance) level at 0.9796, and also located deep within daily supply at 0.9797-0.9740.
The logic behind including the round number 0.9800 in the equation is simply because if price hits the aforementioned 4hr supply,there is a good chance price will fake above it to take out stops to 0.9800.
So, to sum up, we have little interest in shorting 0.9700 today. Instead, we’re looking for price to break above this hurdle and head towards 4hr supply, where at which point our team will begin hunting for lower timeframe short entries into this market.
Levels to watch/ live orders:
- Buys:Flat (Stop loss: N/A).
- Sells:0.9800/0.9755 region [Tentative – confirmation required] (Stop loss: dependent on where one confirms this area).
DOW 30:
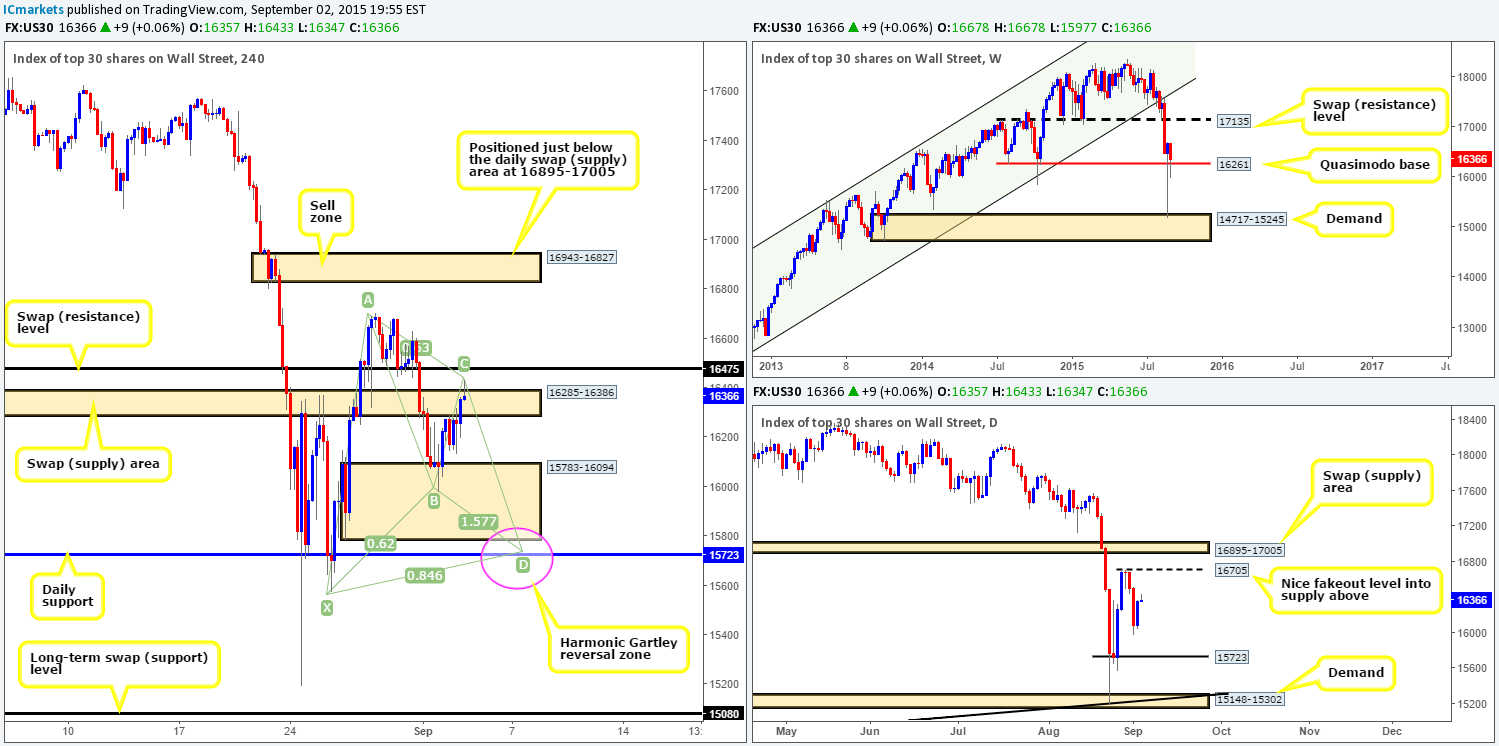
Recent action on the DOW index shows that price did in fact rally from the rather large 4hr demand base at 15783-16094 amid yesterday’s sessions. This, as is evident from the 4hr chart, saw price hit and slightly extend above a 4hr swap (supply) area at 16285-16386. In the event that the sellers can hold this market below here today, we may see a push lower possibly completing the D-leg of a Harmonic Gartley pattern that terminates around a daily swap (support) level at 15723. In the event that price manages to reach this zone, we’d be very interested in looking to buy this market from here.
However, if price continues to show support above the weekly Quasimodo support barrier at 16261, this market will likely struggle to decline as far as 15723.With that being said, if price continues to rally today and breaks above the 4hr swap (resistance) level at 16475, this could set the stage for a continuation move north up to 4hr supply at 16943-16827. For us to be permitted to buy into this move, price would need to retest 16475 as support and show some form of lower timeframe buying strength.
It will be interesting to see how this day pans out!
Levels to watch/ live orders:
- Buys:15723 region [Tentative – confirmation required] (Stop loss: depends on where one confirms this area) Watch for offers around 16475 to be consumed and then look to trade any retest seen at this level (confirmation required).
- Sells: Flat (Stop loss: N/A).
XAU/USD: (Gold)
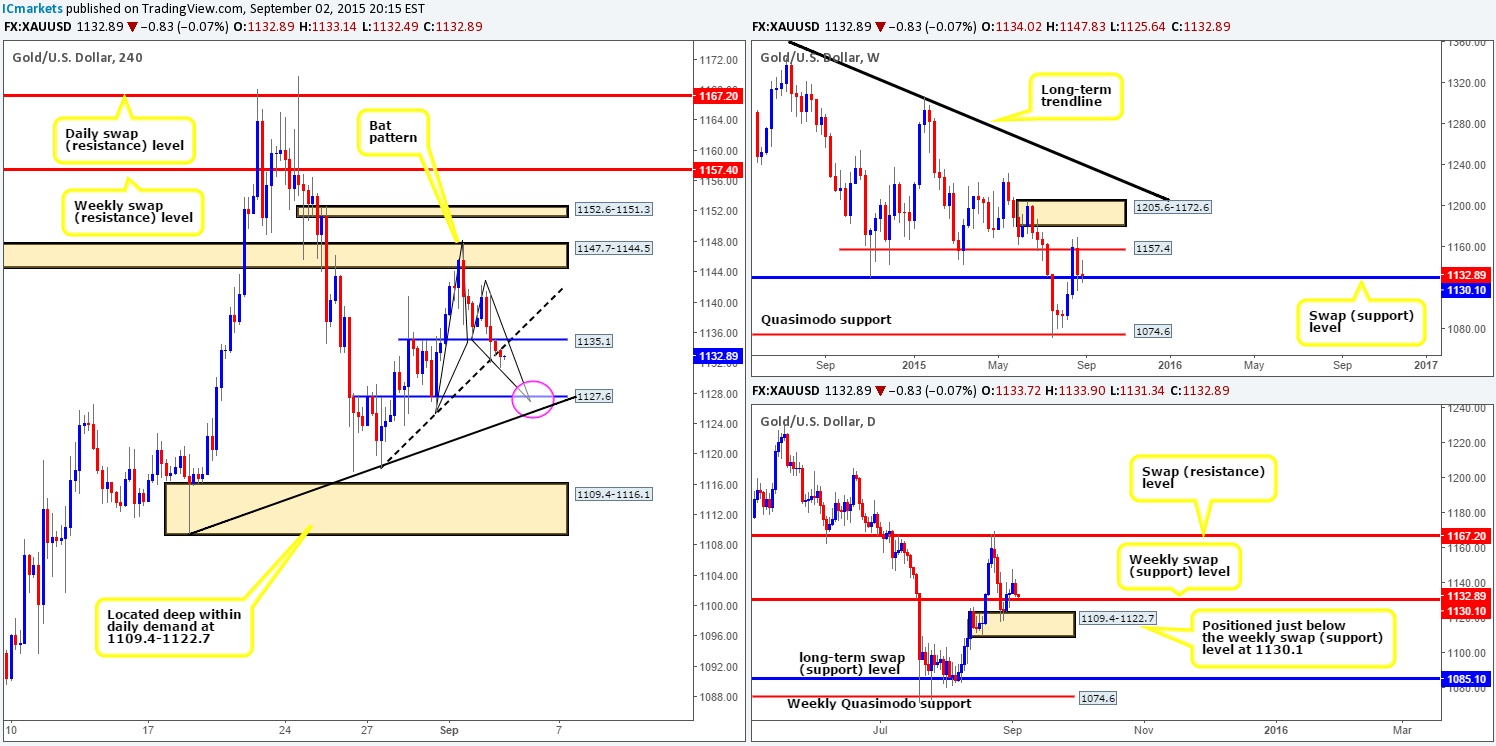
Despite the bounce seen from just above the 4hr swap (support) level at 1135.1 early on during trade yesterday, Gold tumbled lower going into the London session. Price eventually took out 1135.1 and retested it as resistance, which then saw this markethead lower to consume buyers around the 4hr ascending trendline taken from the low 1118.1.
Now, for those of you who trade Harmonics, there is a potential 4hr Bat pattern setting up on the chart as we write. This 4hr Harmonic supportcompletes nicely around a 4hr swap (support) level at 1127.6, which also converges with a 4hr ascending trendline extended from the low 1109.4.
Not only does the path south appear ‘support free’ on the 4hr scale to hit this Harmonic support today, additional supportive pressure is seen from the weekly swap (support) level at 1130.1. Therefore, in our opinion, there is a very good chance of a bounce from here.
Given the above, our objective for today is simple. Watch for price to hit the 1127.6 region and trade this beauty long. Considering the all-round confluence seen at this 4hr Harmonic completion point, we have set a pending buy order at 1128.21, with a stop placed just below at 1123.20.
Levels to watch/ live orders:
- Buys: 1128.21 (Stop loss: 1123.20).
- Sells: Flat (Stop loss: N/A).


