A note on lower timeframe confirming price action…
Waiting for lower timeframe confirmation is our main tool to confirm strength within higher timeframe zones, and has really been the key to our trading success. It takes a little time to understand the subtle nuances, however, as each trade is never the same, but once you master the rhythm so to speak, you will be saved from countless unnecessary losing trades. The following is a list of what we look for:
- A break/retest of supply or demand dependent on which way you’re trading.
- A trendline break/retest.
- Buying/selling tails – essentially we look for a cluster of very obvious spikes off of lower timeframe support and resistance levels within the higher timeframe zone.
- Candlestick patterns. We tend to only stick with pin bars and engulfing bars as these have proven to be the most effective.
EUR/USD:
During the course of yesterday’s sessions the EUR aggressively pierced offers sitting around 1.1300. This not only formed a nice looking 4hr bearish pin, but also forced price south to retest the mid-level hurdle 1.1250 as support. From here, two back-to-back 4hr bullish pins formed, which, as you can see, propelled this market north consequently closing above 1.1300. Now for the interesting part! The aggressive spike north seen during the early hours of yesterday’s trade likely cleared offers out from not only at 1.1300, but also around 4hr supply at 1.1363-1.1320 (green arrows) too, thus clearing the path north towards at least 1.1350.
Therefore, if the buyers manage to hold price above 1.1300 today, there could be a possible long should price retest this number. However, before we go hitting the buy button, let’s check out what vibe we’re getting from the higher timeframe picture… Weekly action still remains trading beneath weekly supply at 1.1532-1.1278. Meanwhile, down on the daily chart, offers have recently been taken out around the daily swap (resistance) level at 1.1214, thereupon likely paving the way north up to daily supply coming in at 1.1712-1.1614.
Given the points made above, our team has come to a general consensus that entering long from 1.1300 is a viable trade opportunity today. Be that as it may, once/if price connects with 1.1300; we would still require lower timeframe buying confirmation before risking capital, since from experience we have come to expect a fakeout when dealing with psychological numbers such as these.

Levels to watch/live orders:
- Buys: 1.1300 [Tentative – confirmation required] (Stop loss: dependent on where one confirms this level).
- Sells: Flat (Stop loss: N/A).
GBP/USD:
For those who follow our analysis on a regular basis http://www.icmarkets.com/blog/tuesday-1st-september-daily-technical-outlook-and-review/ you may recall that we mentioned to keep an eye on a possible break/retest trade below (at the time) 4hr demand at 1.5342-1.5377. As can be seen from the chart, this did eventually take place going into the London open. Well done to any of our readers who managed to successfully short this area.
Going forward, we can see that price is now currently hovering above 4hr demand coming in at 1.5256-1.5294. The question most traders will now likely be asking themselves is: would this area be stable enough to consider a buy from?
Well, the view from the weekly scale shows there is room for this pair to continue declining down to weekly support at 1.5235. Whereas, the daily scale reveals that the buyers and sellers are currently battling for position within daily demand coming in at 1.5189-1.5345. To that end, we believe that this 4hr demand area is a ‘possible’ buy zone today. The reason why we say ‘possible’ simply comes down to the weekly support level lurking only twenty or so pips below this 4hr area, thus possibly encouraging a fake lower!
The best, and in our opinion, most logical approach to tackling this 4hr demand zone today might be to wait for the lower timeframes (30/60 minute) to confirm bullish strength exists here before jumping in. Should the fakeout down to the weekly level be seen, and price snaps back inside of the 4hr demand area, then this in itself, at least to us, is a valid long signal.
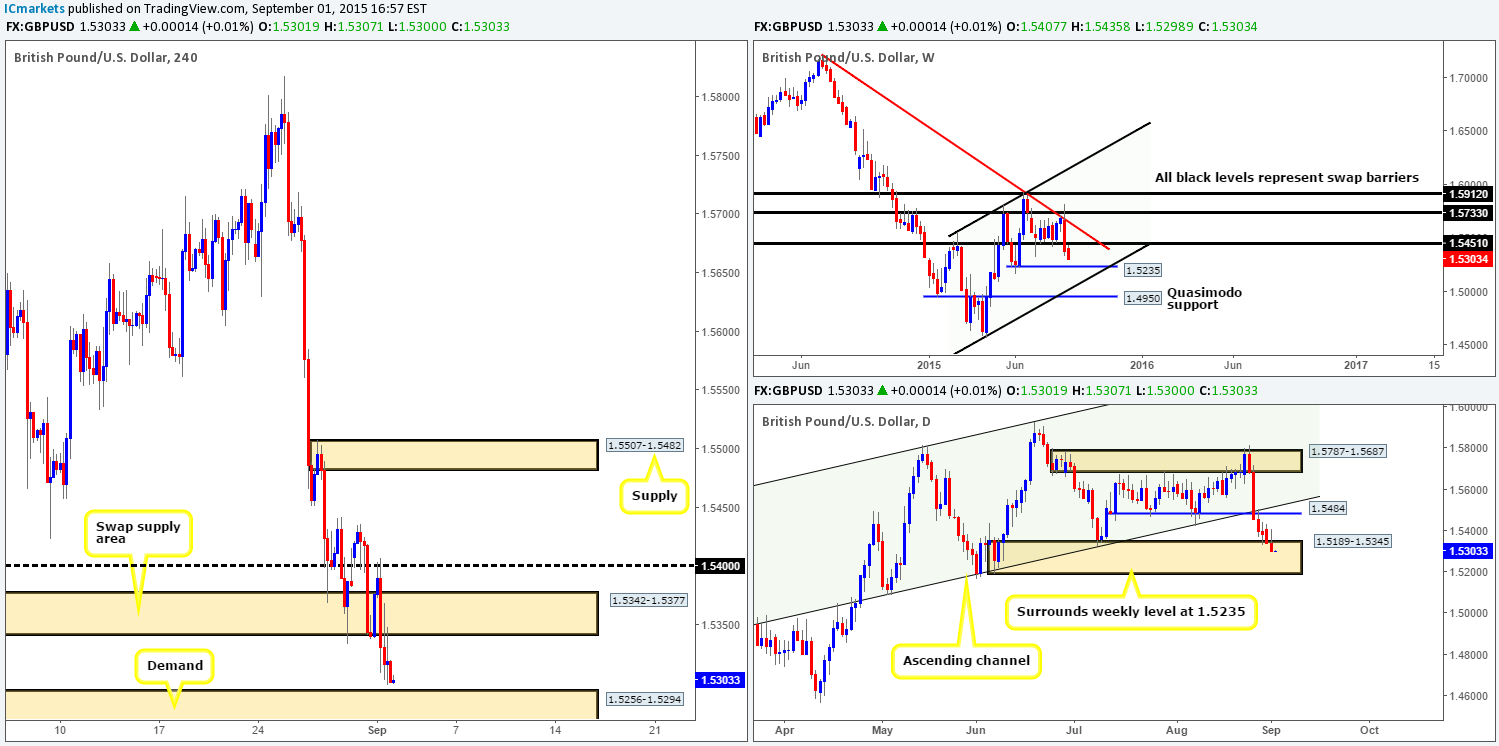
Levels to watch/ live orders:
- Buys: 1.5256-1.5294 [Tentative – confirmation required] (Stop loss: dependent on where on confirms this area).
- Sells: Flat (Stop loss: N/A).
AUD/USD:
Despite the bounce seen from psychological support 0.7100, the AUD sold off close to 120 pips amid yesterday’s trade. This, as shown on the chart, took out bids sitting at both 0.7100 and 0.7050, and ended with price closing the day just above the large psychological threshold 0.7000.
In view of price trading only a few pips away from a potential buy level (0.7000), where does our team stand in the bigger picture? Up on the weekly chart, things are not looking too good to be honest. Price action has responded very little to both the long-term weekly demand area at 0.6951-0.7326 or the weekly Quasimodo support 0.7031. In a similar fashion, the daily chart also shows the buyers struggling to hold on within daily demand at 0.6988-0.7098.
On account of the above, 0.7000 no longer looks a valid buy level. Don’t get us wrong, a bounce or even a major reversal could take place from here, but in our humble opinion, this is not a barrier we’d stamp high probability. So, instead of looking to buy from this level, we’re going to look for price to break below/retest 0.7000 as resistance to see if we can grab a piece of the long-term downtrend in play. As always, with psychological levels, we will only be permitted to enter short at this number if lower timeframe selling confirmation is also present.
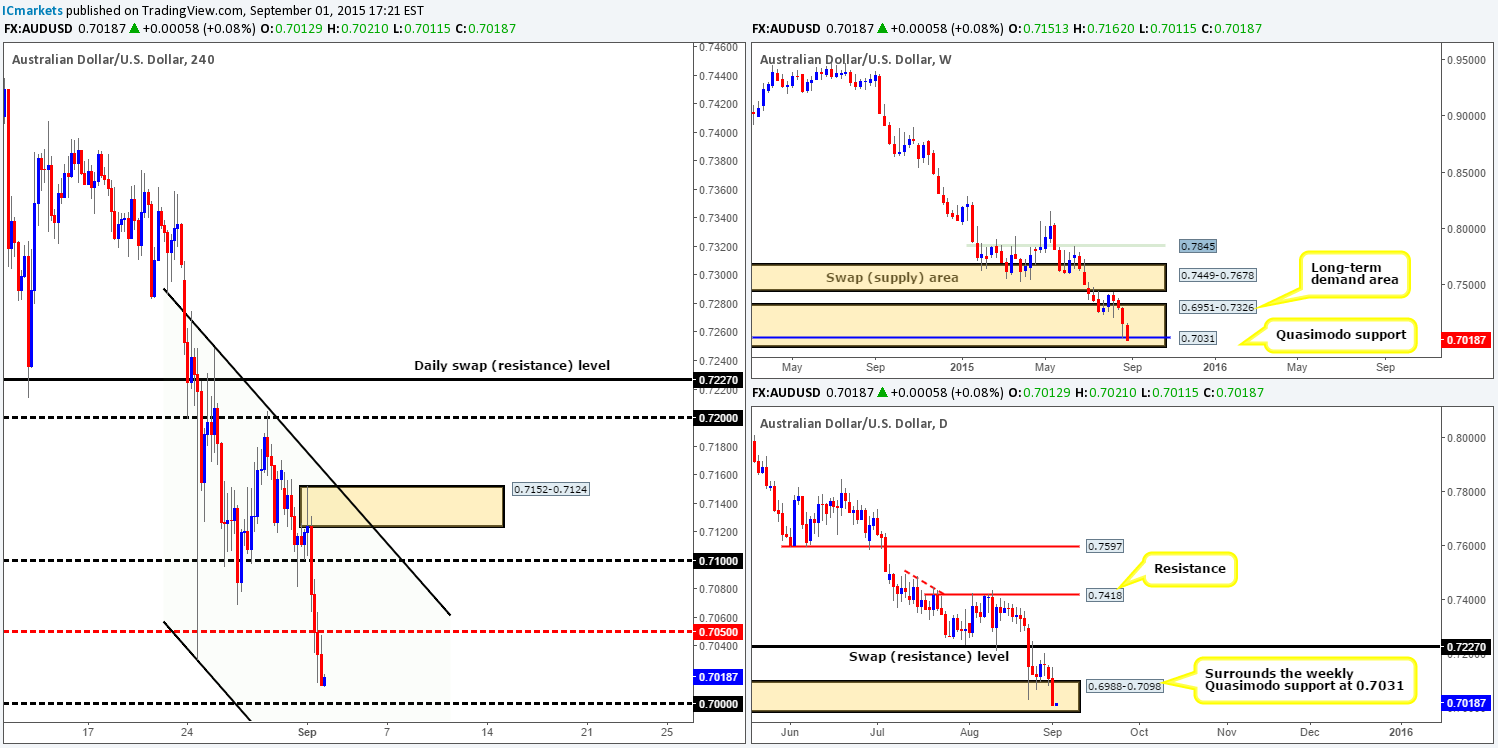
Levels to watch/ live orders:
- Buys: Flat (Stop loss: N/A).
- Sells: Watch for bids around 0.7000 to be consumed and then look to trade any retest seen at this level (confirmation required).
USD/JPY:
The USD/JPY pair, as you can see, cascaded lower during the course of yesterday’s trade. Both the 4hr swap (support) level at 120.66 and psychological support at 120.00 were taken out during this onslaught. Shortly after, however, price successfully retested 120.00 as resistance and continued lower reaching lows of 119.24 on the day.
Considering that price is now effectively trading mid-range between 120.00/119.00, let’s see how the land lies on the higher timeframe picture… Over on the weekly chart price is now teasing a weekly support barrier coming in at 118.22-119.25. Nonetheless, we’re a little skeptical as to the strength of this area due to the recently large spike that pierced through it (black arrow). Down on the daily chart, we see room for price to continue depreciating in value down to daily support at 118.38.
In light of the above, looking to buy from 119.00 may be a little too risky for our liking, since price could break through this number to head for the aforementioned daily support. Furthermore, below 119.00, there is very little active demand to stop price from dropping lower – check out the demand consumption tails (red arrows) seen at 118.90/118.43. In the event that a break lower is seen, one could either look to trade any retest seen at 119.00 (with confirmation), or simply wait to see if price reaches daily support before making your next decision.
All in all though, we quite content on remaining flat for the time being.
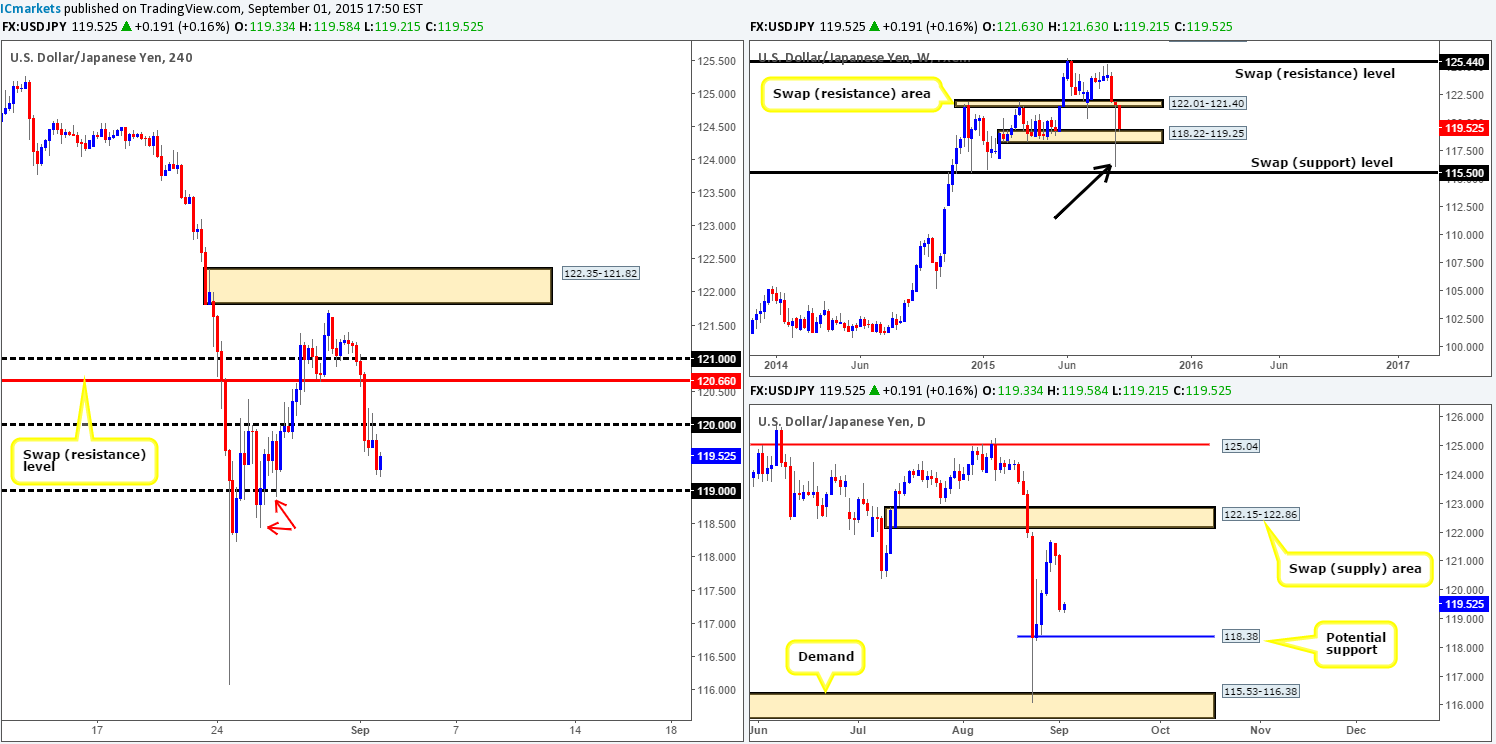
Levels to watch/ live orders:
- Buys: Flat (Stop loss: N/A).
- Sells: Watch for bids around 119.00 to be consumed and then look to trade any retest seen at this level (confirmation required).
USD/CAD:
For those who read Monday’s report on the USD/CAD pair http://www.icmarkets.com/blog/monday-31st-august-weekly-technical-outlook-and-review-uk-bank-holiday-today/ you may recall us mentioning to watch for a potential rebound at an AB=CD reversal zone drawn from1.3120. As can be seen from the chart, this pattern played out to perfection. Well done to any of our readers who managed a long trade from this area.
Using a top-down approach for this morning’s analysis, we can see that the weekly swap (support) level at 1.3128 is currently holding firm. Meanwhile, daily action reveals price rebounded beautifully from daily demand at 1.3058-1.3125. With both timeframes still showing room above to continue north, how do things stand on the 4hr timeframe? At the time of writing, price is tackling the mid-level number 1.3250. If a close above this level is seen, we may consider looking to enter long on any retest seen at this boundary, targeting 1.3300 as our first take-profit zone. Nevertheless, should price fail to close above 1.3250 and drop down to test 1.3200, this would also be another potential buy level to consider.
Just to be clear guys, we have no intention on setting any pending orders at the above said 4hr levels. Instead, we’ll wait to see if the lower timeframes show buying strength before trading this market.
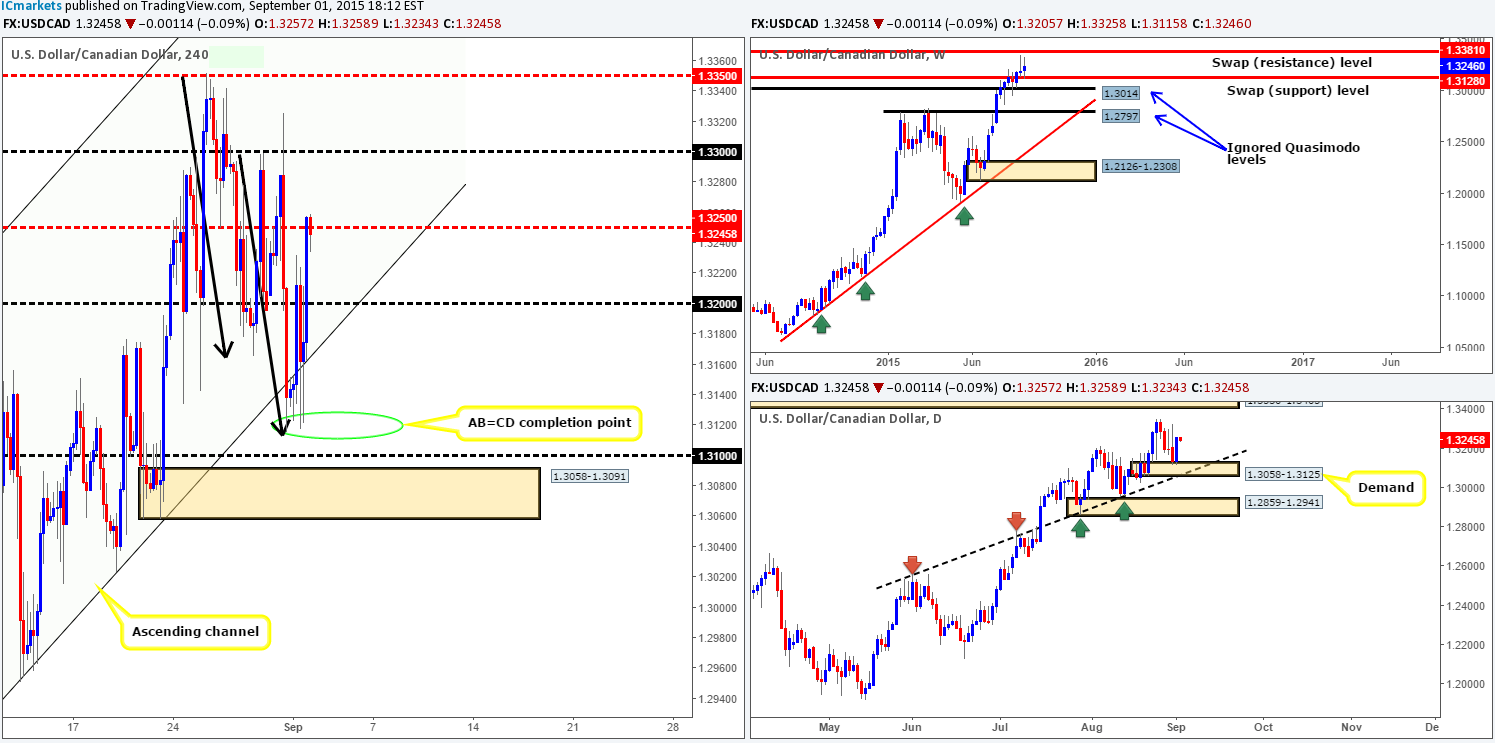
Levels to watch/ live orders:
- Buys: Watch for price to close above and retest 1.3250 as support for a potential long trade (confirmation required) 1.3200 [Tentative – confirmation required] (Stop loss: dependent on where one confirms this level).
- Sells: Flat (Stop loss: N/A).
USD/CHF:
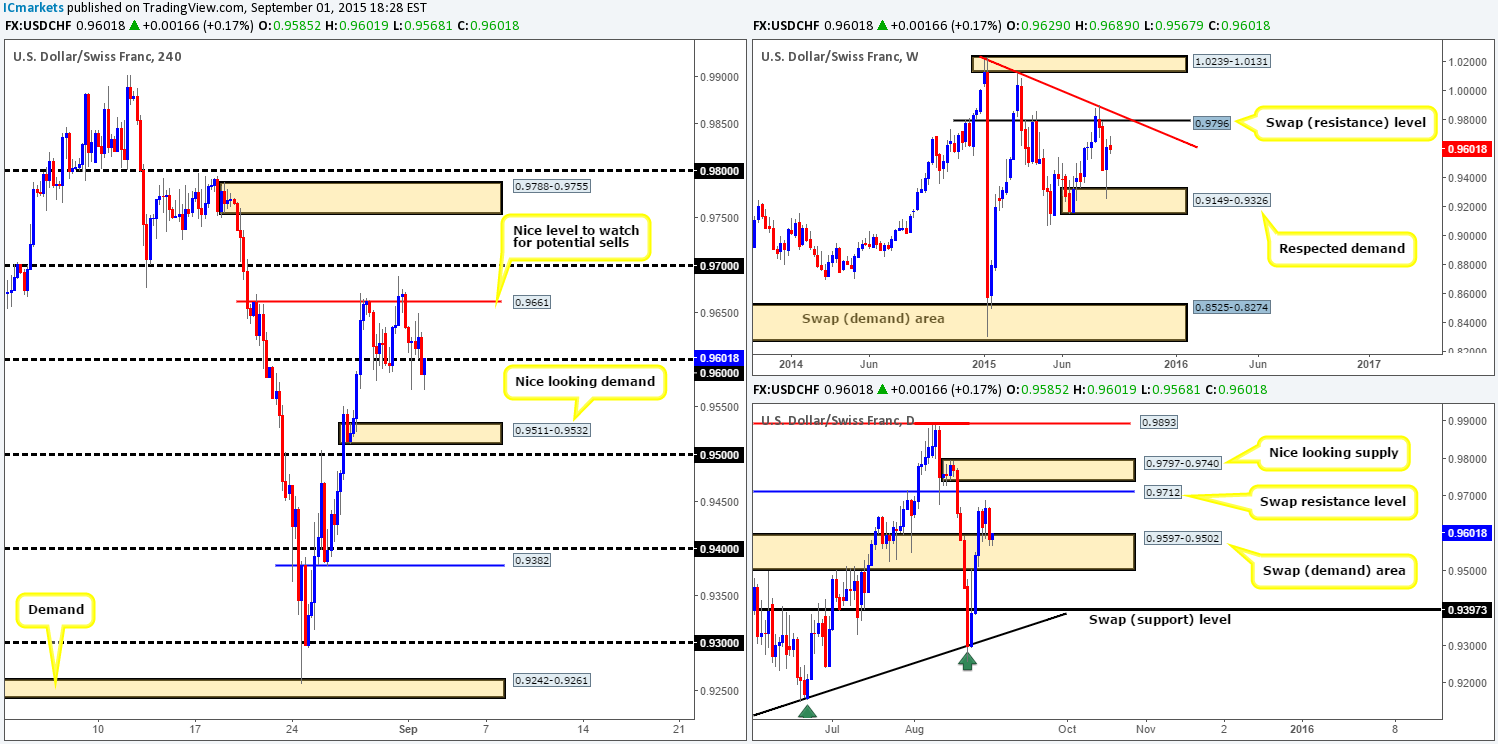
The USD/CHF pair, as you can see, found a floor of bids sitting around 0.9600 early on amid yesterday’s sessions. Price continued to hold above this number until a round of strong offers came into the market during the last few hours of the U.S. session. As a result, a 4hr close below 0.9600 was seen, which is currently being retested as resistance.
Shorting from 0.9600, at least from looking at only the 4hr chart, seems a viable option today as there is space to move lower down to 4hr demand at 0.9511-0.9532. However, once we throw the higher timeframes into the mix, the directional bias changes somewhat. From the weekly chart, we can see that there is clear space for price to continue appreciating up to a weekly swap (resistance) level at 0.9796. Meanwhile, the daily chart shows that price is back nibbling at the top-side of a daily swap (demand) area at 0.9597-0.9502.
So, given the above, shorting from 0.9600 may look good on the 4hr timeframe, but when we have both the weekly and daily timeframes indicating price could advance, it becomes a risky trade for us. With that, we believe 0.9600 will be taken out today and price will likely rally.
On that note, do keep an eye on lower timeframe price action for a possible entry long should price close above and retest 0.9600 today, since there is a clear 60-pip run up to 0.9661. Although the higher timeframes do indicate price may rally higher than this level, we would likely liquidate our full position here due to there possibly being unfilled sell orders left over from the fakeout above this level (pink circle) at 0.9689.
Levels to watch/ live orders:
- Buys: Watch for offers around 0.9600 to be consumed and then look to trade any retest seen at this level (confirmation required).
- Sells: Flat (Stop loss: N/A).
DOW 30:
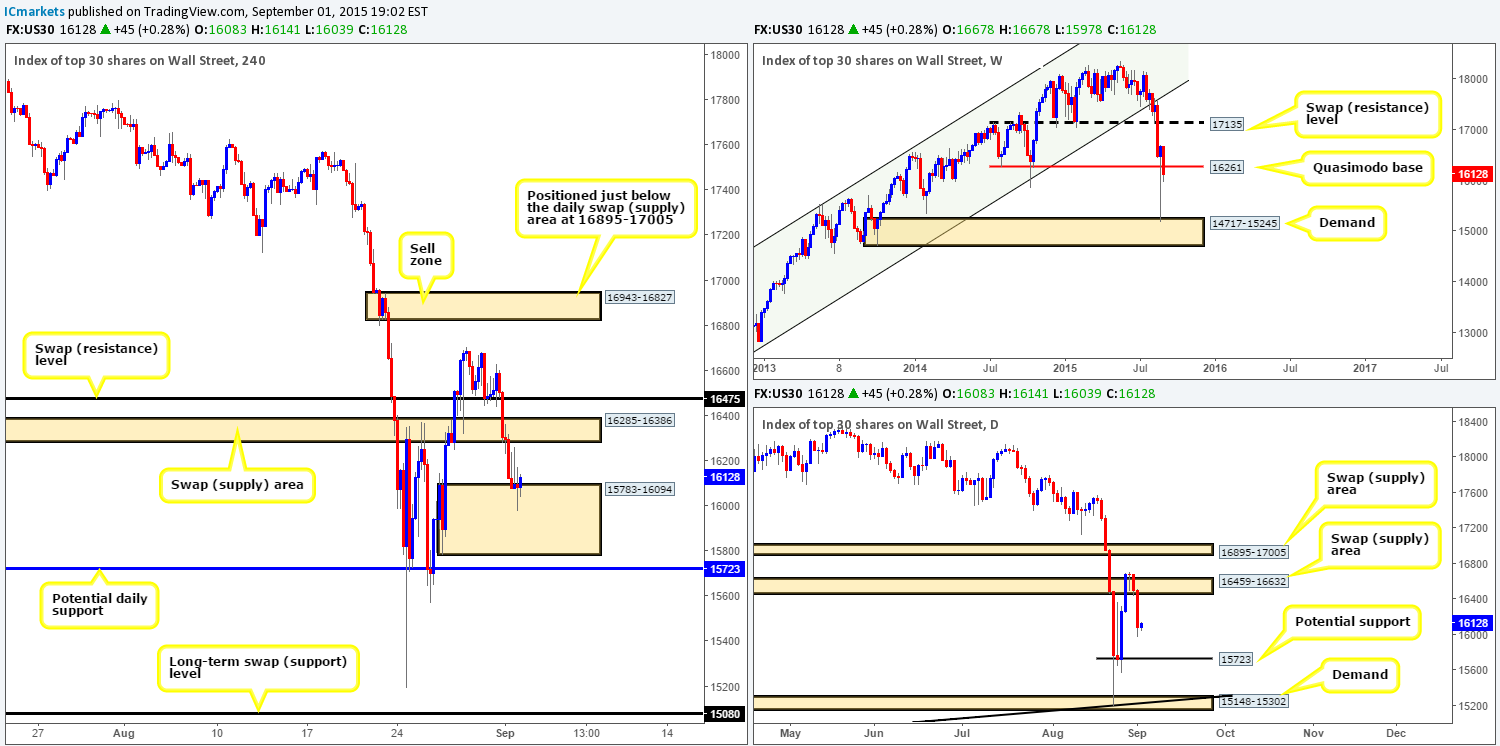
Going into yesterday’s trade we can see that the DOW index continued to sink, consequently punching through bids sitting at 16285-16386, and ending the day defending a 4hr demand at 15783-16094.
For anyone considering entering long purely based on price trading at 4hr demand, you may want to consider the following before doing so:
- Weekly action shows price trading BELOW a weekly Quasimodo support level at 16621. Bids are very likely weak at this level due to that humongous spike south seen last week.
- Daily action reveals that price shows room to continue depreciating lower down to potential daily support at 15723. This could, in effect, tempt well-funded traders to fake below the current 4hr demand down into the aforementioned daily support base.
- Risk/reward parameters come in less than 1:0 if one looks to target the 4hr swap (supply) area at 16285-16386.
Given the above points, we would not feel comfortable entering long from the current 4hr demand area. Therefore, to shelter us from a potentially unnecessary loss here, our team has agreed that remaining on the sidelines during today’s trade would likely be the best route to take.
Levels to watch/ live orders:
- Buys: Flat (Stop loss: N/A).
- Sells: Flat (Stop loss: N/A).
XAU/USD: (Gold)
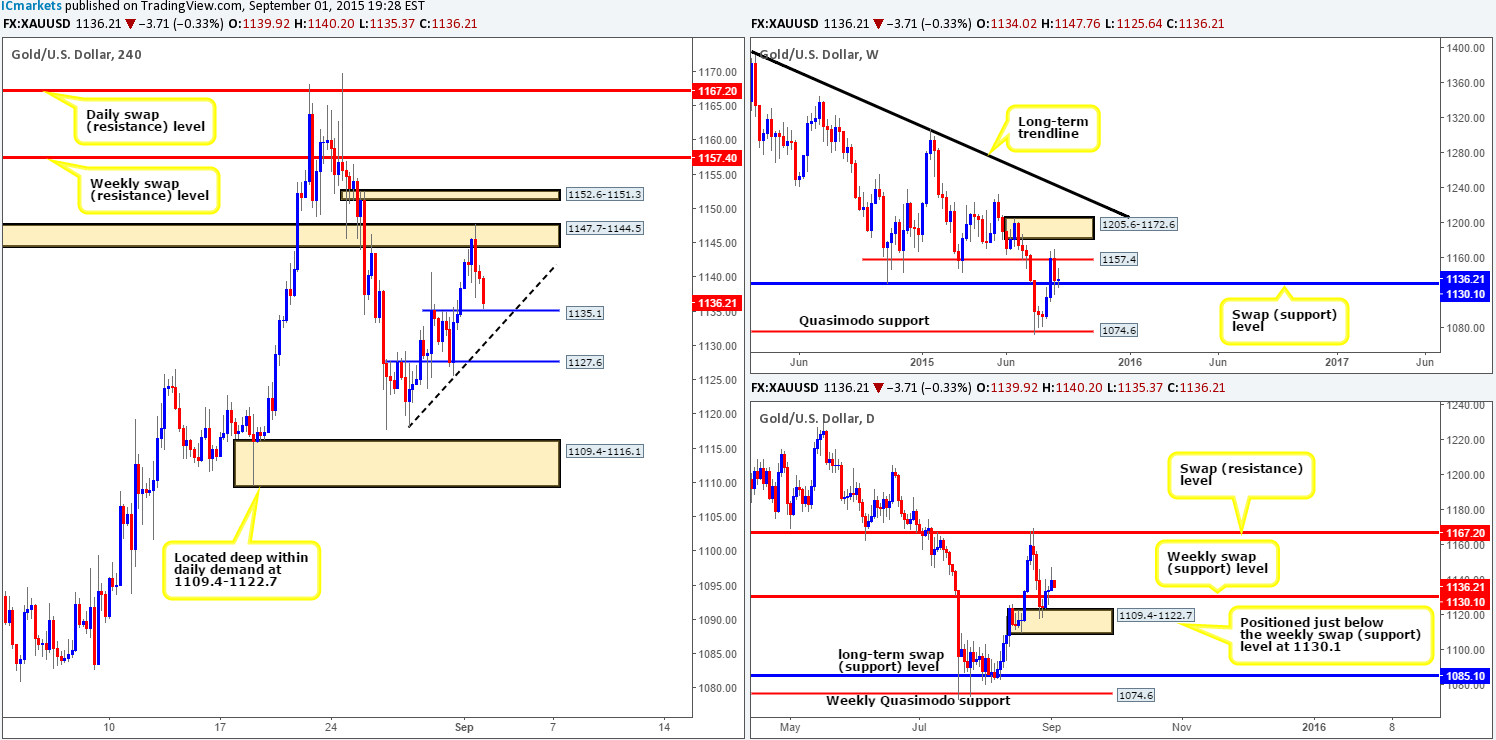
Following on from yesterday’s analysis http://www.icmarkets.com/blog/tuesday-1st-september-daily-technical-outlook-and-review/ price broke above Friday’s high 1140.8 and did in fact reach the 4hr swap (supply) area at 1147.7-1144.5. As we can all see, this zone has seen price react quite aggressively, resulting in Gold now heading down towards a potential 4hr swap (support) level at 1135.1.
Now for anyone that took a long position at our original trade call around 1127.6, at least 50% of your position should have been taken off at around the 1143.5 mark, and your stop now set at breakeven.
Given that the higher timeframe picture shows price trading from a weekly swap (support) level at 1130, and both the weekly and daily timeframes show room for prices to continue higher (1157.4/1167.2), 1135.1 may hold today.
In addition to this, the recent drive into the 4hr swap (supply) area at 1147.7-1144.5 likely consumed a ton of offers, thus potentially clearing the path north up to 1152.6-1151.3, followed closely by 1157.4.
That being the case, all eyes will be on 1135.1 today. Should this level see a rebound that also boasts lower timeframe confirming price action, we’ll jump in long targeting the 4hr resistances highlighted in bold above.
Levels to watch/ live orders:
- Buys: 1135.1 [Tentative – confirmation required] (Stop loss: dependent on where one confirms this level).
- Sells: Flat (Stop loss: N/A).


