
Key risk events today:
Australia Trade Balance; German banks closed in observance of German Unity Day; FOMC Member Evans and Quarles Speak; UK Services PMI; MPC Member Tenreyro Speaks; US ISM Non-Manufacturing PMI.
EUR/USD:
Following a YTD peak at 99.67, the benchmark US dollar index fell sharply Tuesday, weighed by technical selling off long-term weekly resistance at 99.62 and dismal US manufacturing data. Further losses were observed Wednesday, consequently propelling Europe’s shared currency higher for a second successive session. On the data front, private-sector US employment increased by 135,000 from August to September, on a seasonally adjusted basis, according to the ADP National Employment Report.
Wednesday’s technical research highlighted the following in regards to the EUR/USD’s technical framework:
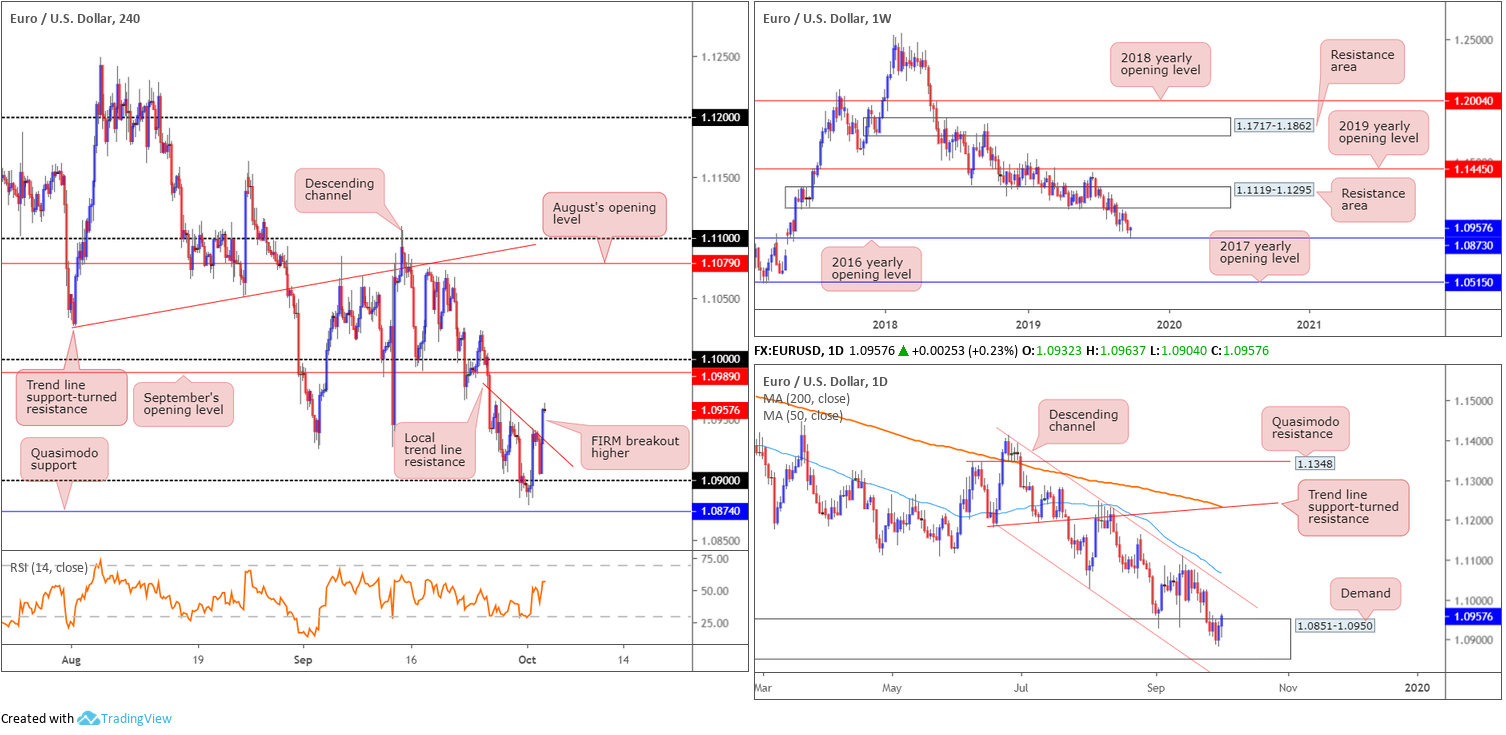
Weekly price is bottoming a few points north of 1.0873, the 2016 yearly opening level. This follows a breach of long-standing demand-turned resistance area at 1.1119-1.1295 in August. Concerning long-term trend direction, however, since topping in early 2018 at 1.2555, the trend remains facing a southerly bearing.
Daily action finds itself back within the parapets of demand at 1.0851-1.0950 – formed April 2017 and houses the 2016 yearly opening level inside its lower bounds. In addition to this, price has remained compressing within a descending channel formation since late June (1.1412/1.1026), with the 50-day SMA (blue – 1.1081) trailing the upper limit.
Across the page on the H4 timeframe, price whipsawed 20 points through 1.09 in recent movement, likely tripping stop-loss orders. Dollar selling, nonetheless, bolstered EUR/USD bidding and saw the unit reclaim 1.09+ status in strong fashion, consequently clawing back a large portion of Monday’s losses.
Wednesday’s report also went on to underline the local H4 trend line resistance taken from the high 1.0967, which, at the time, was capping upside.
Areas of consideration:
Noting weekly price rebounding higher just ahead of support, and daily price finding its feet within demand, buyers appear to be gathering steam. The local H4 trend line resistance on the H4 timeframe recently gave way and has, at least from a technical standpoint, potentially confirmed upside back to at least September’s opening level at 1.0989, closely shadowed by the key figure 1.10.
Entry at current price is certainly an option (protective stop-loss orders plotted below the H4 breakout candle’s lower shadow), or, for the more conservative trader, waiting for a retest motion to take shape may be an idea (entry/risk parameters can be determined according to the rejection candle’s structure).
GBP/USD:
In similar fashion to Tuesday, Wednesday’s segment finished unmoved, unable to penetrate Tuesday’s range (1.2338/1.2204) and seemingly unaffected by Brexit headlines. As a result, much of the following piece will echo similar vibes put forward in Wednesday’s technical briefing.
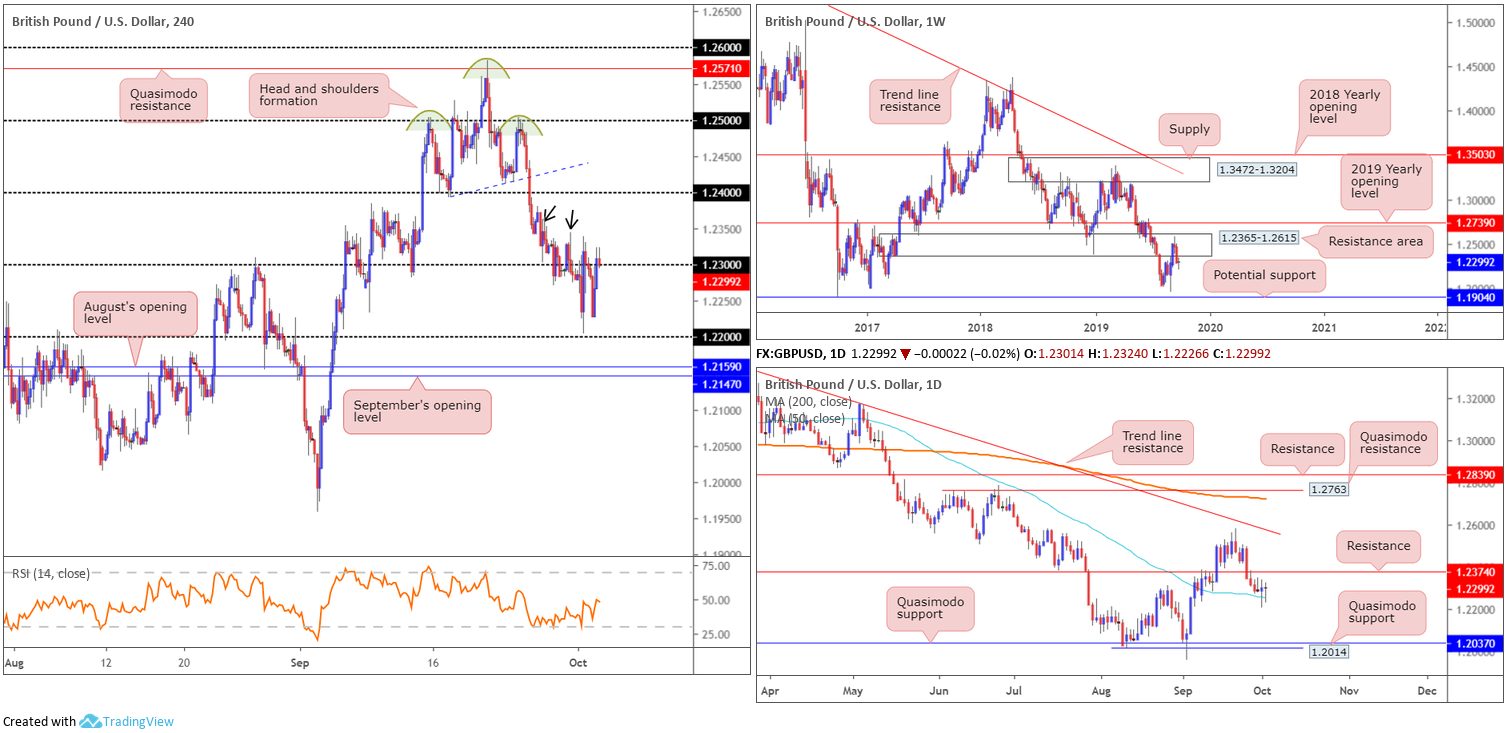
1.23 remains central to H4 structure. Limited supply to the left of current price is visible (note potential consumption spikes – black arrows) until reaching possible resistance at 1.24. Likewise, to the downside, limited support is seen until clocking 1.22.
On a wider perspective, weekly flow denotes a bearish bias after testing a long-term resistance area coming in at 1.2365-1.2615. Further downside from here has support at 1.1904 in view – held price action strongly higher in October 2016. The story on the daily timeframe shows the 50-day SMA (blue – 1.2252) recently entered the fray, with the possibility of a run materialising to resistance at 1.2374.
Areas of consideration:
Further downside is suggested according to the weekly timeframe, though daily price is seen halting at its 50-day SMA function. H4 price, on the other hand, is toying with 1.23, still appearing somewhat indecisive at the moment.
Irrespective of the direction one selects, opposing structure is evident. On these grounds, opting to remain on the side lines may still be the better path to take until clearer price action is observed.
AUD/USD:
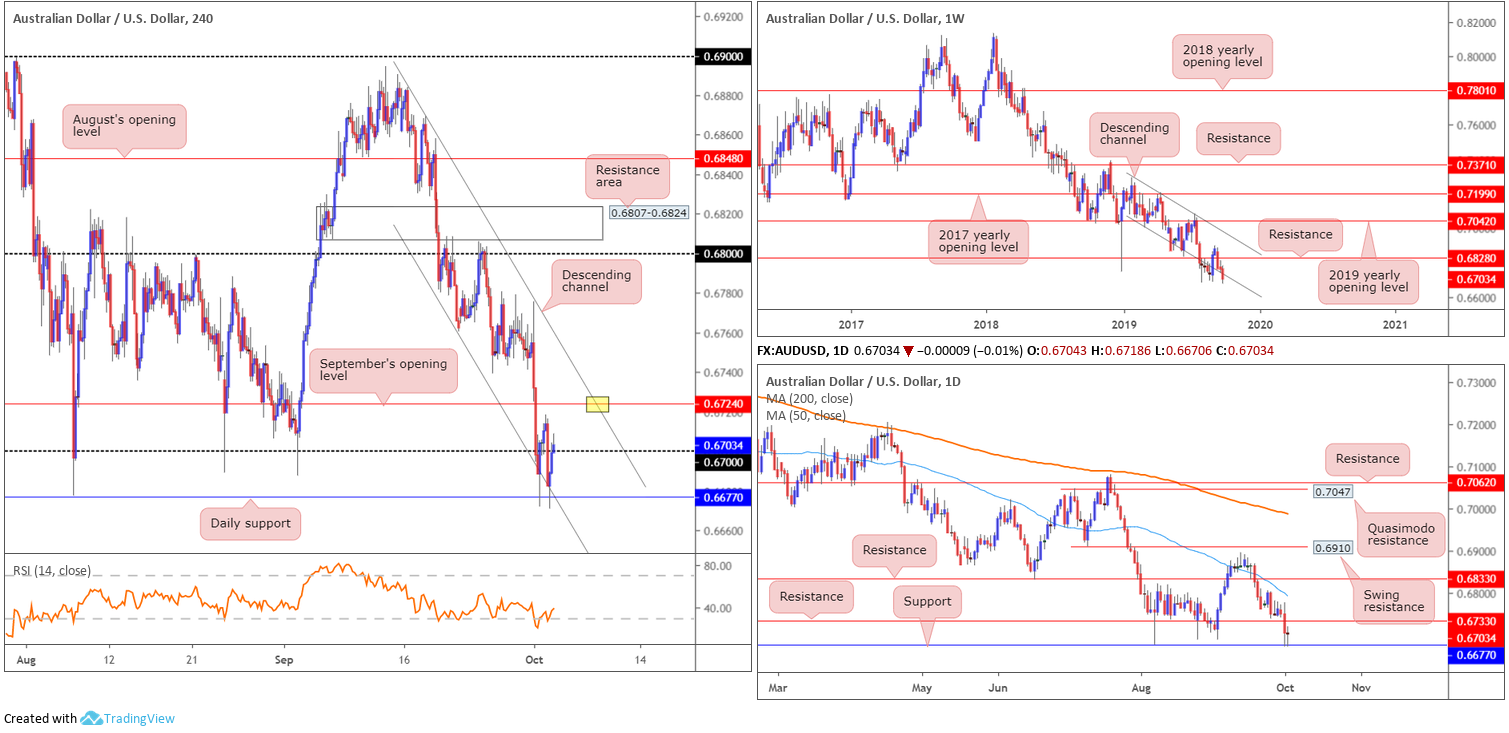
The Australian dollar wrapped up mostly unmoved against the US dollar Wednesday, rebounding from familiar support based on the daily timeframe at 0.6677, which happens to unite with H4 channel support extended from the low 0.6760. Broad-based dollar weakness lifted the H4 candles marginally beyond 0.67 into the close, exposing September’s opening level at 0.6724 as the next viable resistance point, closely followed by channel resistance etched from the high 0.6869. Indicator-based traders may also wish to note the Relative Strength Index (RSI) is seen exiting oversold territory.
Higher-timeframe research reveals weekly price remains biased to the downside, set to potentially extend the 2018 decline from tops of 0.8135. Channel support (taken from the low 0.7003) has recently gave way on the weekly timeframe and explored multi-year lows. As seen on the daily timeframe, support at 0.6677 remains in the fold, with resistance plotted at 0.6733.
Areas of consideration:
Although biased to the downside, the AUD/USD is at an uncertain juncture. Daily price trades at a point where strong buyers once resided at 0.6677 and H4 price recently overthrew the 0.67 handle.
Its unlikely buyers retain enough oomph to breakout of the H4 descending channel, given the overall trend. For that reason, traders likely eye September’s opening level at 0.6724 on the H4 as a possible sell zone today. Note this level also closely aligns with daily resistance mentioned above at 0.6733. An ideal scenario, of course, (but won’t occur until a few days), is a test at the H4 channel resistance (yellow), combined with H4 and daily resistances.
Shorts from the 0.6733/0.6724 combination has the H4 channel resistance to base stop-loss placement, with the initial downside target set at daily support 0.6677.
USD/JPY:
The US dollar ceded further ground to the Japanese yen Wednesday, with the US 10-year Treasury yield declining for a fifth successive session, currently trading sub 1.60%. US stocks also fell sharply on Wednesday, as investors grapple with fears of an economic recession, consequently ramping up demand for safe-haven assets, such as the Swiss franc, gold and the Japanese yen.
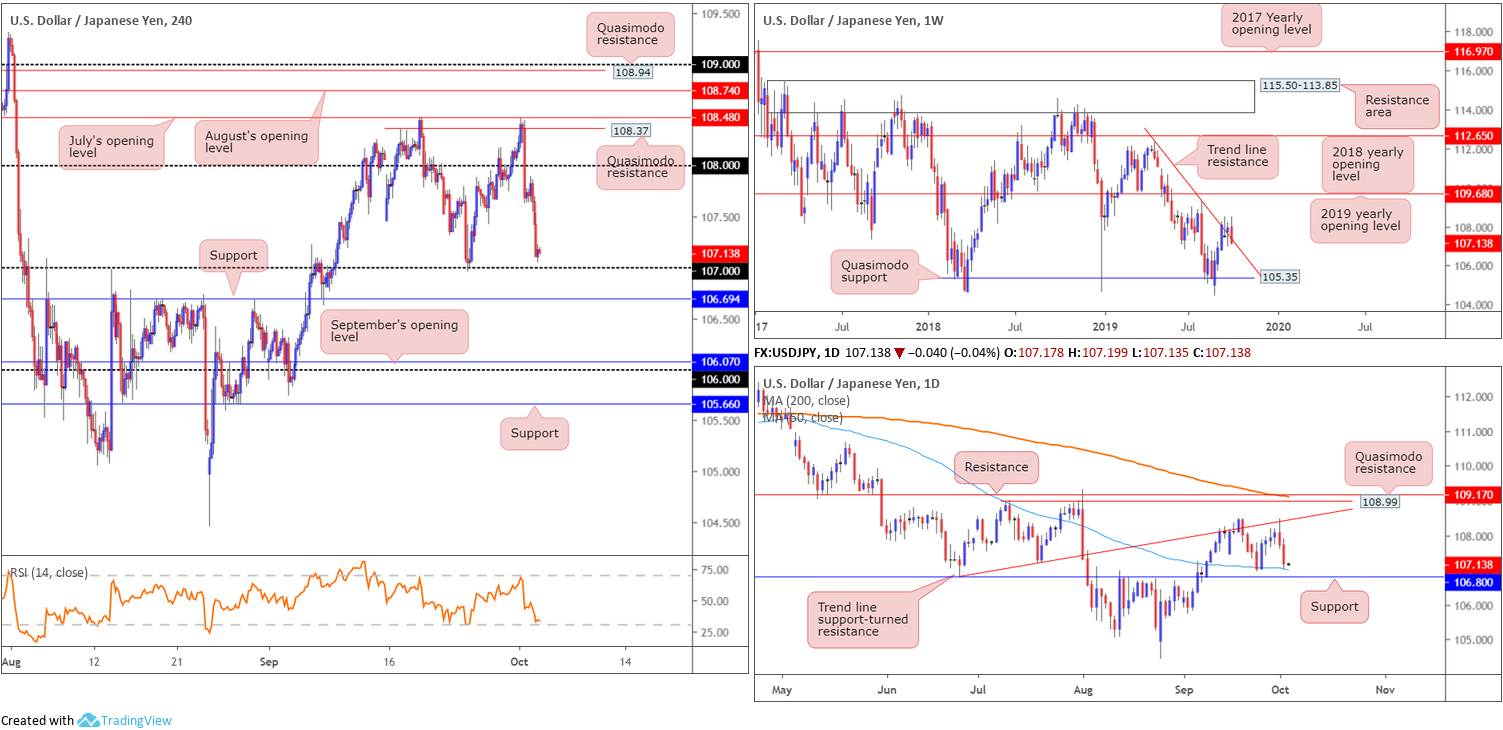
Technically, the market has receded slightly back below its trend line resistance (taken from the high 112.40) on the weekly timeframe, set to potentially finish the week in the shape of a bearish outside formation. Continued selling from this point has Quasimodo support at 105.35 to target. Concerning daily movement, the pair extended its rejection off trend line support-turned resistance extended from the low 106.78 and crossed swords with a 50-day SMA (blue – 107.01), sited just ahead of support at 106.80.
Against the backdrop of higher-timeframe flow, H4 price settled Wednesday a few points north of the 107 handle. For traders who remain short from the Quasimodo resistance at 108.37 (a noted resistance in recent reports), fantastic work. Beyond 107, traders’ crosshairs are likely fixed on reasonably clear-cut support priced in at 106.69, eleven points south of daily support at 106.80.
Areas of consideration:
Many traders have eyes on a long from 107 this morning. Logically, it resembles stable support, having seen it hold price higher last week as well as aligning with the 50-day SMA at 107.01. While the level may well hold for a second time, the possibility of a fakeout through 107 to H4 support at 106.69 is certainly there, as the level boasts a connection to daily support at 106.80. In addition, the monumental number of stop-loss orders (sell orders) contained below 107 (psychological numbers commonly suffer stop runs) provides liquidity to buy the said H4 support.
An ideal scenario, particularly for the more conservative trader, is to wait for H4 price to fake 107, test 106.69 and close back above 107. The breakout back through 107 can be considered a strong bullish indicator and a possible entry point, with protective stop-loss orders plotted beneath 106.69.
USD/CAD:
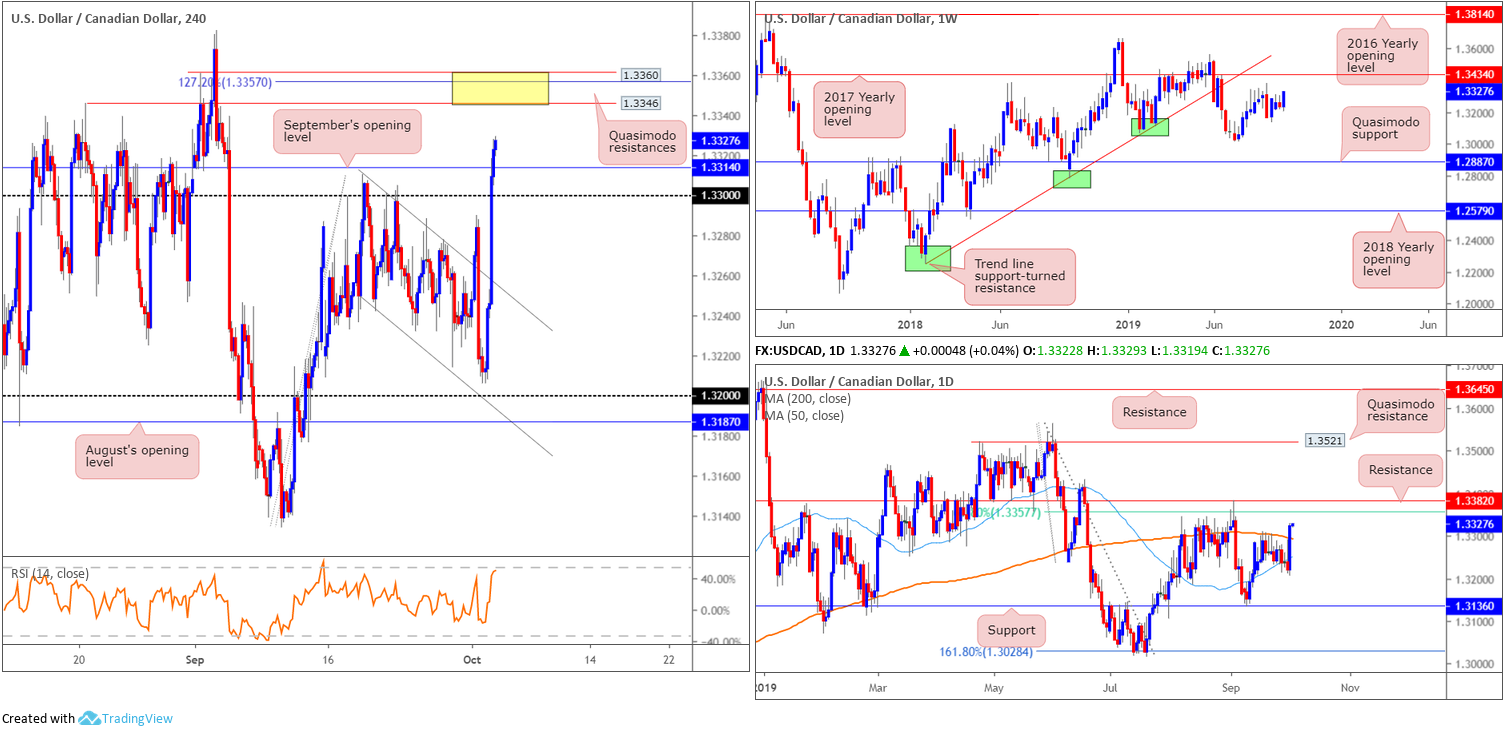
Based largely on WTI prices recording a ninth successive decline Wednesday, penetrating $52.50/bbl, the USD/CAD was heavily bid in recent trade, up 0.78%.
Running through channel resistance (extended from the high 1.3310), the round number 1.33 and September’s opening level at 1.3314, the H4 candles are now poised to approach two layers of Quasimodo resistance between 1.3360/1.3346 (yellow). Additionally, within the zone, the 127.2% Fibonacci extension point is seen at 1.3357. Before reaching this point, traders are urged to consider the possibility of a retest at 1.3314/1.33 taking shape.
On more of a broader perspective, daily flow dethroned its 200-day SMA (orange – 1.3294) and exposed resistance at 1.3382, positioned just north of the 61.8% Fibonacci resistance value at 1.3357. Recent gains also placed weekly resistance at 1.3434 back in the fold, priced in the form of the 2017 yearly opening level.
Areas of consideration:
All three timeframes propose additional buying, with the nearest port of resistance visible at the two layers of H4 Quasimodo resistances at 1.3360/1.3346. A retest at 1.3314/1.33, therefore, is a possibility today, followed by a run to the said resistance zone as the initial upside target. A retest in the shape of a H4 bullish candlestick signal would likely entice a number of traders into the market, basing entry and risk levels off the candlestick’s structure.
In addition to the above, the two layers of H4 Quasimodo resistances at 1.3360/1.3346 are also perhaps viewed as a sell zone. Converging with a H4 127.2% Fibonacci extension point and a 61.8% Fibonacci ratio at 1.3357 on the daily timeframe, this area has the potential to hold price action lower. Despite this, there is a threat of a possible fakeout above here to daily resistance at 1.3382 to also contend with.
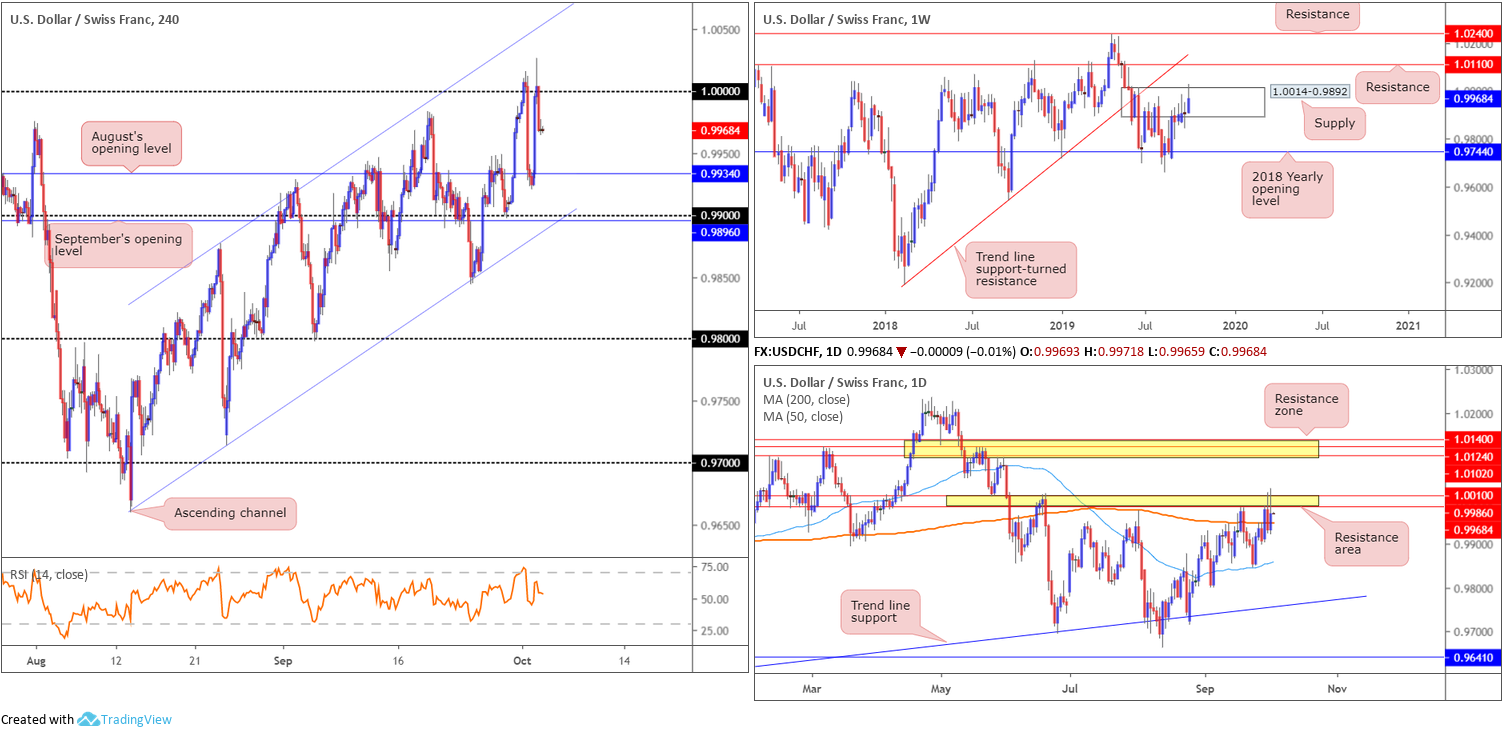
USD/CHF:
Kicking things off from the top this morning, we have weekly price challenging the upper perimeter of supply at 1.0014-0.9892. While the recent move to multi-month peaks at 1.0026 possibly tripped some buy stops, there is clearly still some selling interest existing. In the event of a push higher, traders are urged to note resistance coming in at 1.0110.
A closer reading of price action on the daily timeframe has the candles defending the underside of a narrow resistance zone at 1.0010/0.9986. Price action is now sited just north of the 200-day SMA (orange – 0.9949). Given the recent moves higher are reasonably considerable in comparison to the said resistance area, buyers appear to have the upper hand and could eventually mount an advance to the next resistance zone at 1.0140/1.0102.
H4 activity remains capped beneath the key figure 1.0000 (parity), though buy stops above the level are likely well and truly filled thanks to yesterday’s spike. Above 1.0000, buyers have channel resistance (pencilled in from the high 0.9877) to contend with, whereas familiar support in the mould of August’s opening level at 0.9934 is seen south of price.
Areas of consideration:
Selling pressure from 1.0000 has thus far been relatively feeble, halting at nearby support from 0.9934. This – coupled with two conspicuous daily spikes through daily resistance at 1.0010/0.9986 (likely tripping stops) and weekly sellers lacking within supply at 1.0014-0.9892, buyers may have an edge here.
Ultimately, though, waiting for H4 price to reclaim 1.0000 before pulling the buy trigger might be a safe option, targeting the H4 channel resistance (0.9877) as the initial upside take-profit zone.
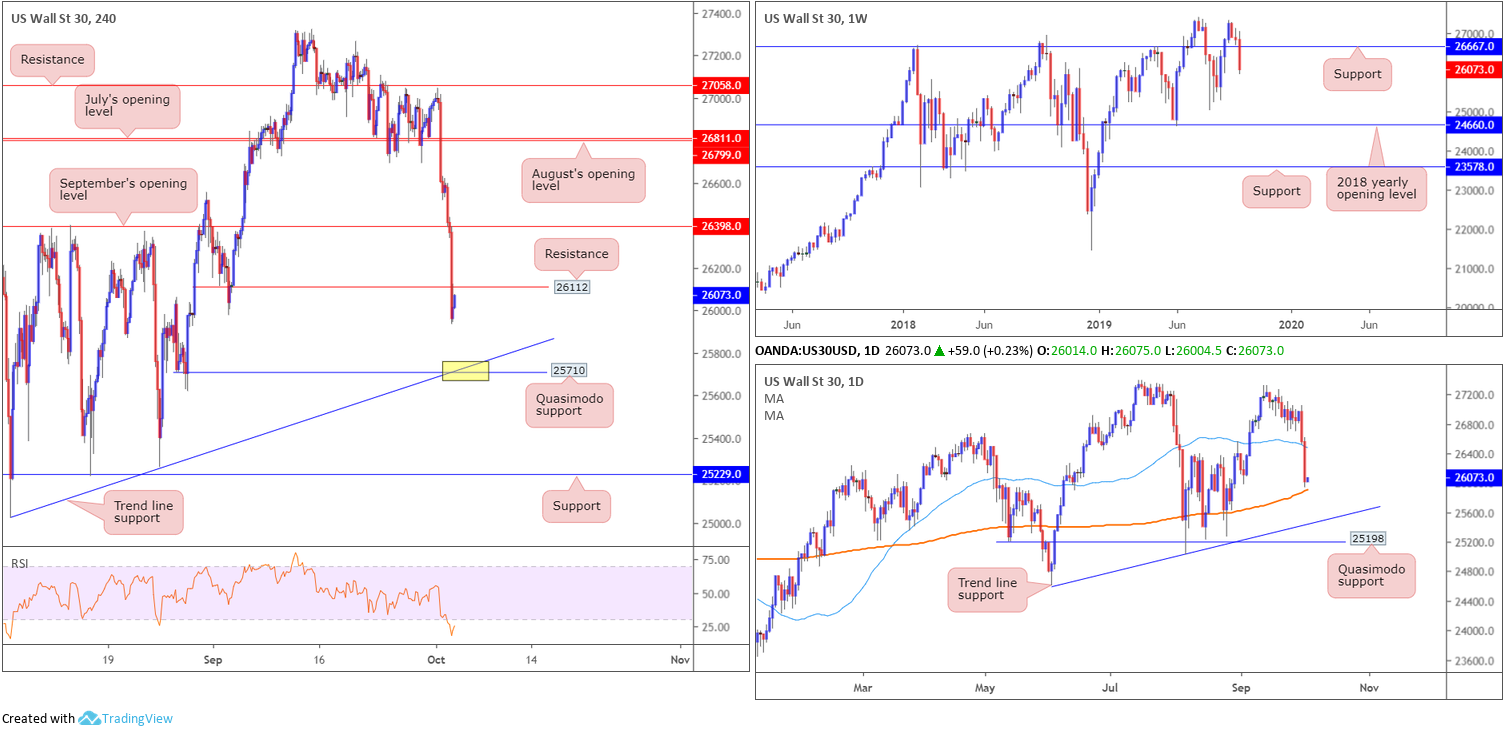
Dow Jones Industrial Average:
US equity indexes fell sharply across the board for a second consecutive session Wednesday amid concerns over slowing manufacturing activity, highlighting a possible economic downturn. The Dow Jones Industrial Average shed 494.42 points, or 1.86%; the S&P 500 also fell 52.64 points, or 1.79% and the tech-heavy Nasdaq 100 declined 133.36 points, or 1.74%.
Technically speaking, weekly price resides decisively beneath support at 26667, theoretically setting the stage for an approach towards the 25024 August 5 low, followed closely by the 2018 yearly opening level at 24660. The story on the daily timeframe observed price action cross beneath its 50-day SMA (blue – 26478) and conclude the session just ahead of the 200-day SMA (orange – 25913).
A number of H4 supports were taken out during yesterday’s selloff, most notably September’s opening level at 26398 and Quasimodo support at 26112, both now serving resistances. The next downside targets on the H4 timeframe can be seen at a Quasimodo support drawn from 25710, which aligns with trend line support extended from the low 25024.
Areas of consideration:
The point H4 Quasimodo support at 25710 and trend line support merge (yellow) is an area buyers may be watching today for potential opportunities. Note this combination also lies only a few points south of the 200-day SMA located on the daily timeframe. The first upside target from this neighbourhood has 26112 in sight.
H4 action has already retested the underside of broken Quasimodo support at 26112, which could, by and of itself, be considered a sell towards the 200-day SMA/25710.
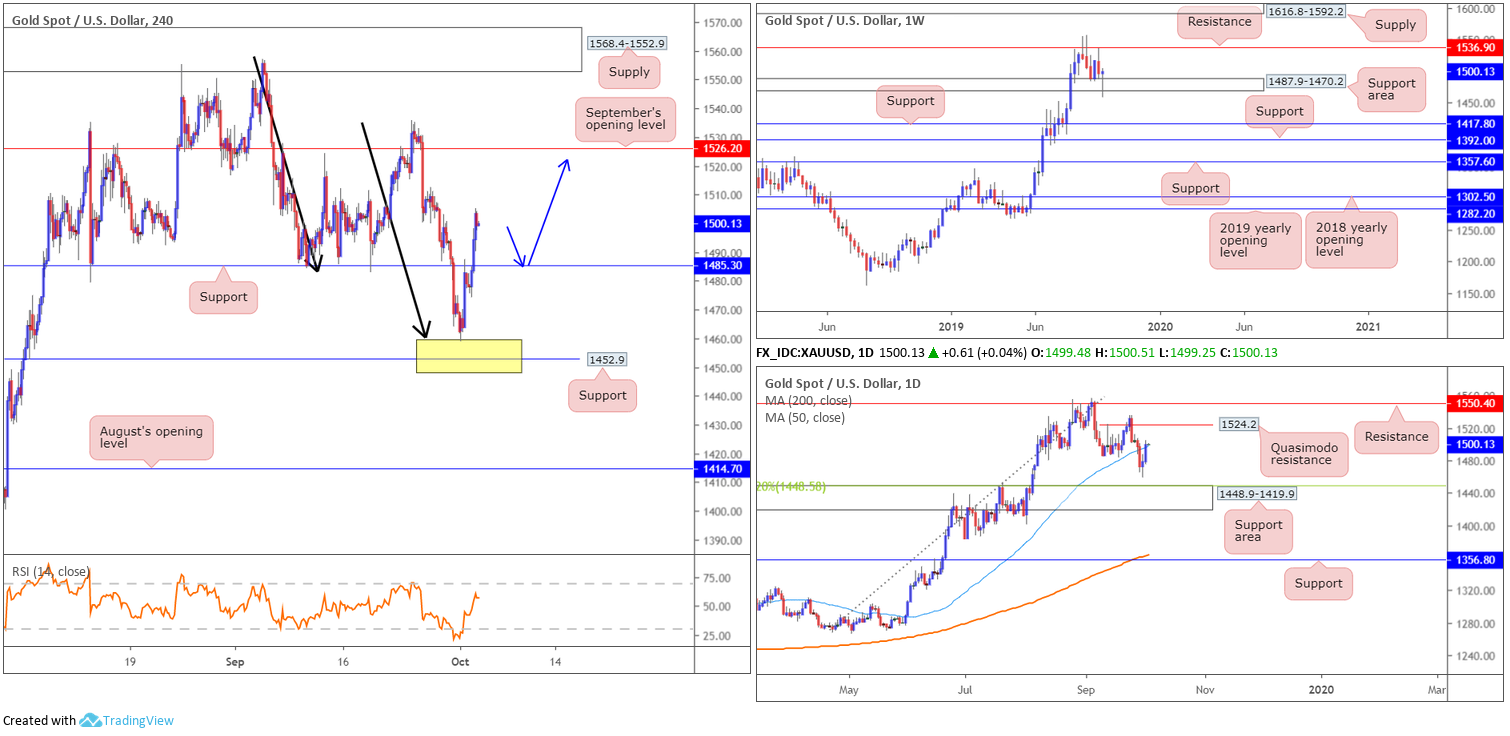
XAU/USD (GOLD):
Markets entered a strong phase of risk aversion Wednesday, ramping up demand for safe-haven assets. Wednesday built on Tuesday’s recovery, extending beyond H4 resistance (now acting support) at 1485.3 and reaching highs at 1505.1. Well done to any of our readers who managed to hold their long position off the noted area of support between 1448.9/1460.2 (comprised of the top limit of a daily support area at 1448.9-1419.9, a H4 support level at 1452.9 and a H4 AB=CD completion point at 1460.2 [black arrows]). Further buying on the H4 chart is certainly a possibility, according to structure, with the next upside hurdle positioned at 1526.2: September’s opening level.
In light of recent trading, the weekly support area at 1487.9-1470.2 had its lower edge torn through, though appears to have stabilised by way of a hammer candlestick formation (considered a bullish signal). Latest from the daily timeframe has price action a touch above its 50-day SMA (blue – 1498.2), eyeing a run towards local Quasimodo resistance at 1524.2 and possibly resistance at 1550.4.
Areas of consideration:
As all three timeframes exhibit space to press higher, longs are likely the order of the day. Entering long at current price, however, is tricky, given limited support. A retest at H4 support drawn from 1485.3, nonetheless, would possibly entice buyers into the market, with an upside target set at the daily Quasimodo formation 1524.2, closely trailed by September’s opening level at 1526.2.
For conservative buyers, waiting for additional candlestick confirmation to form off 1485.3 might be an option worth exploring. This will help identify buyer intent before committing funds, and will also provide entry and risk levels to work with.
The accuracy, completeness and timeliness of the information contained on this site cannot be guaranteed. IC Markets does not warranty, guarantee or make any representations, or assume any liability regarding financial results based on the use of the information in the site.
News, views, opinions, recommendations and other information obtained from sources outside of www.icmarkets.com.au, used in this site are believed to be reliable, but we cannot guarantee their accuracy or completeness. All such information is subject to change at any time without notice. IC Markets assumes no responsibility for the content of any linked site.
The fact that such links may exist does not indicate approval or endorsement of any material contained on any linked site. IC Markets is not liable for any harm caused by the transmission, through accessing the services or information on this site, of a computer virus, or other computer code or programming device that might be used to access, delete, damage, disable, disrupt or otherwise impede in any manner, the operation of the site or of any user’s software, hardware, data or property.


