
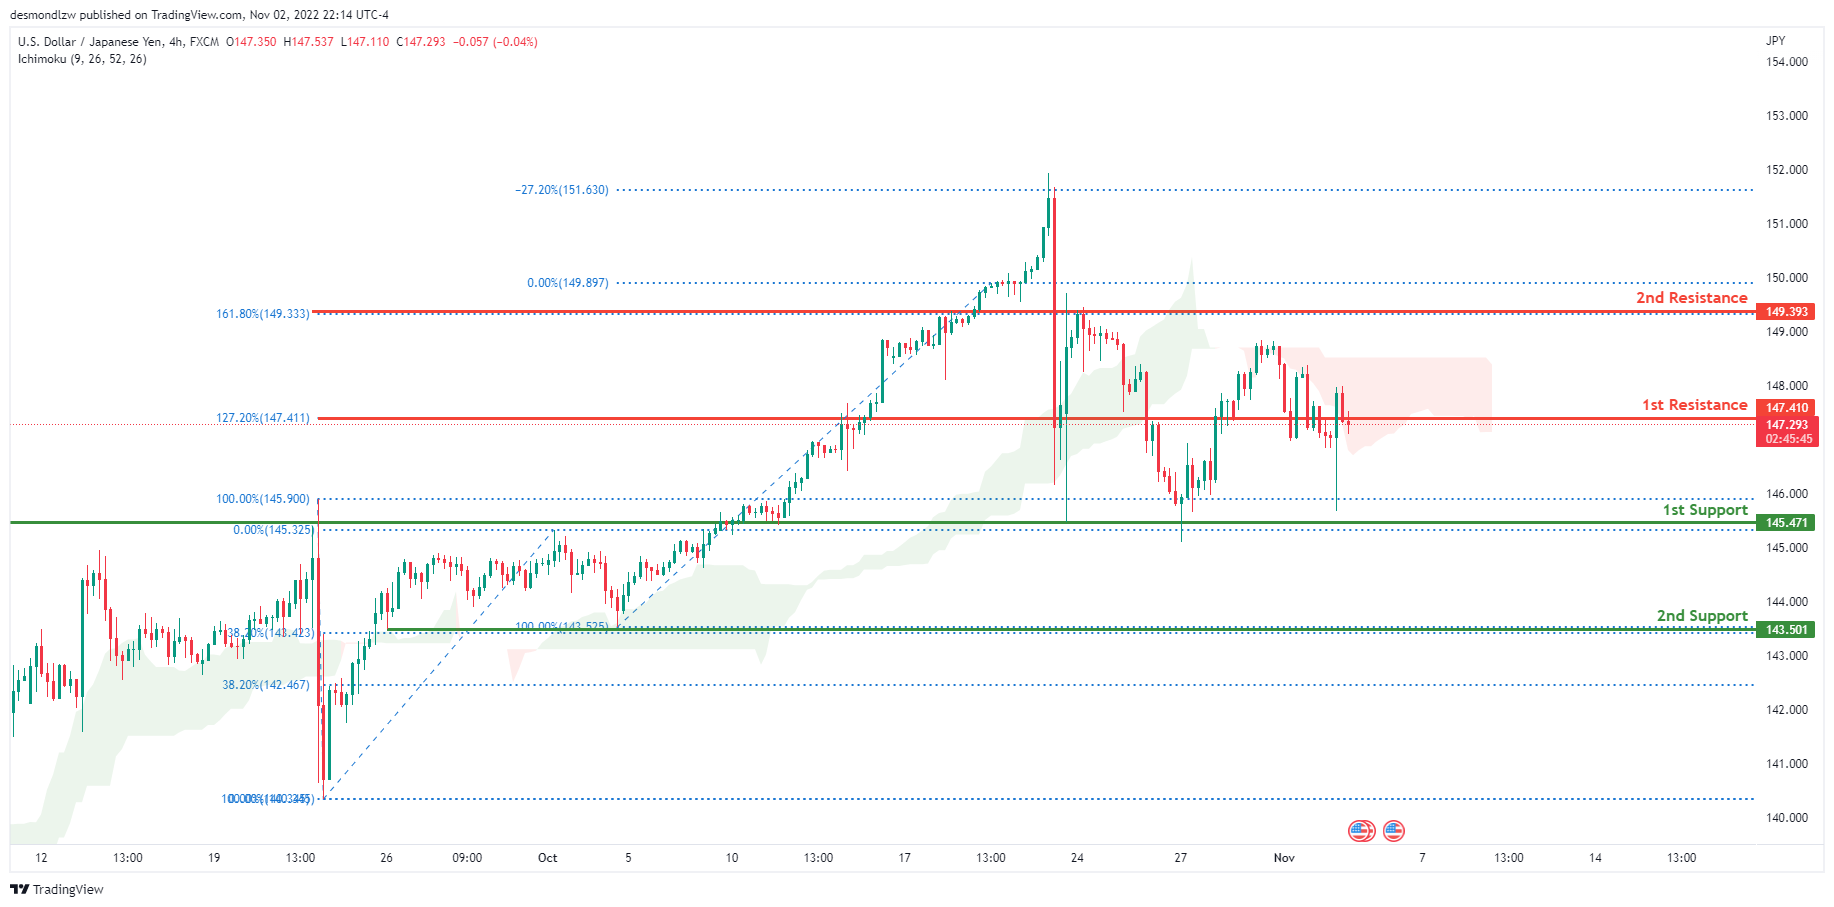
USD/JPY:
The current general bias for USDJPY on the H4 chart is bearish. Overnight, USDJPY experienced increased volatility due to the FOMC news release at 2am New York time, with price closing under the 1st resistance line at 147.410 where the 127.2% Fibonacci extension line is located. Price is currently trading at 147.256 at time of writing. If this bearish momentum continues, expect USDJPY to possibly head downwards towards the 1st support at 145.751 where the 100% and 0% Fibonacci lines are located.
Areas of consideration:
- H4 time frame, 1st resistance at 147.410
- H4 time frame, 1st support at 145.751
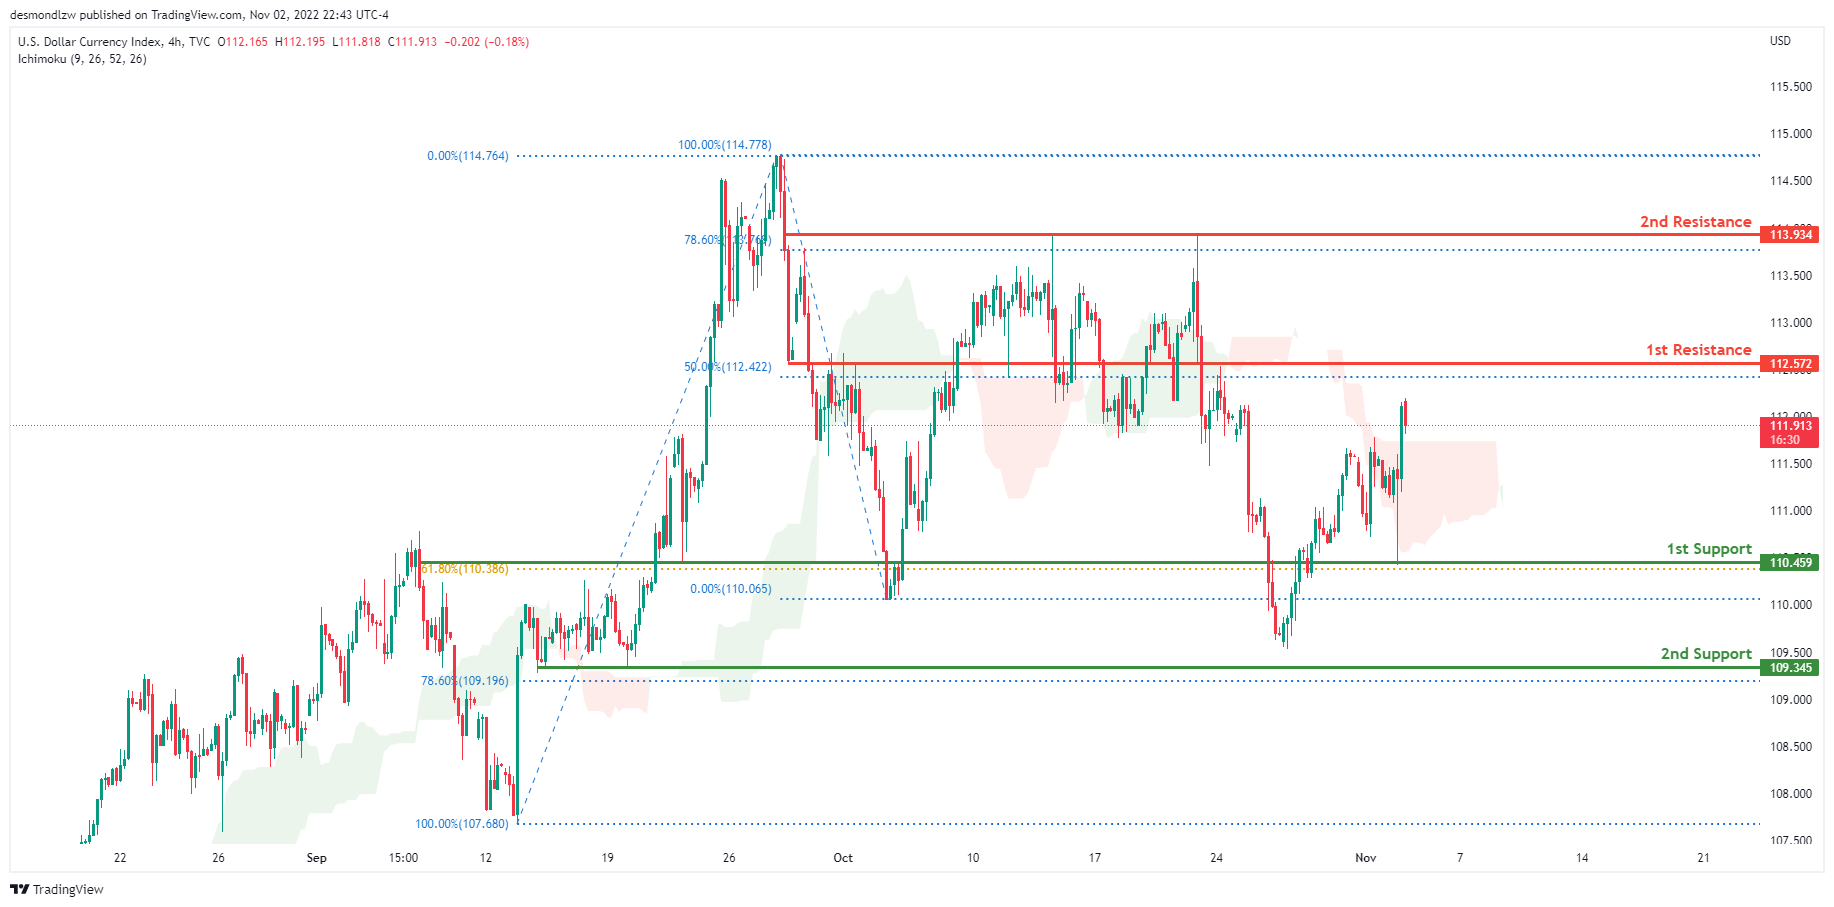
DXY:
On the H4 chart, the overall bias for DXY is bullish. To add confluence to this, the price is above the Ichimoku cloud which indicates a bullish market. Overnight, price experienced increased volatility due to the release of the FOMC news with price reflecting off the 1st support at 110.459, where the 61.8% Fibonacci line is located strongly. The price is currently trading at 111.931 at time of writing. If this bullish momentum continues, expect price to possibly head towards the 1st resistance level at 112.572 where the 50% Fibonacci line is located.
Areas of consideration:
- H4 time frame, 1st resistance at 112.572
- H4 time frame, 1st support at 110.459
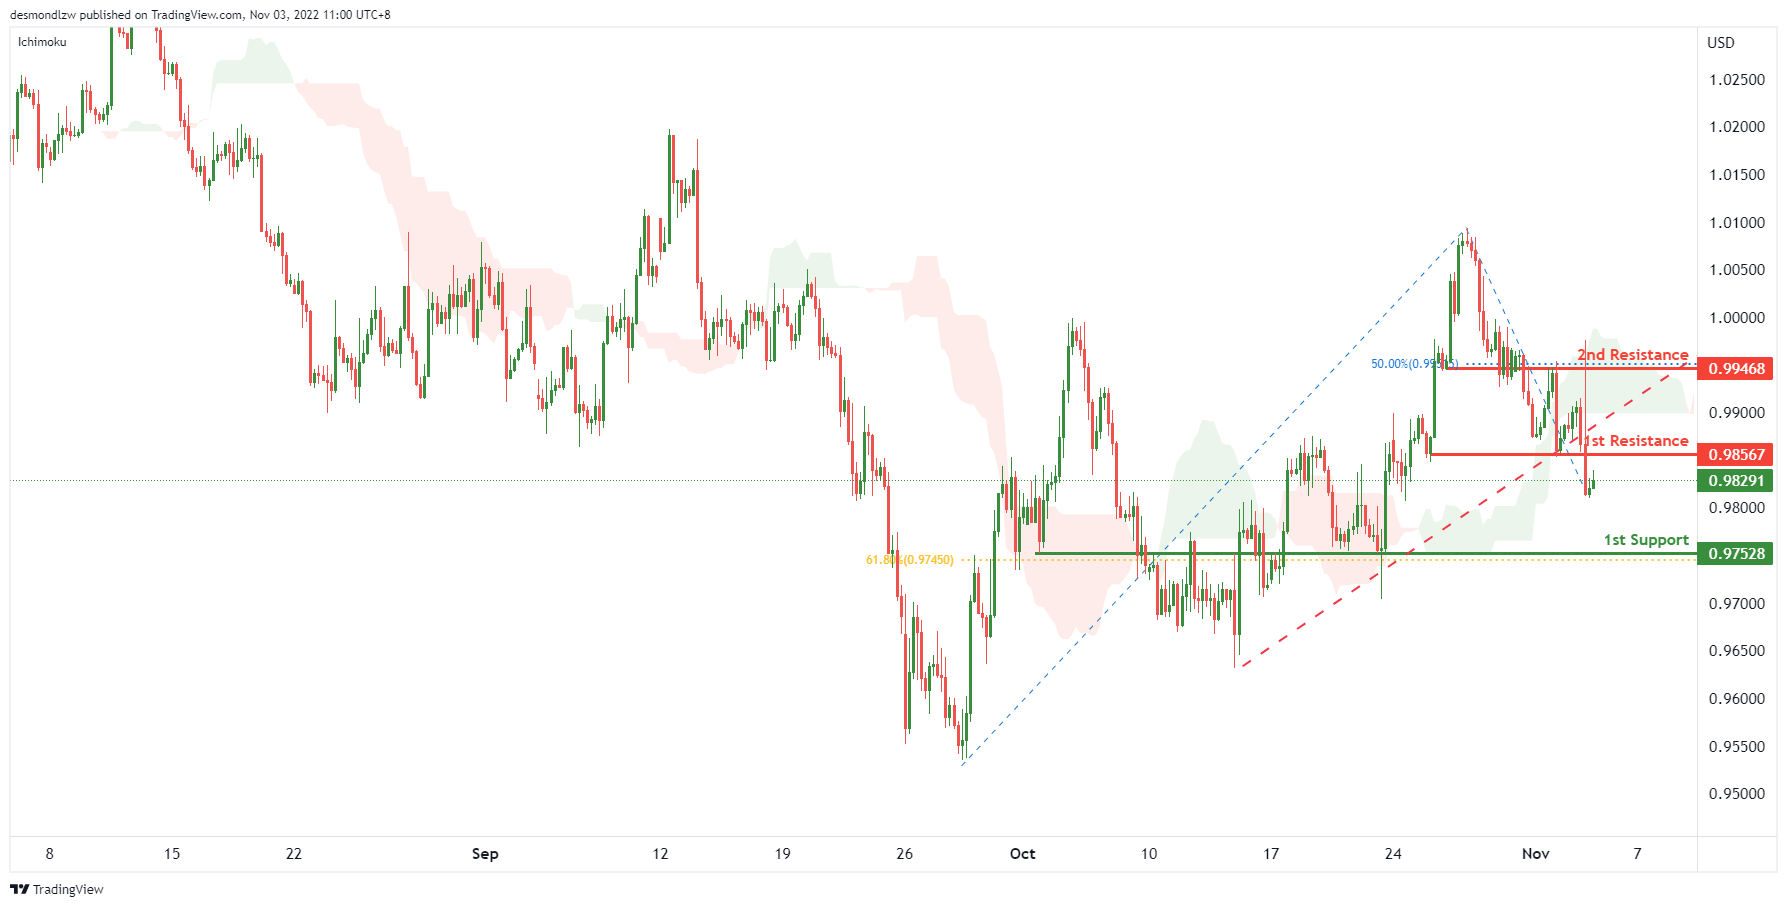
EUR/USD:
On the H4, with the price breaking the ascending trendline and ichimoku cloud, we have a bearish bias that the price may drop from the 1st resistance at 0.98567, which is in line with the swing lows to the 1st support at 0.97528, where the overlap support and 61.8% fibonacci retracement are. Alternatively, the price may rise to the 2nd resistance at 0.99468, where the 50% fibonacci retracement and overlap resistance are.
Areas of consideration :
- H4 1st resistance at 0.98567
- H4 1st support at 0.97528
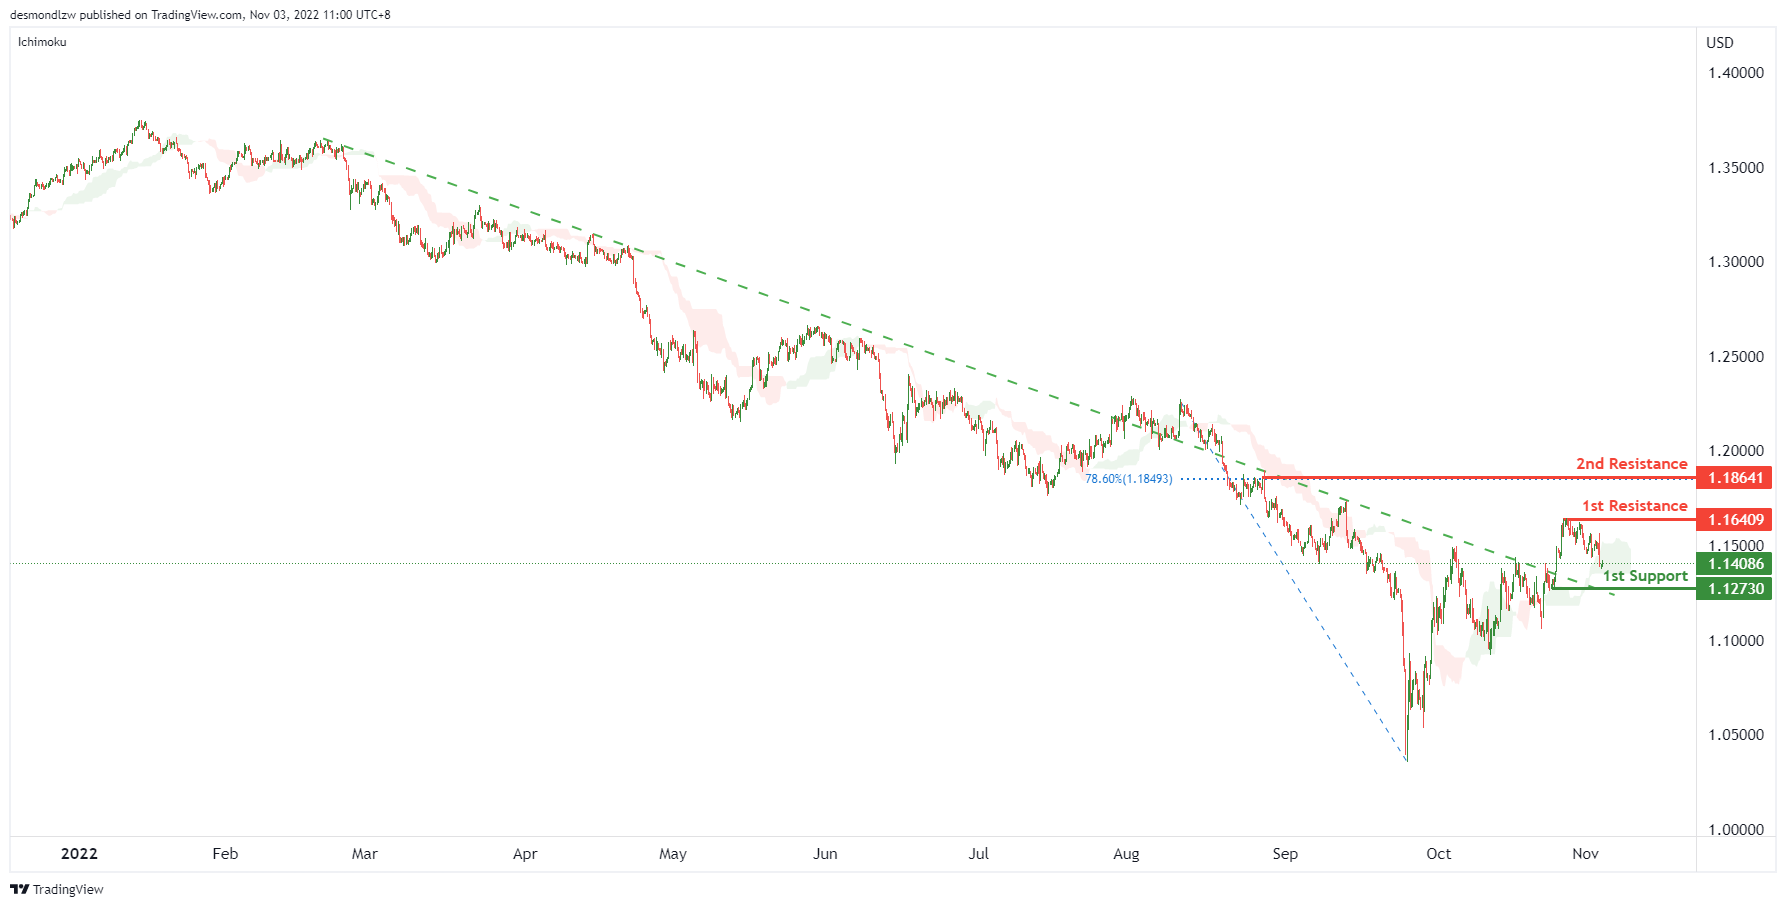
GBP/USD:
On the H4, price is above the ichimoku cloud and breaking the descending trendline, we have a bullish bias that the price may test the 1st resistance at 1.16409, which is in line with the previous swing high. If the 1st resistance is broken, the 2nd resistance is at 1.18641, where the 78.6% fibonacci retracement sits. Alternatively, the price may drop to the 1st support at 1.12730, where the swing low support is.
Areas of consideration:
- H4 current price
- H4 1st resistance at 1.16409
USD/CHF:
On the H4 chart, the overall bias for USDCHF is bullish. To add confluence to this, the price is above the Ichimoku cloud which indicates a bearish market. Overnight, USDCHF had some bullish momentum upwards with the price reflecting off the 1st support at 0.99250 where the 23.6% Fibonacci line is located. Price is currently trading at 1.00165 at time of writing. Expecting price to possibly head back up to retest the 1st resistance line at 1.00678 where the 38.2% and 78.6% Fibonacci lines are located.
Areas of consideration
- H4 1st support at 0.99250
- H4 1st resistance at 1.00678

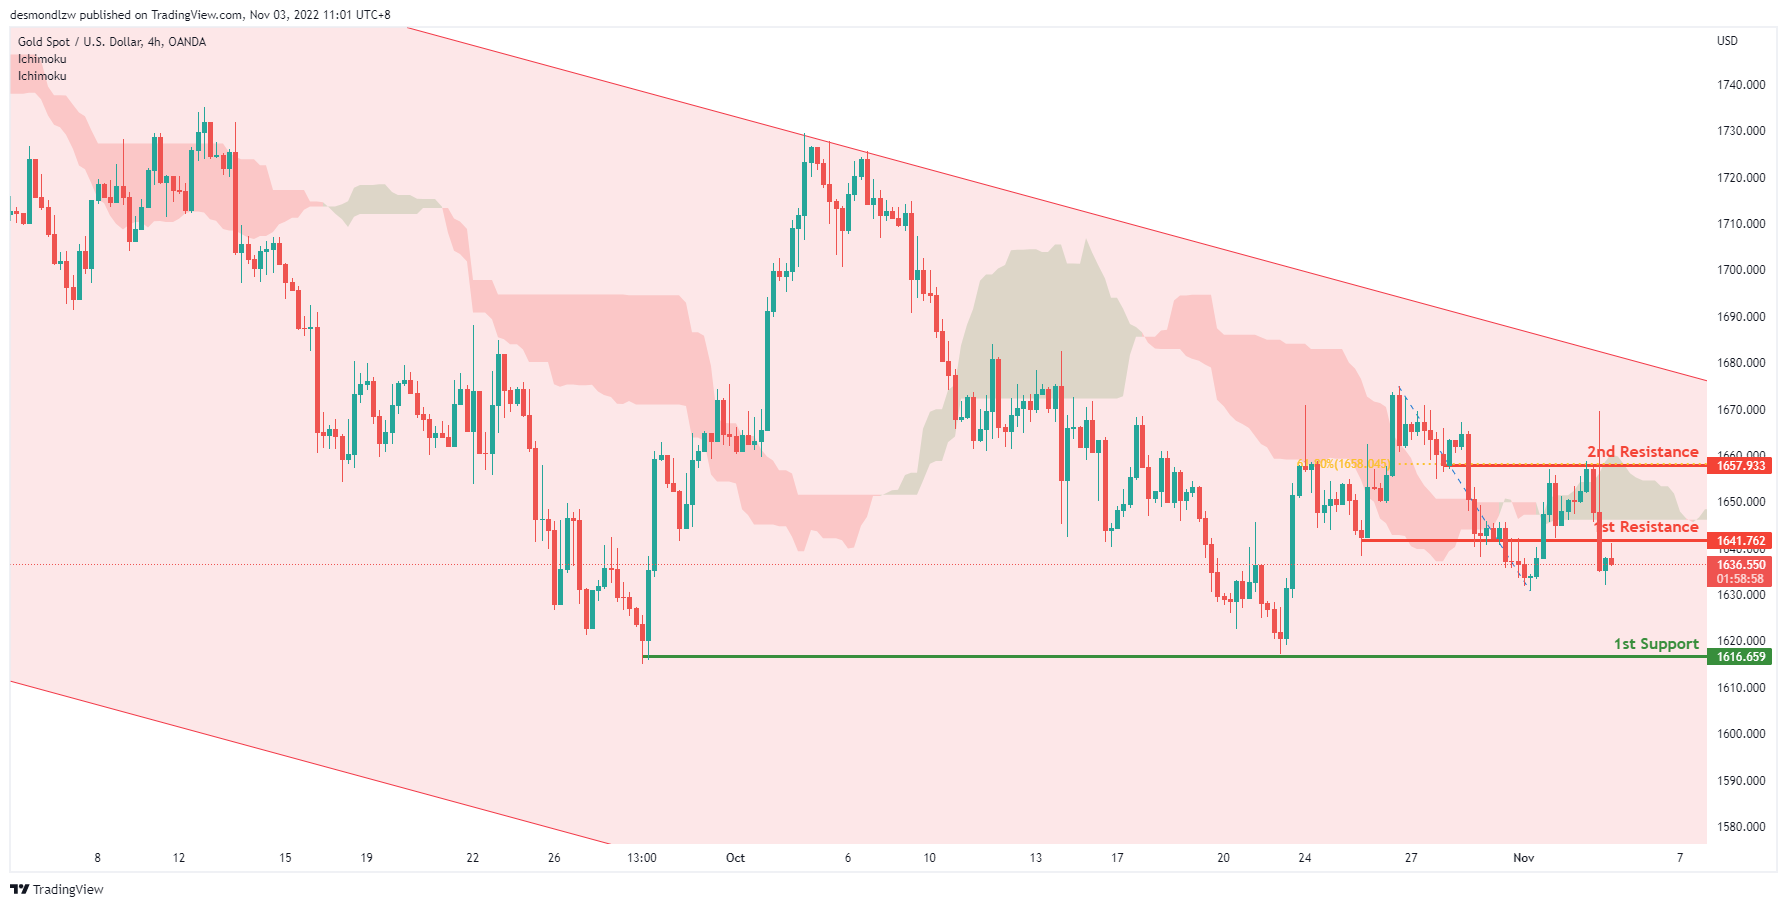
XAU/USD (GOLD):
On H4, with the price within the descending channel and crossing ichimoku cloud, we have a bearish bias that the price may drop from the 1st resistance at 1641.762, which is in line with the previous swing low to the 1st support at 1616.659, where the previous swing lows are. Alternatively, the price may rise to retest the 1st resistance and rise to the 2nd resistance is at 1657.331, where the previous swing high and 61.8% fibonacci retracement are.
Areas of consideration:
- H4 time frame, 1st resistance at 1641.762
- H4 time frame, 1st support at 1616.659
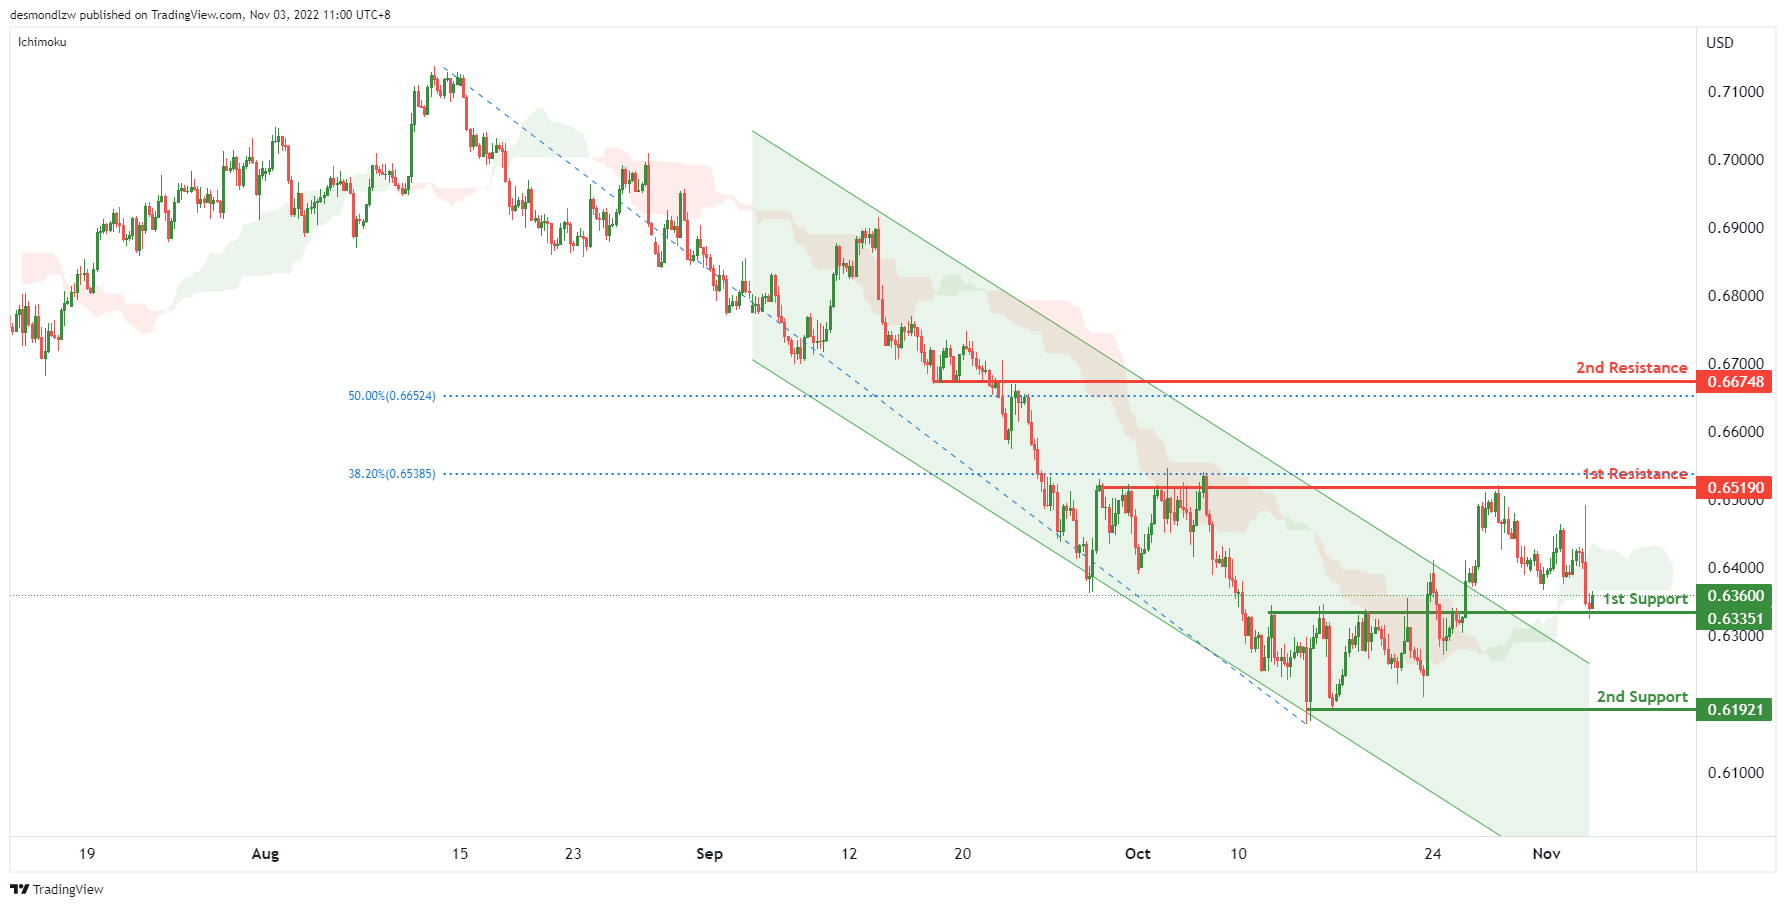
AUD/USD:
On the H4, with the price crossing the ichimoku cloud and testing the 1st support, we can expect the price break the 1st support and then drop to the 2nd support at 0.61921, which is in line with the swing low. Alternatively, the price may rise to the 1st resistance at 0.65190, which is in line with the overlap resistance and 38.2% fibonacci retracement. If the 1st resistance is broken, the 2nd resistance is at 0.66748, where the 50% fibonacci retracement is.
Areas of consideration
- H4, 1st support at 0.63351
- H4, 2nd support at 0.61921
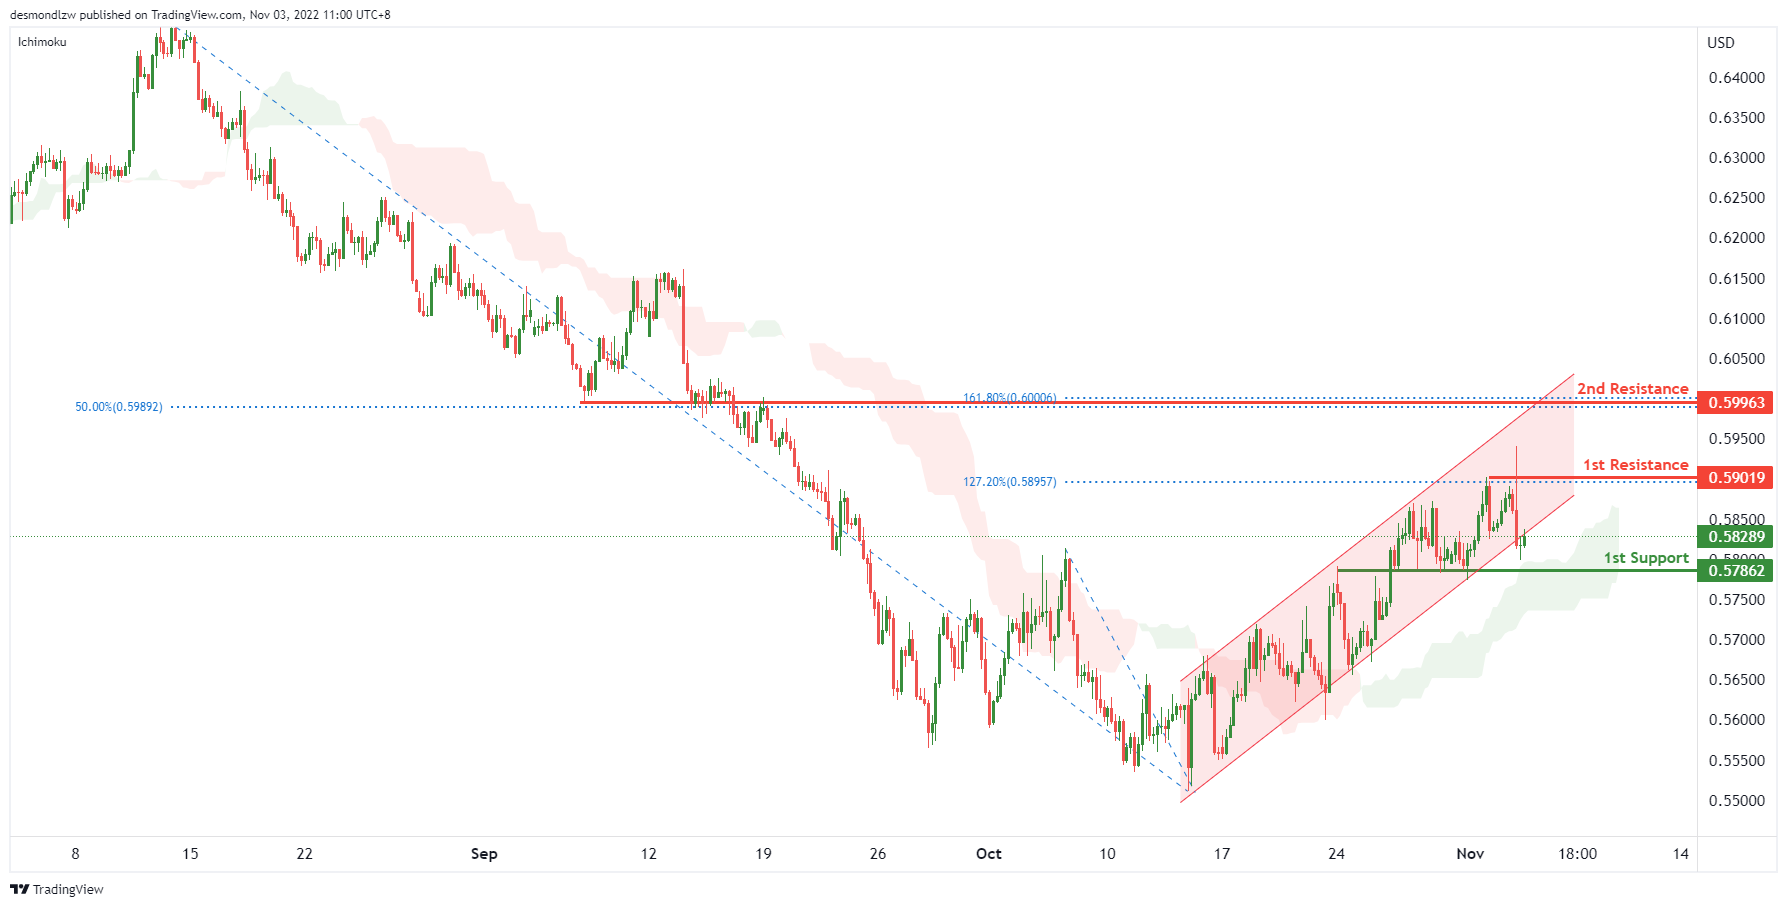
NZD/USD:
On the H4 chart, as the price is breaking the ascending channel, we have a bearish bias that the price may drop to the 1st support at 0.57862, which is in line with the overlap support. Alternatively, the price may rise to the 1st resistance at 0.59019, where the previous swing high and 127.2% fibonacci extension are. If the 1st resistance is broken, the 2nd resistance is at 0.59963, where the 50% fibonacci retracement and 161.8% fibonacci extension are
Areas of consideration:
- H4 time frame, 1st support at 0.57862
- H4 time frame, 1st resistance at 0.59019
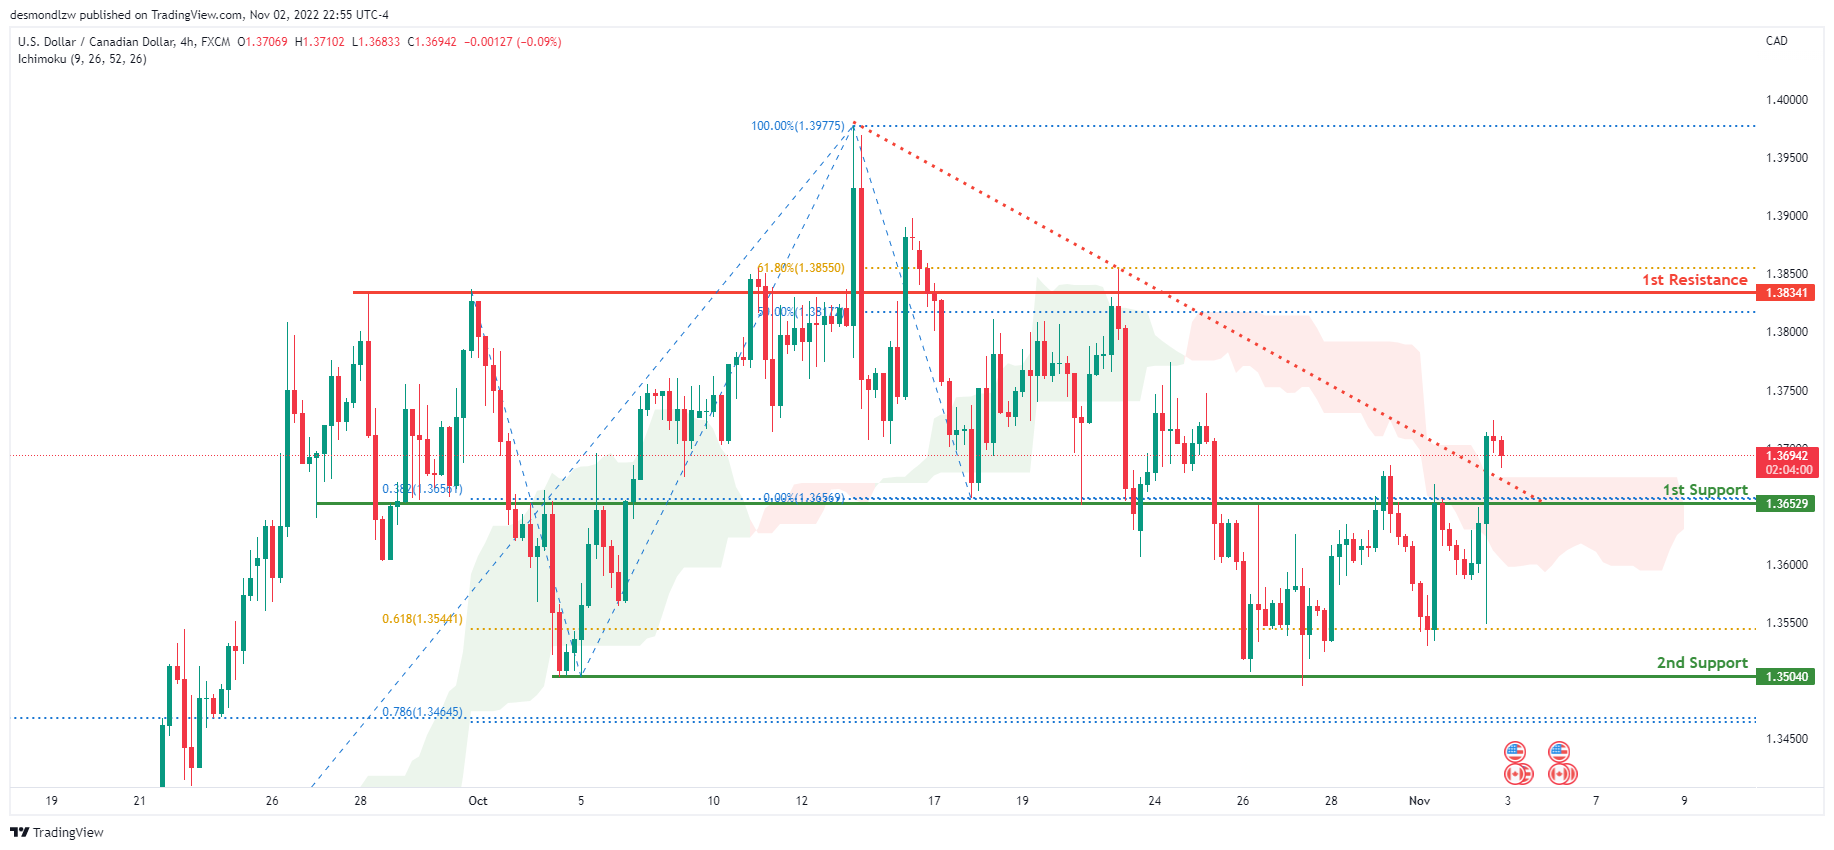
USD/CAD:
On the H4 chart, the overall bias for USDCAD is bullish. To add confluence to this, the price is above the Ichimoku cloud which indicates a bullish market. Overnight, price had increased volatility due to the release of the FOMC news, with price closing above the 1st support at 1.36529 where the 0% Fibonacci line and 38.2% Fibonacci projection line is located. If this bullish momentum continues, expect price to possibly head towards the 1st resistance line at 1.38341 where the 61.8% and 50% Fibonacci lines are located.
Areas of consideration:
- H4 time frame, 1st resistance at 1.38341
- H4 time frame, 1st support at 1.36529
- H4 time frame, 2nd support at 1.35040
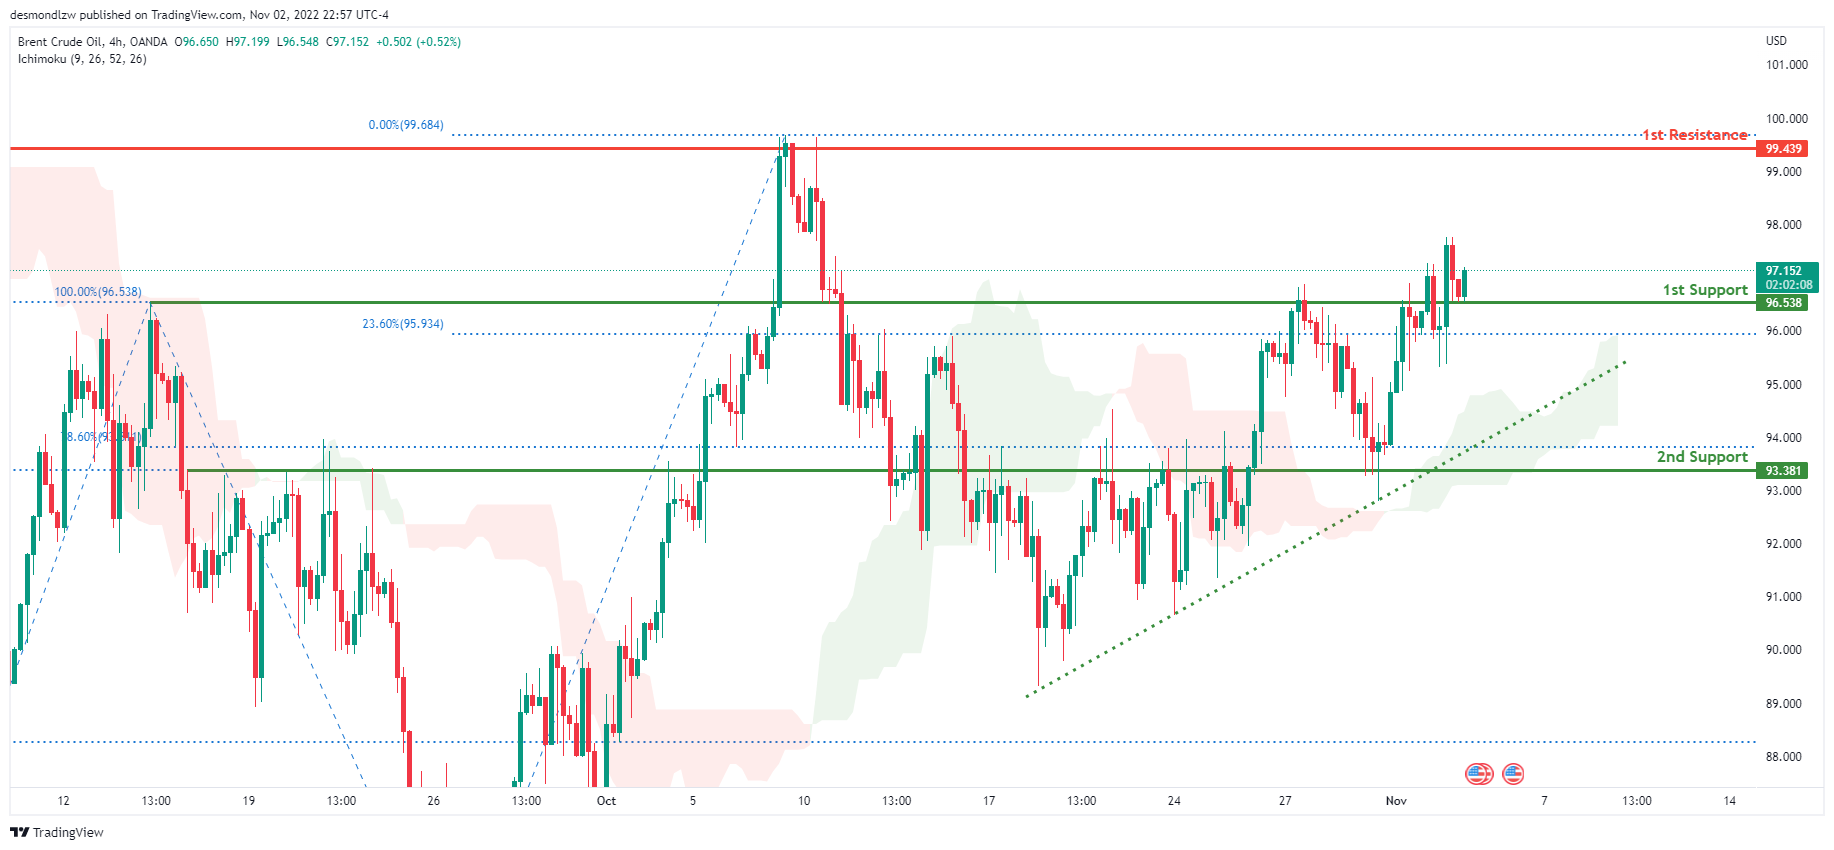
OIL:
Looking at the H4 chart, the current overall bias for Oil is bullish. To add confluence to this, the price is above the Ichimoku cloud which indicates a bullish market. Overnight, price continued to consolidate along the 1st support line at 96.538 where the 100% and 23.6% Fibonacci lines are located. If this bullish momentum continues, expect price to possibly head towards the 1st resistance at 99.439 where previous swing high and 0% Fibonacci line is located.
Areas of consideration:
- H4 time frame, 1st resistance at 99.439
- H4 time frame, 1st support at 96.538
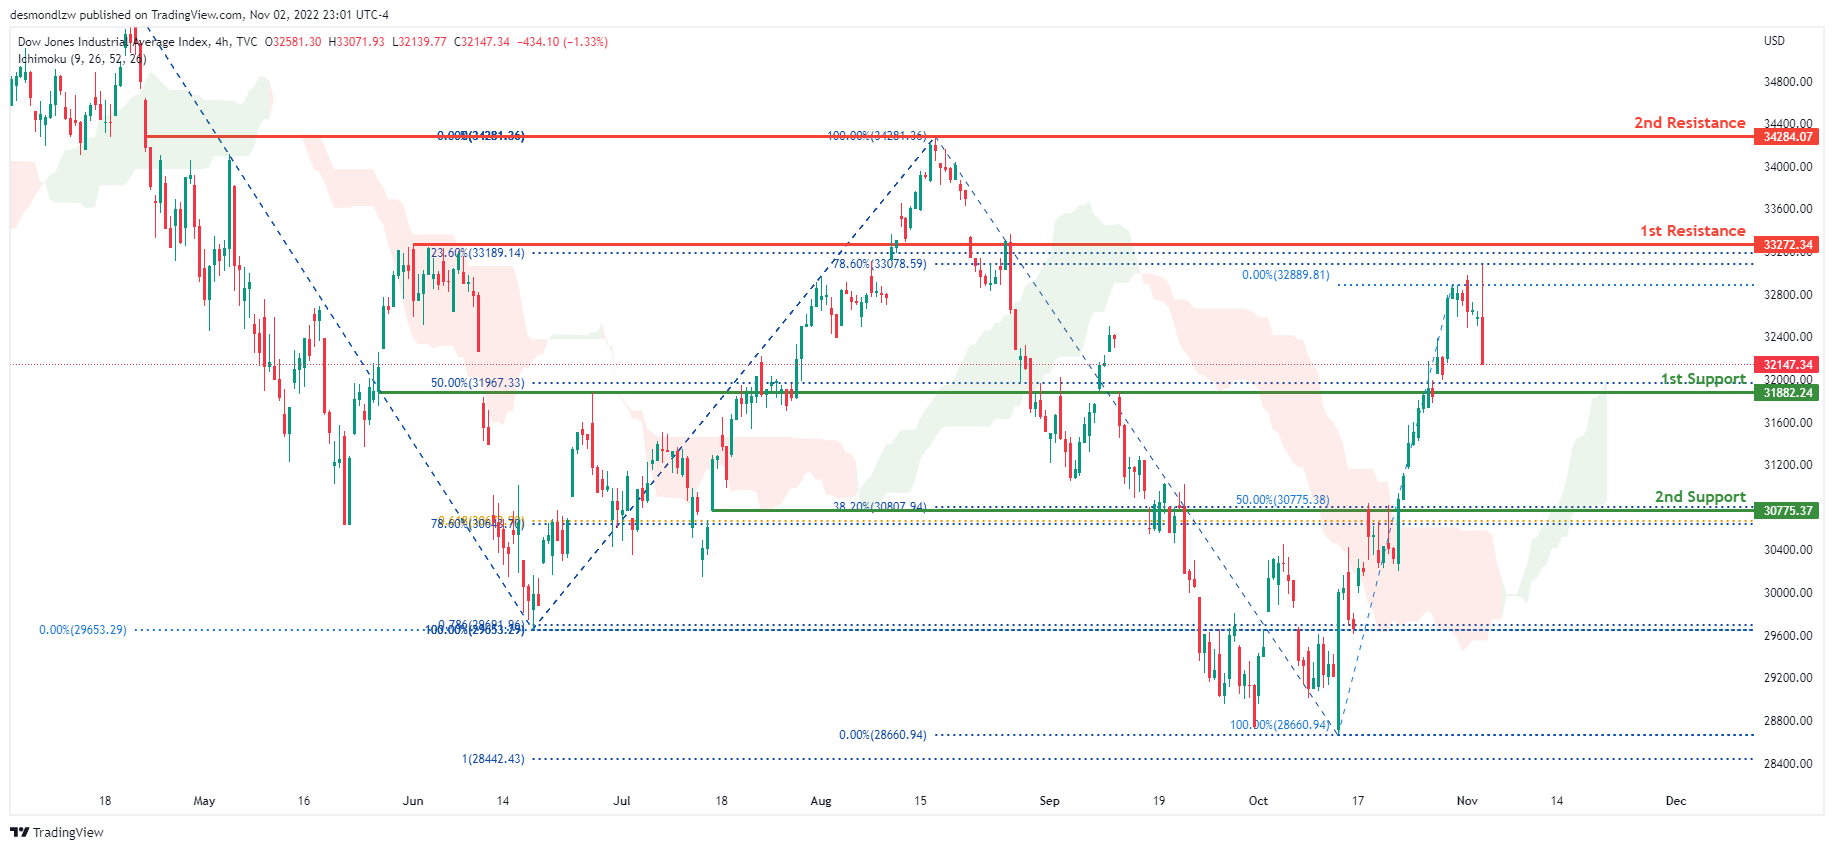
Dow Jones Industrial Average:
On the H4 chart, the overall bias for DJI is bullish. To add confluence to this, the price is above the Ichimoku cloud which indicates a bullish market. Overnight, had some bearish momentum downwards with the price currently trading at 32147.34 at time of writing. If this bullish momentum continues, expect the price to possibly head towards the 1st resistance at 33272.34 where the 23.6% and 78.6% Fibonacci lines are located.
Areas of consideration:
- H4 time frame, 1st support at 31882.24
- H4 time frame, 1st Resistance at 33272.34
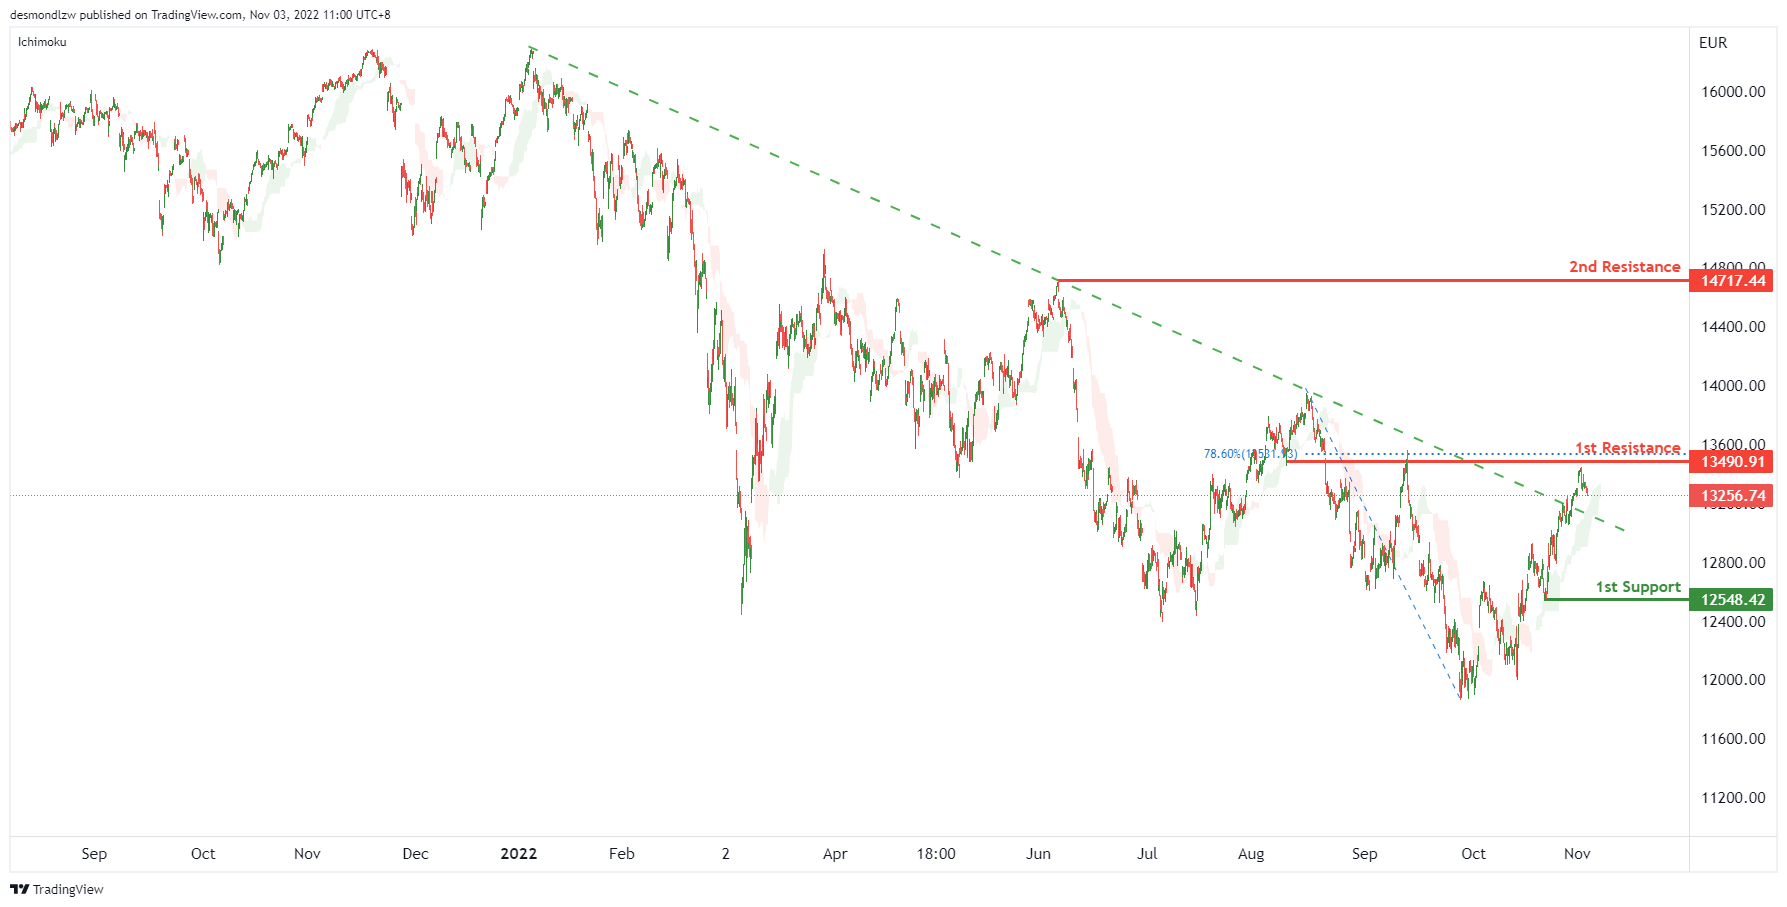
DAX:
On the H4 chart, the price has now closed above the Ichimoku cloud which indicates a breakout of a descending trendline. Expecting price to possibly continue this bullish momentum and head towards the 1st resistance at 13490.91, where the 78.6% Fibonacci line is located. If the 1st resistance is broken, the 2nd resistance could be at 14717.44, which is in line with the previous swing high. Alternatively, the price may drop to the 1st support at 12548.42, which is in line with the swing low.
Areas of consideration:
- H4 time frame, 1st resistance at 13490.91
- H4 time frame, 2nd resistance at 14717.44
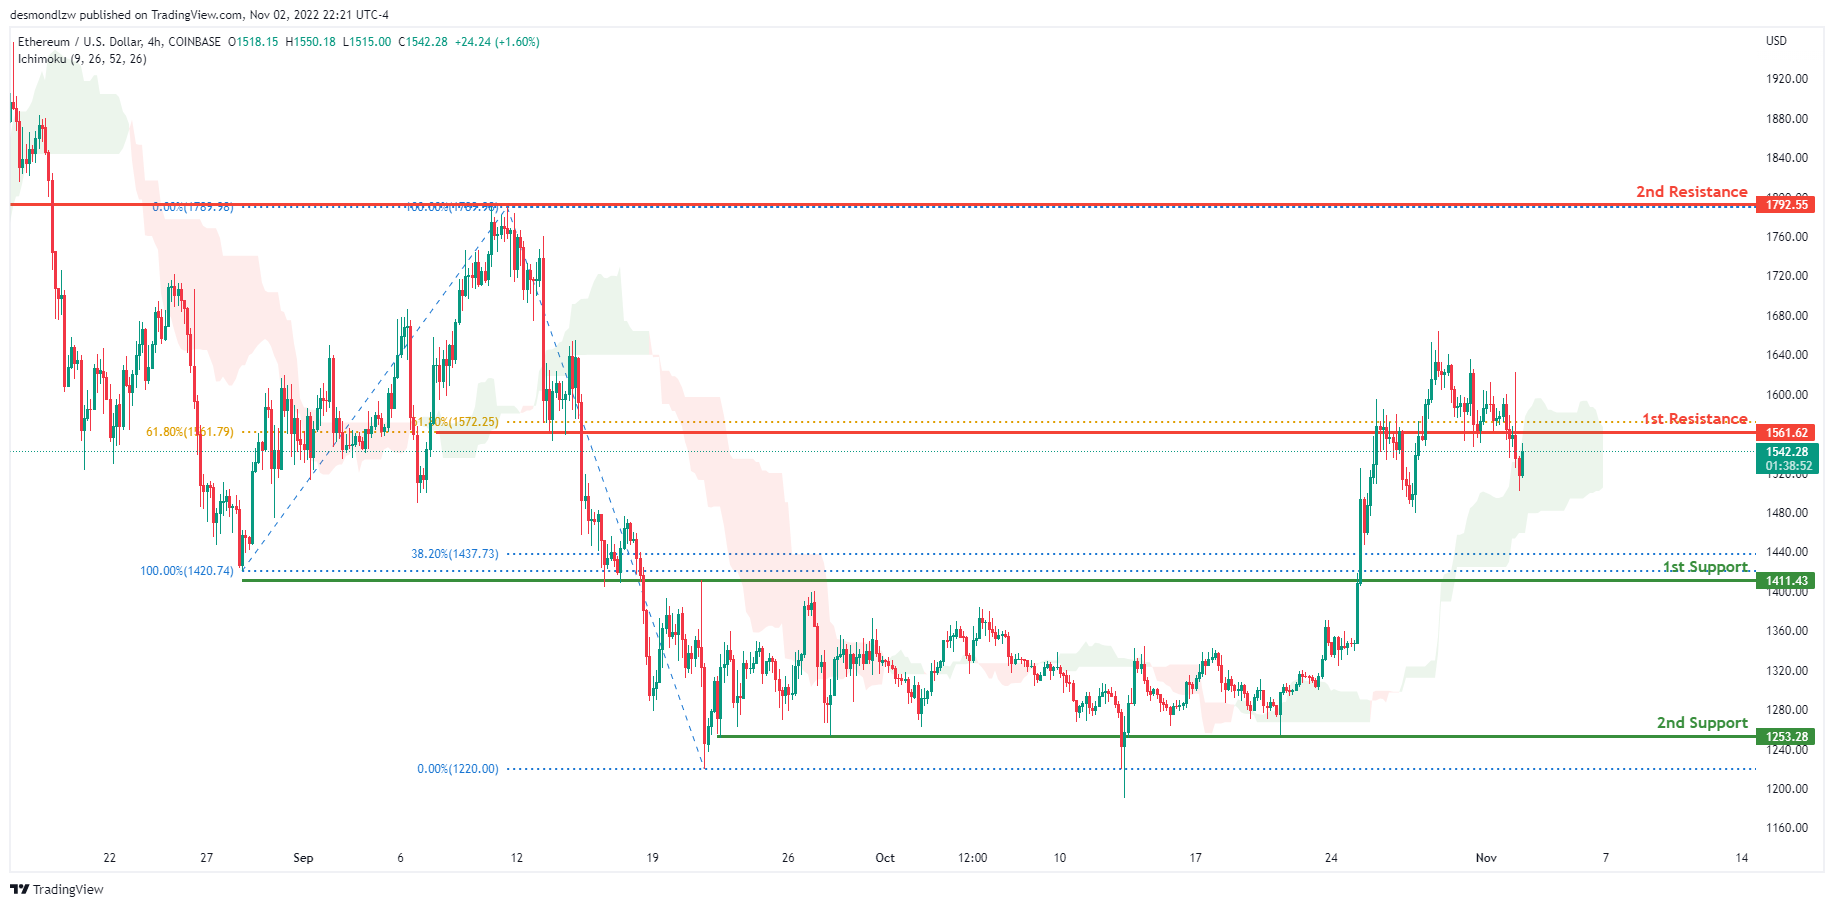
ETHUSD:
Looking at the H4 chart, the current overall bias for ETHUSD is bullish. Overnight, price experienced increased volatility due to the release of the FOMC news with price closing under the 1st resistance level at 1561.62 where 2 of the 61.8% Fibonacci lines are located. Expecting price to possibly retrace back up and retest the 1st resistance level.
Areas of consideration:
- H4 time frame, 1st resistance of 1561.62
- H4 time frame, 1st support at 1411.43
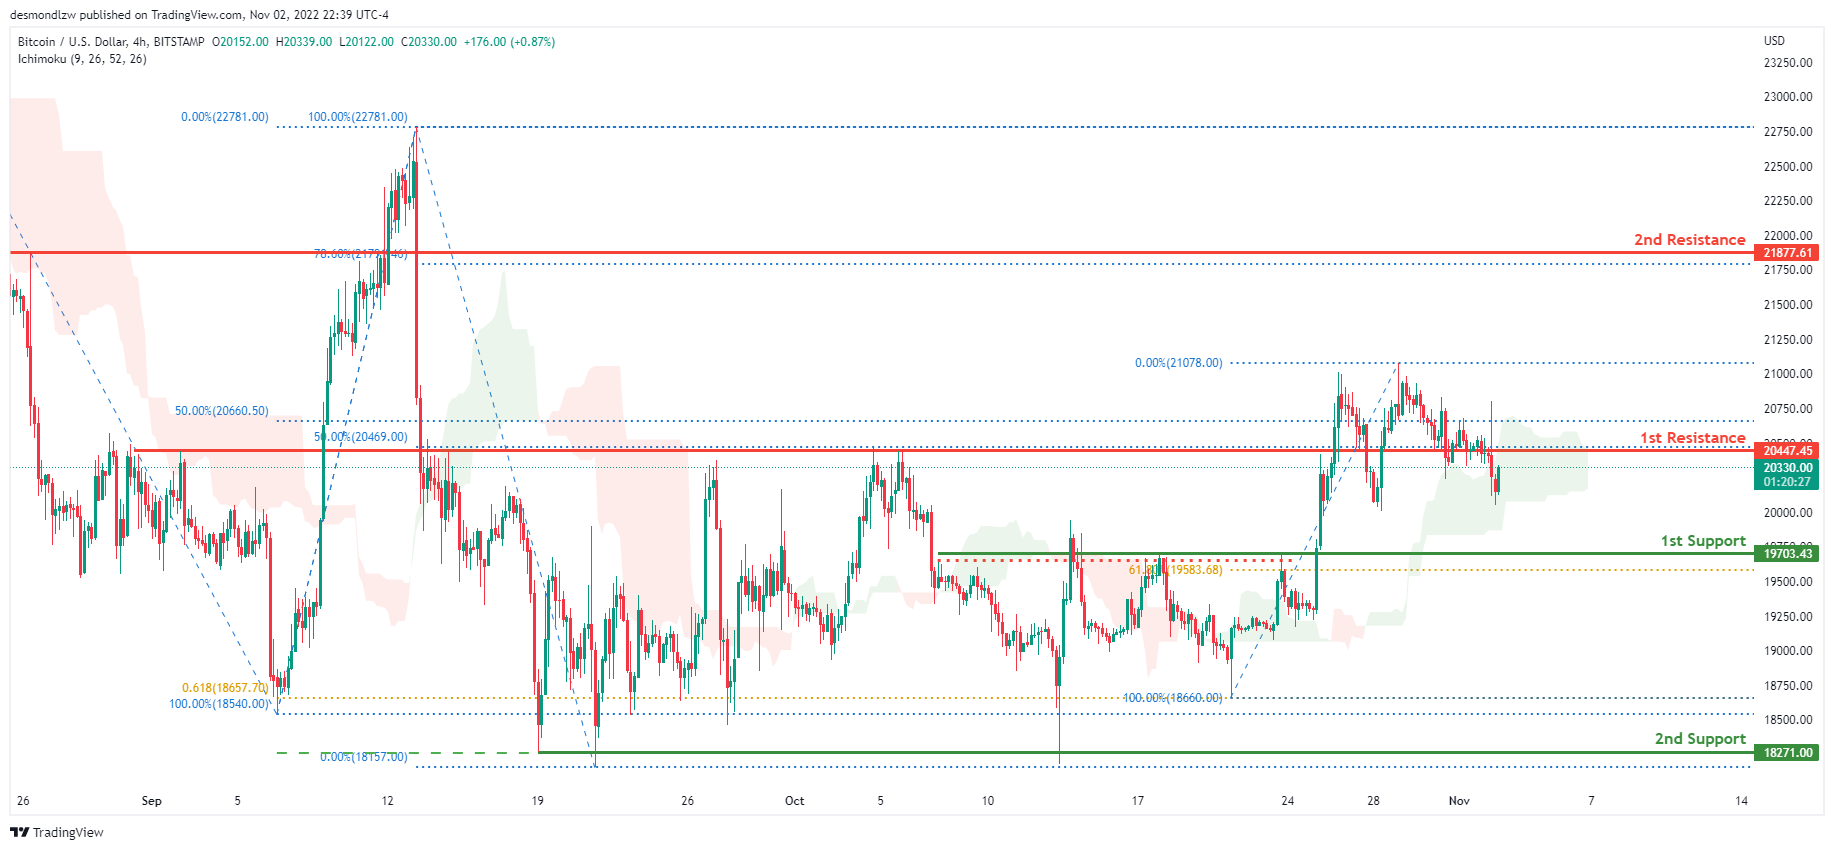
BTCUSD:
On the H4 chart, the overall bias for BTCUSD is bullish. Overnight, price experienced increased volatility due to the release of the FOMC news with the price closing under the 1st support at 20440.00 where the 2 of the 50% Fibonacci lines are located. Expecting price to possibly retrace back up to retest the 1st resistance level.
Areas of consideration:
- H4 time frame, 1st resistance 20447.45
- H4 time frame, 1st support at 19703.43
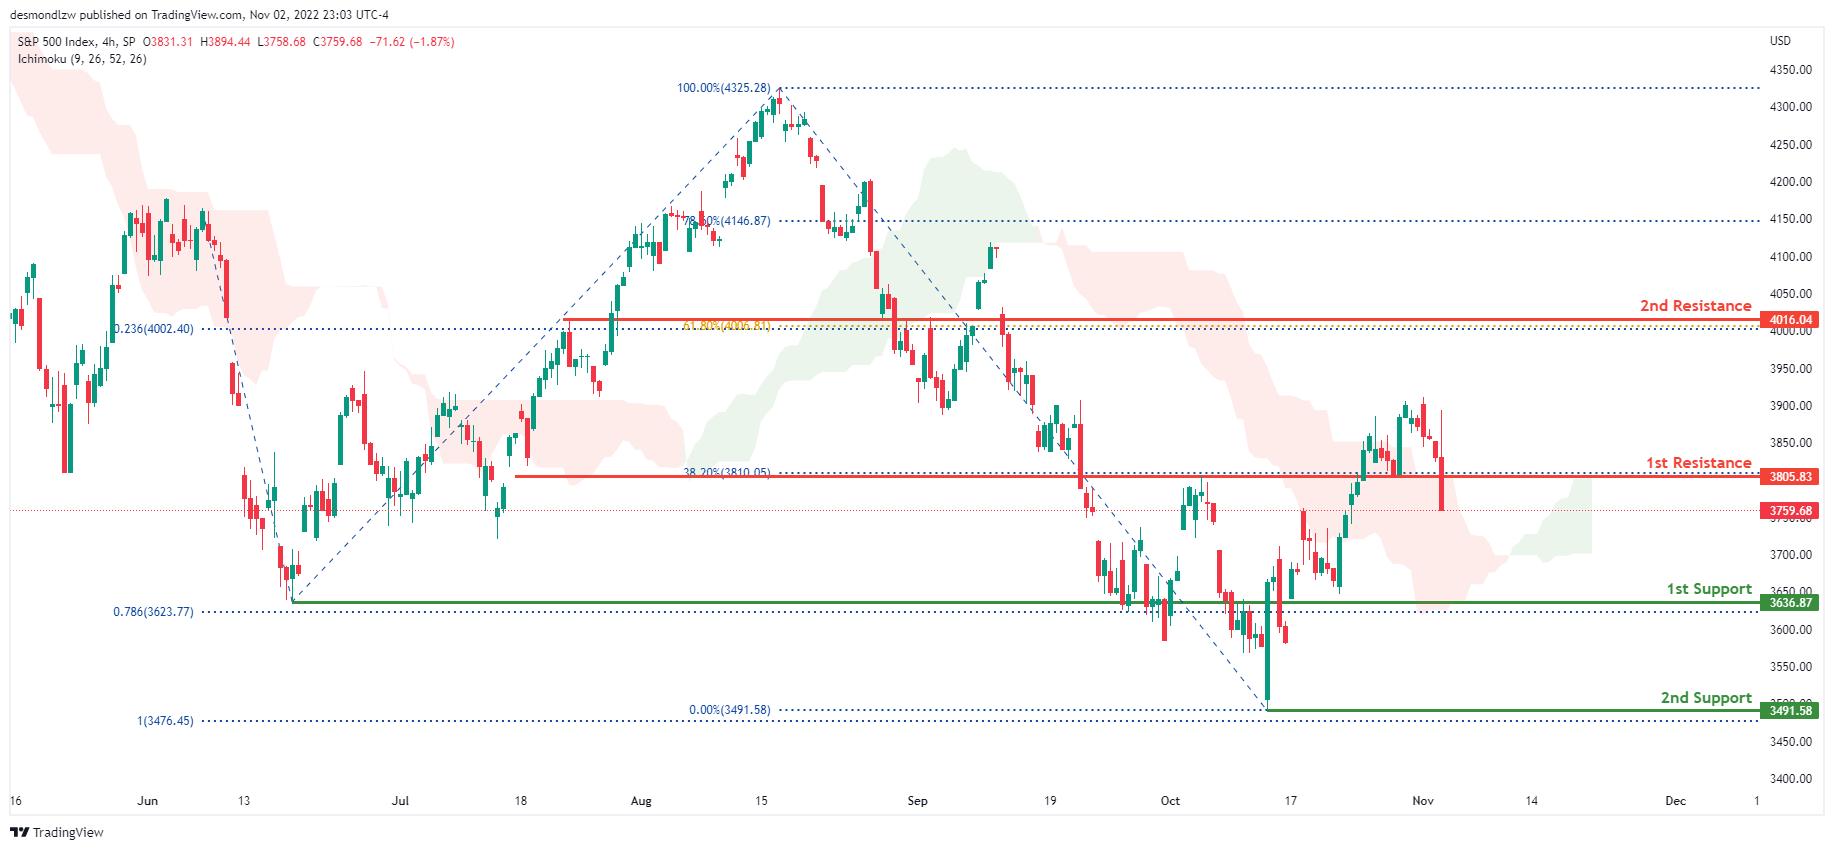
S&P 500:
On the H4 chart, the overall bias for S&P500 is bearish . Overnight, price had bearish momentum downwards with the release of the FOMC news with price closing under the 1st resistance at 3805.83 where the 38.2% Fibonacci line is located. The price is currently trading at 3759.68 at time of writing. If this bearish momentum continues, expect price to possibly head towards the 1st support at 3636.87 where the previous swing low and 78.6% Fibonacci projection line is located.
Areas of consideration:
- H4 time frame, 1st support at 3636.87
- H4 time frame, 1st resistance at 3805.83
The accuracy, completeness and timeliness of the information contained on this site cannot be guaranteed. IC Markets does not warranty, guarantee or make any representations, or assume any liability regarding financial results based on the use of the information in the site.
News, views, opinions, recommendations and other information obtained from sources outside of www.icmarkets.com.au, used in this site are believed to be reliable, but we cannot guarantee their accuracy or completeness. All such information is subject to change at any time without notice. IC Markets assumes no responsibility for the content of any linked site.
The fact that such links may exist does not indicate approval or endorsement of any material contained on any linked site. IC Markets is not liable for any harm caused by the transmission, through accessing the services or information on this site, of a computer virus, or other computer code or programming device that might be used to access, delete, damage, disable, disrupt or otherwise impede in any manner, the operation of the site or of any user’s software, hardware, data or property.