
EUR/USD:
The US Federal Reserve kept rates unchanged at 1.50-1.75% on Wednesday, as expected. Regarding the FOMC statement, however, the central bank now characterizes inflation as ‘moved close’ to 2% (previously it was described as ‘continued to run below 2%’), and additionally, it added the word ‘symmetric’ with regards to its inflation target. Overall, the market’s reply was dovish which saw the EUR/USD attempt to reclaim the key figure 1.20 on the H4 timeframe.
Unable to breach 1.20 thanks to a nearby H4 resistance area seen at 1.2027-1.2059, the H4 candles concluded the day on a bearish note. As you can see, this brought a H4 demand area at 1.1929-1.1952 into play, which happens to be located just north of a daily support level at 1.1920. Another key thing to note on the H4 timeframe is the clear oversold/divergence readings being seen on the H4 RSI indicator.
Longer term, we can also see weekly price slightly dipping beneath the 2018 yearly opening level at 1.2004, placing weekly demand at 1.1717-1.1862 in the spotlight.
Potential trading zones:
The current H4 demand, although currently holding price action higher, has ‘fakeout’ written all over it. The daily support lurking just beneath it at 1.1920 provides an ideal platform to wipe out traders that bought from this area, and also trap breakout sellers. Therefore, all eyes will be on the 1920ish region today for an intraday bounce to the upside. Why only a bounce? Well, let’s not forget that the euro is entrenched within a strong bout of selling right now, and weekly action shows that the unit could potentially drop as far south as weekly demand mentioned above at 1.1717-1.1862. So further selling, overall, is likely to be seen. We’re just simply looking to take advantage of a high-probability pullback within the overall movement.
Data points to consider today: EUR CPI flash estimate y/y; US unemployment claims; US ISM non-manufacturing PMI.

GBP/USD:
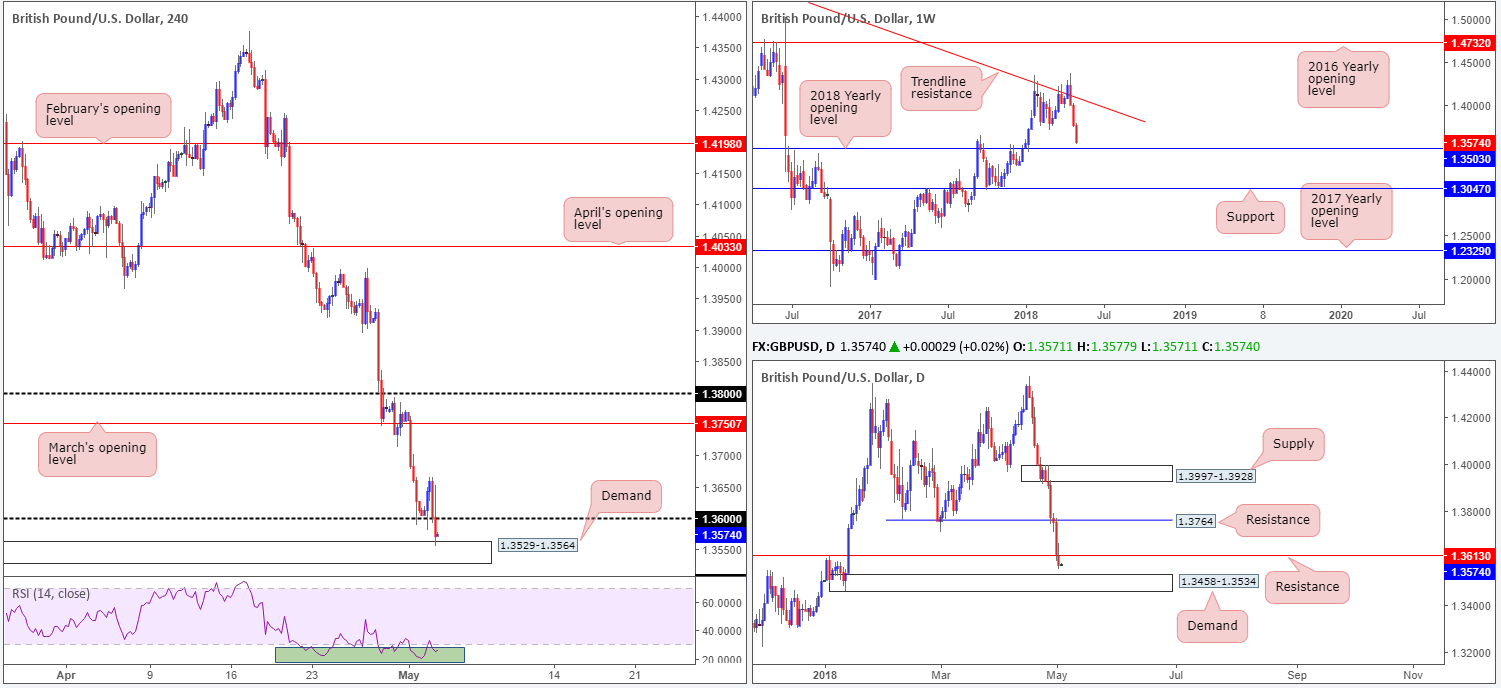
April’s upbeat UK construction data was clearly not enough to rescue a withered GBP on Wednesday, despite an earnest attempt to push beyond 1.3650s from 1.36. As you can see, cable traded sub 1.36 pre-Fed after the buck was bought in early US trade and extended losses in late trade post-Fed as the USD climbed higher. Focus is now on the H4 demand base coming in at 1.3529-1.3564. What’s interesting about this H4 demand base is that it is glued to the top edge of a daily demand area at 1.3458-1.3534, which itself houses the 2018 yearly opening level at 1.3503 on the weekly chart. Beyond the H4 demand base, however, the team has noted to keep eyes on the 1.35 handle, shadowed closely by a H4 Quasimodo support at 1.3482.
Potential trading zones:
The GBP/USD is in an interesting position right now. Sentiment clearly favors further downside. However, the current H4 demand and its surrounding confluence noted above, is going to be a hard floor to break through, in our opinion. Therefore, we should see some form of correction take shape soon. The psychological number, along with the aforementioned H4 Quasimodo support area, is likely to hold for at least an intraday correction to the upside. One could even look to place stops below the lower edge of the current daily demand at a distance of 25 or so pips. It will be interesting to see how this pans out over the next few days.
Data points to consider today: UK services PMI; US unemployment claims; US ISM non-manufacturing PMI.
AUD/USD:
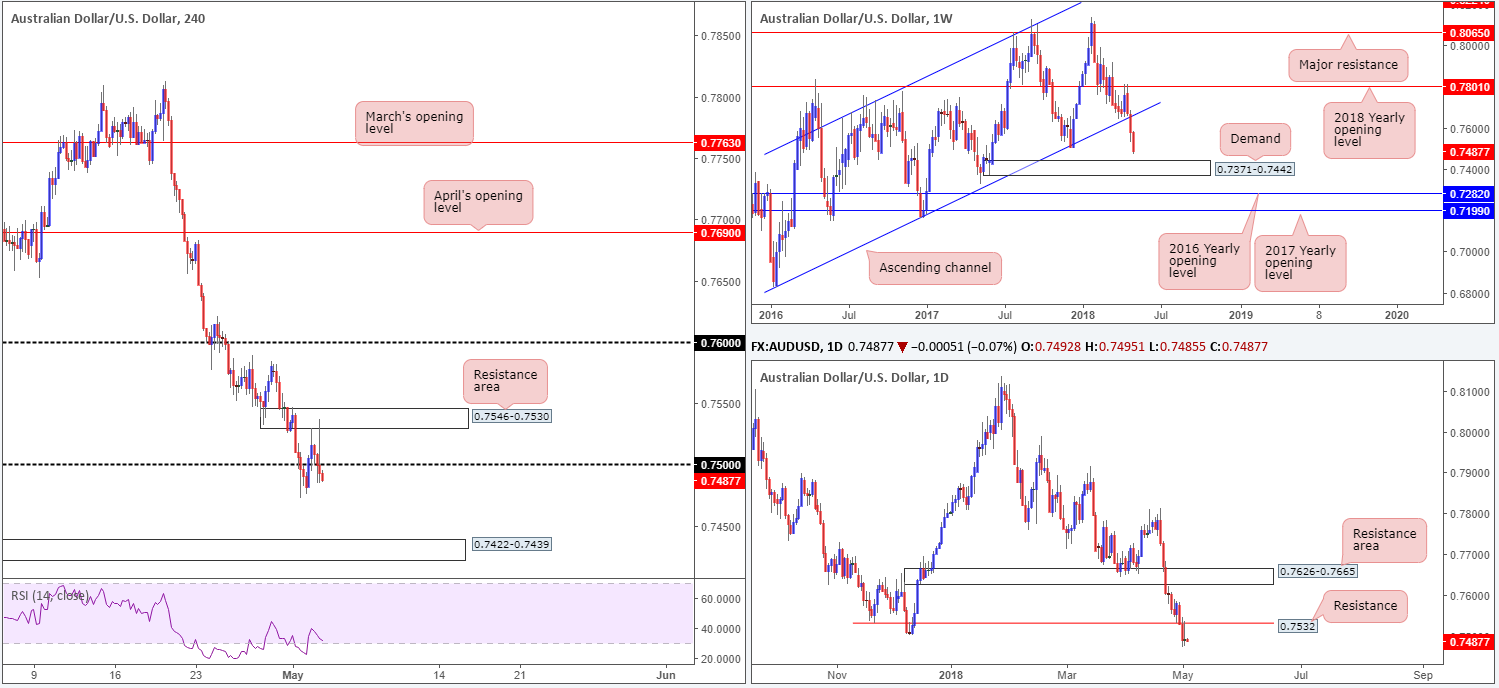
Bullish momentum above 0.75 was limited yesterday by a local H4 resistance area at 0.7546-0.7530 as well as a daily resistance level planted at 0.7532, consequently ending the day pretty much unchanged. Overall, the pair had a relatively rough ride, advancing to a session high of 0.7537 before collapsing back underneath the weight of the USD, which surged higher after stooping in response to the latest FOMC movements.
With 0.75 likely to hold as resistance going forward, along with daily price showing room to push as far south as a daily demand base located at 0.7371-0.7429 (not seen on the screen) and weekly action now eyeing weekly demand lower down at 0.7371-0.7442 (encapsulates the current daily demand), further downside could be on the cards.
Potential trading zones:
Following the mild pullback (a lower high) seen yesterday that closed beneath 0.75, the team is watching H4 price closely. A H4 full or near-full bodied bearish candle formed at current price would, in our technical view, be a valid signal to consider selling, targeting a H4 demand at 0.7422-0.7439 (not seen on the screen) which has strong connections to the aforementioned higher-timeframe demands, thus making it a firm take-profit zone.
However, do remain aware that we have Aussie trade balance figures due to be released soon, which could potentially alter this technical reading.
Data points to consider today: AUD trade balance and building approvals m/m; US unemployment claims; US ISM non-manufacturing PMI.
USD/JPY:
The USD/JPY was somewhat subdued over the course of Wednesday’s sessions, consequently forming a clear-cut daily indecision candle.
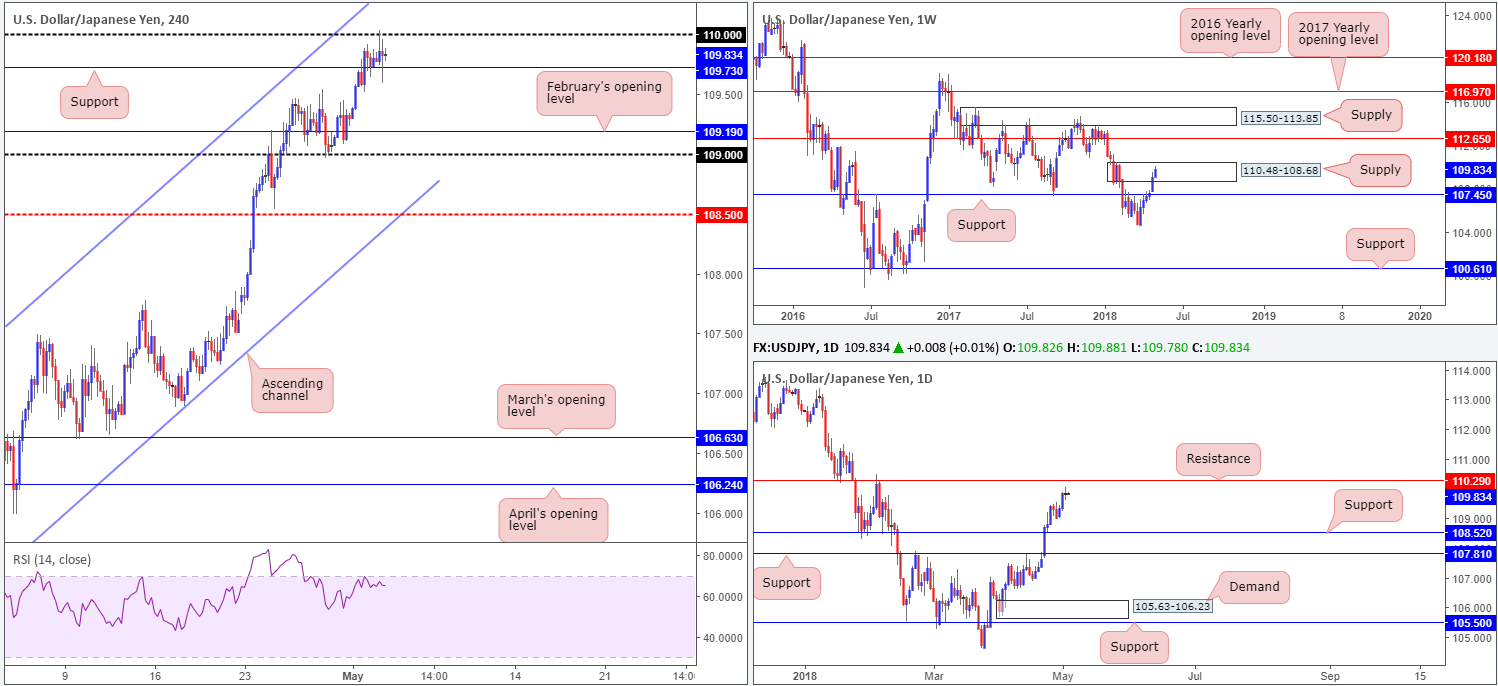
The pair immediately declined in value in response to the Fed’s latest movement, which saw the central bank leave interest rates unchanged. However, the move was a relatively short-lived one as USD bids re-entered the market and defended the H4 support level coming in at 109.73, with price now seen closing in for a second retest of nearby resistance at 110.
Given the lackluster performance seen yesterday, much of the following report will echo thoughts put forward in Wednesday’s analysis…
Weekly supply at 110.48-108.68 remains intact, despite recent buying. A breach of this area could attract further upside towards the 2018 yearly opening level at 112.65. Meanwhile, down on the daily timeframe we do not see much stopping the unit from climbing higher in the near term until we collide with daily resistance plotted at 110.29.
Potential trading zones:
The momentum behind this market at the moment remains strong. Therefore, selling into this directional flow is chancy despite all three of the above noted timeframes highlighting resistance either in play or positioned nearby.
With that in mind, traders have a choice: either pass on this market, or attempt to trade in-line with sentiment.
Intraday, longs from H4 support could still be an option at 109.73. Yes, there is potential for resistance to form from 110 here! We see this. The idea, however, is that momentum will eventually break 110 and lead us to daily resistance at 110.29, which is an ideal location to think about taking partial profits. Ideally, though, we’d recommend reducing risk to breakeven upon closing above 110 (H4).
Data points to consider today: US unemployment claims; US ISM non-manufacturing PMI; Japanese banks are closed in observance of Constitution Day.
USD/CAD:
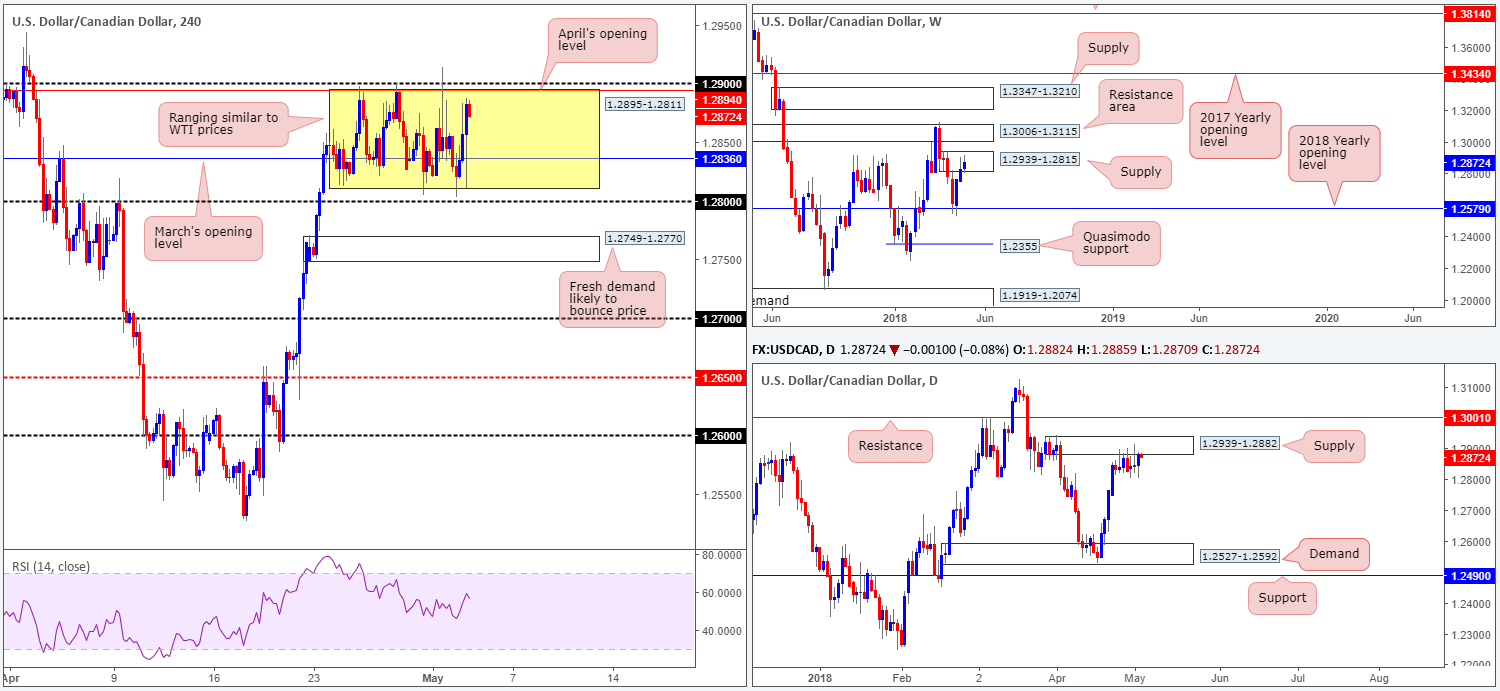
Despite seeing a bearish response from the FOMC’s latest interaction, the H4 candles, in similar fashion to WTI prices, continue to range between 1.2895/1.2811 (within the area is March’s opening level seen at 1.2836).
As highlighted in previous writings, the team is still biased to the downside in spite of the ranging structure we’re seeing at the moment. This is largely due to where price is positioned on the bigger picture. Weekly action is seen trading from within the boundaries of a weekly supply at 1.2939-1.2815, following a stronger-than-expected rebound off the 2018 yearly opening level at 1.2579 two weeks ago. In conjunction with weekly flow, daily price recently crossed swords with a daily supply zone at 1.2939-1.2882 and has held ground since March 25.
Potential trading zones:
A break of 1.28 would likely spark a round of selling. However, the fresh H4 demand based just beneath it at 1.2749-1.2770 is highly likely to bounce price. With that in mind, we would recommend waiting for the current H4 demand area to be engulfed (and preferably retested as resistance) before considering short positions. Although the next downside target is relatively close from an intraday perspective: 1.27, we feel it is still a trade worthy of attention given that the next support target on the bigger picture does not come into view until daily demand at 1.2527-1.2592!
Data points to consider today: US unemployment claims; US ISM non-manufacturing PMI; CAD trade balance.
USD/CHF:
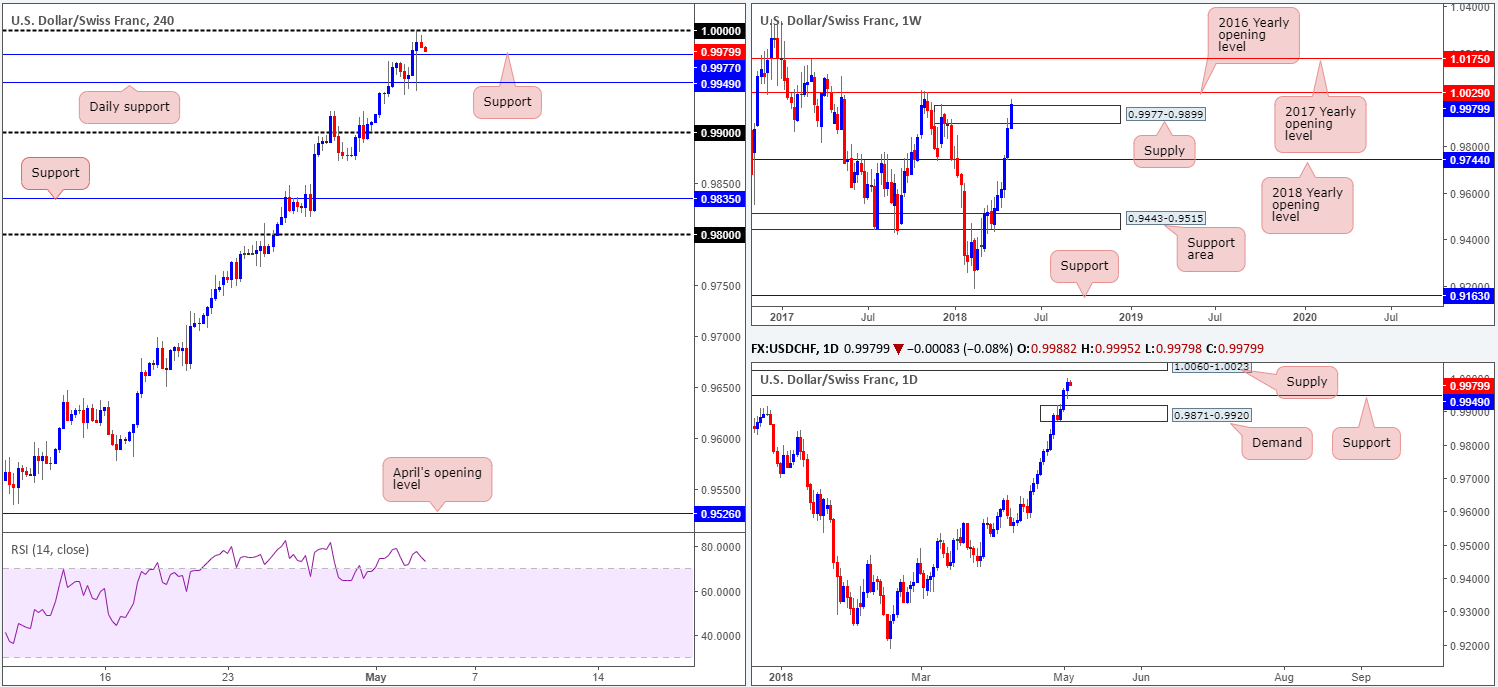
In recent sessions, we saw the USD/CHF retest a recently broken daily resistance as support at 0.9949 – take out H4 resistance at 0.9977 –and test parity (1.0000). As is shown on the H4 timeframe, parity is holding firm at the moment which will likely force a retest of 0.9977 as support in the next hour or so.
Over on the weekly timeframe, recent upside breached the topside of a weekly supply zone at 0.9977-0.9899, likely triggering sellers’ stops and filling breakout buyers’ orders. The next objective beyond this area can be seen at 1.0029: the 2016 yearly opening level. Meanwhile, daily action shows room to pop higher until we shake hands with daily supply positioned at 1.0060-1.0023. However, according to this scale, a pullback to retest the daily support could be seen before we reach the next upside objective.
Potential trading zones:
In short, here’s what we have noted so far:
- Weekly stops tripped above supply – potential upside likely.
- Daily action shows room to drive higher and test supply.
- H4 price will likely test H4 support. A close below here will likely provide an early cue that we are heading for a retest of daily support.
With the above in mind, the team has noted to keep tabs on the daily support for potential long plays today, with an overall take-profit target set at 1.0060-1.0023. Reducing risk to breakeven once/if the unit connects with parity is recommended, given the interest these large numbers attract.
Data points to consider today: US unemployment claims; US ISM non-manufacturing PMI; SNB Chairman Jordan speaks.
Dow Jones Industrial Average:
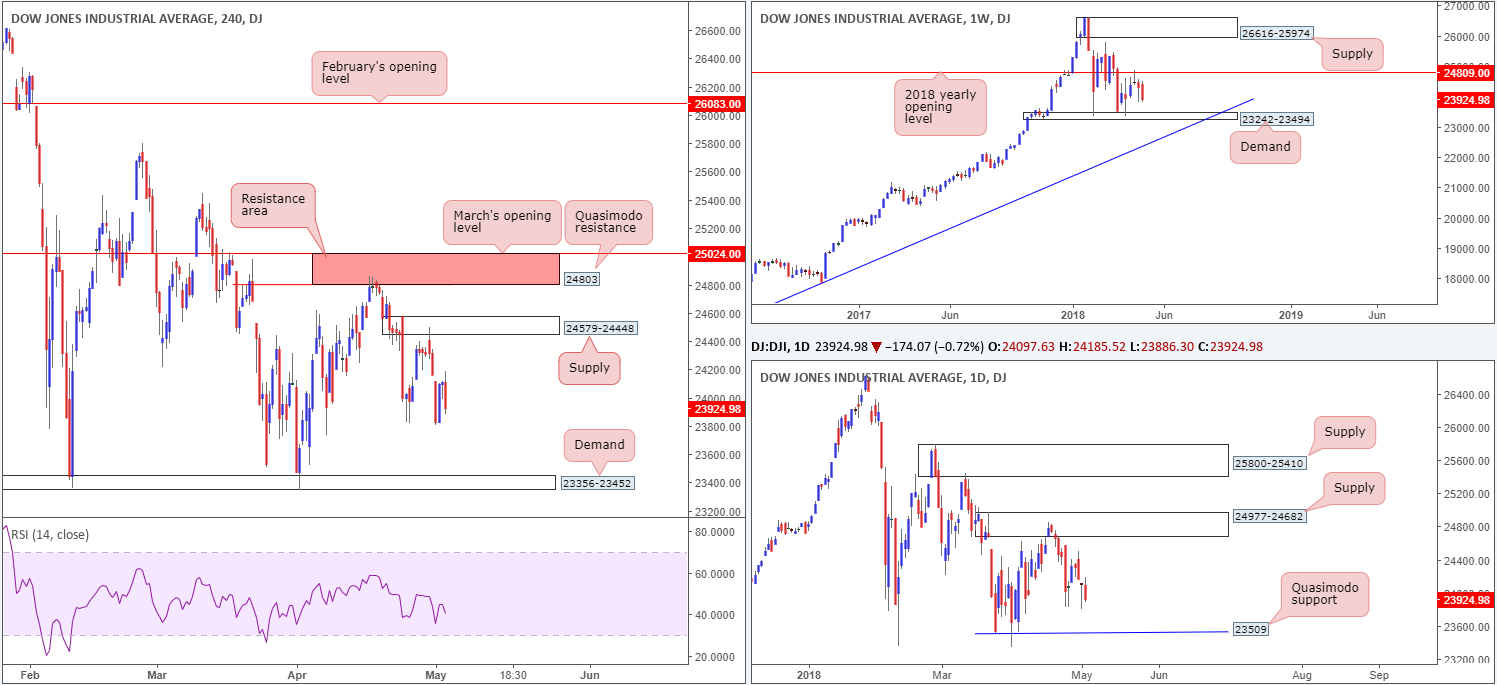
Earnings on Wednesday were dominated by Apple, coming in higher than expected. Despite this, the DJIA concluded the session on its back foot, down 0.72%.
Recent movement on the H4 timeframe formed a nice-looking bearish engulfing formation, which could lead to a move being seen down to H4 demand located at 23356-23452. Before reaching this zone, however, traders will have to contend with the possibility of a bounce materializing from a daily Quasimodo support at 23509. While the H4 candlestick signal has likely garnered the interest of candlestick enthusiasts, we do not see much in the shape of supporting resistance. Therefore, this could potentially be a fake sell signal.
Potential trading zones:
The H4 supply at 24579-24448 is an area to keep eyeballs on today, as is the H4 resistance area seen directly above it at 25024-24803. Comprised of March’s opening level and a H4 Quasimodo resistance this area is a high-probability reversal zone, since it also houses the 2018 yearly opening level seen on the weekly timeframe at 24809 and has connections to the daily supply zone at 24977-24682.
Personally we still favor the H4 resistance area at 25024-24803 and the H4 demand at 23356-23452, due to its relationship with higher-timeframe structure.
Data points to consider today: US unemployment claims; US ISM non-manufacturing PMI.
GOLD (XAU/USD SPOT):
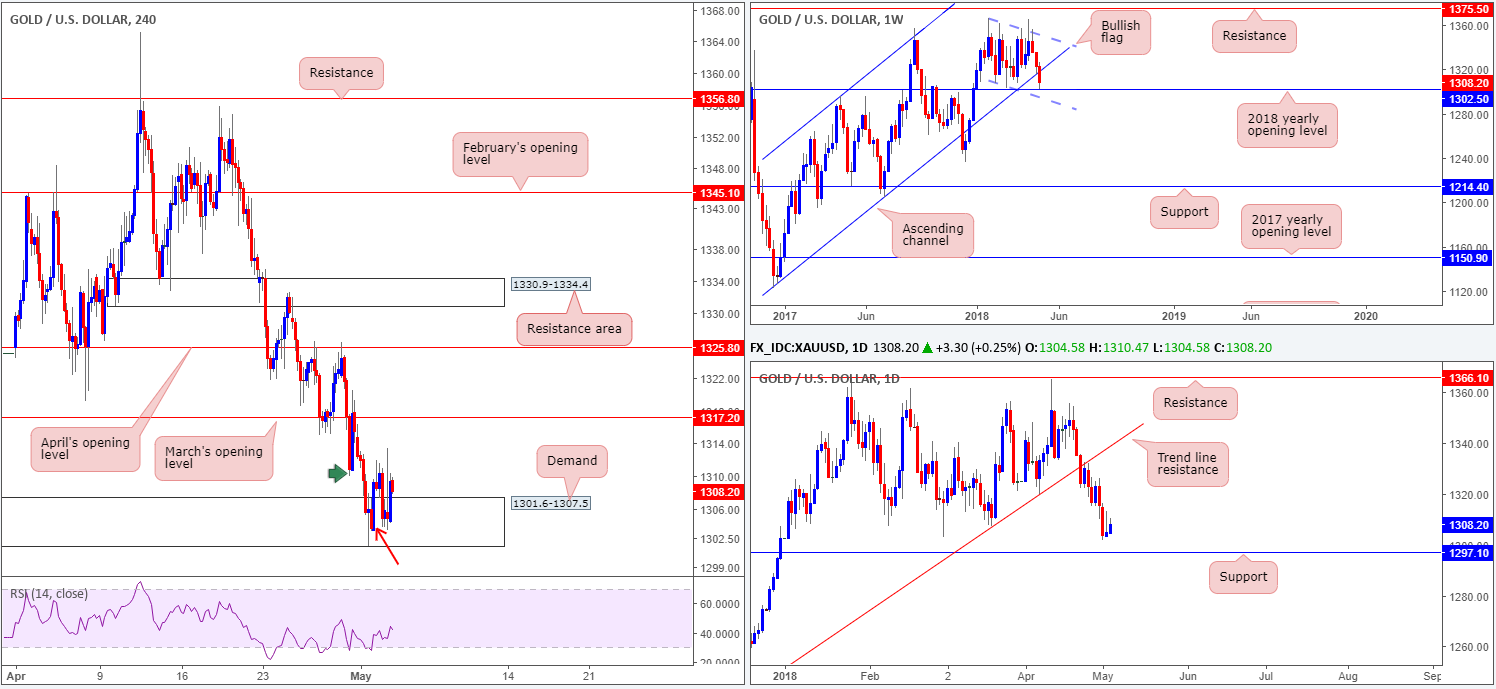
Kicking this morning’s report off with a quick look at the weekly timeframe communicates that bullion remains defensive off the 2018 yearly opening level plotted at 1302.5. And rightly so, this is a major level! On the daily timeframe, we can see that yesterday’s action formed an inverted pin-bar formation which is typically considered to be a bullish signal – even more so that we know it was shaped off of the 2018 yearly open level. Although upside seems the favored path at the moment, traders still have to take into account the possibility of further selling taking place since daily price shows room to potentially press to lower levels: daily support notched in at 1297.1.
The H4 demand area highlighted in yesterday’s report at 1301.6-1307.5 (which encapsulates the 2018 yearly opening level mentioned above on the weekly timeframe at 1302.5) remains firm, despite facing selling pressure from Monday’s swing low 1310.0 marked with a green arrow. Given the H4 bullish rotation candle printed from within the current H4 demand denoted by a red arrow, we still believe further buying could be on the horizon.
Potential trading zones:
For those that remain long after buying the H4 bullish rotation candle printed yesterday, holding this position until the yellow metal lifts north to test March’s opening level at 1317.2 is an option. Reducing risk to breakeven and taking partial profits at this point is recommended. Beyond 1317.2, the next port of call can be seen at April’s opening level drawn from 1325.8.
This site has been designed for informational and educational purposes only and does not constitute an offer to sell nor a solicitation of an offer to buy any products which may be referenced upon the site. The services and information provided through this site are for personal, non-commercial, educational use and display. IC Markets does not provide personal trading advice through this site and does not represent that the products or services discussed are suitable for any trader. Traders are advised not to rely on any information contained in the site in the process of making a fully informed decision.
This site may include market analysis. All ideas, opinions, and/or forecasts, expressed or implied herein, information, charts or examples contained in the lessons, are for informational and educational purposes only and should not be construed as a recommendation to invest, trade, and/or speculate in the markets. Any trades, and/or speculations made in light of the ideas, opinions, and/or forecasts, expressed or implied herein, are committed at your own risk, financial or otherwise.
The use of the site is agreement that the site is for informational and educational purposes only and does not constitute advice in any form in the furtherance of any trade or trading decisions.
The accuracy, completeness and timeliness of the information contained on this site cannot be guaranteed. IC Markets does not warranty, guarantee or make any representations, or assume any liability with regard to financial results based on the use of the information in the site.
News, views, opinions, recommendations and other information obtained from sources outside of www.icmarkets.com.au, used in this site are believed to be reliable, but we cannot guarantee their accuracy or completeness. All such information is subject to change at any time without notice. IC Markets assumes no responsibility for the content of any linked site. The fact that such links may exist does not indicate approval or endorsement of any material contained on any linked site.
IC Markets is not liable for any harm caused by the transmission, through accessing the services or information on this site, of a computer virus, or other computer code or programming device that might be used to access, delete, damage, disable, disrupt or otherwise impede in any manner, the operation of the site or of any user’s software, hardware, data or property.


