
EUR/USD:
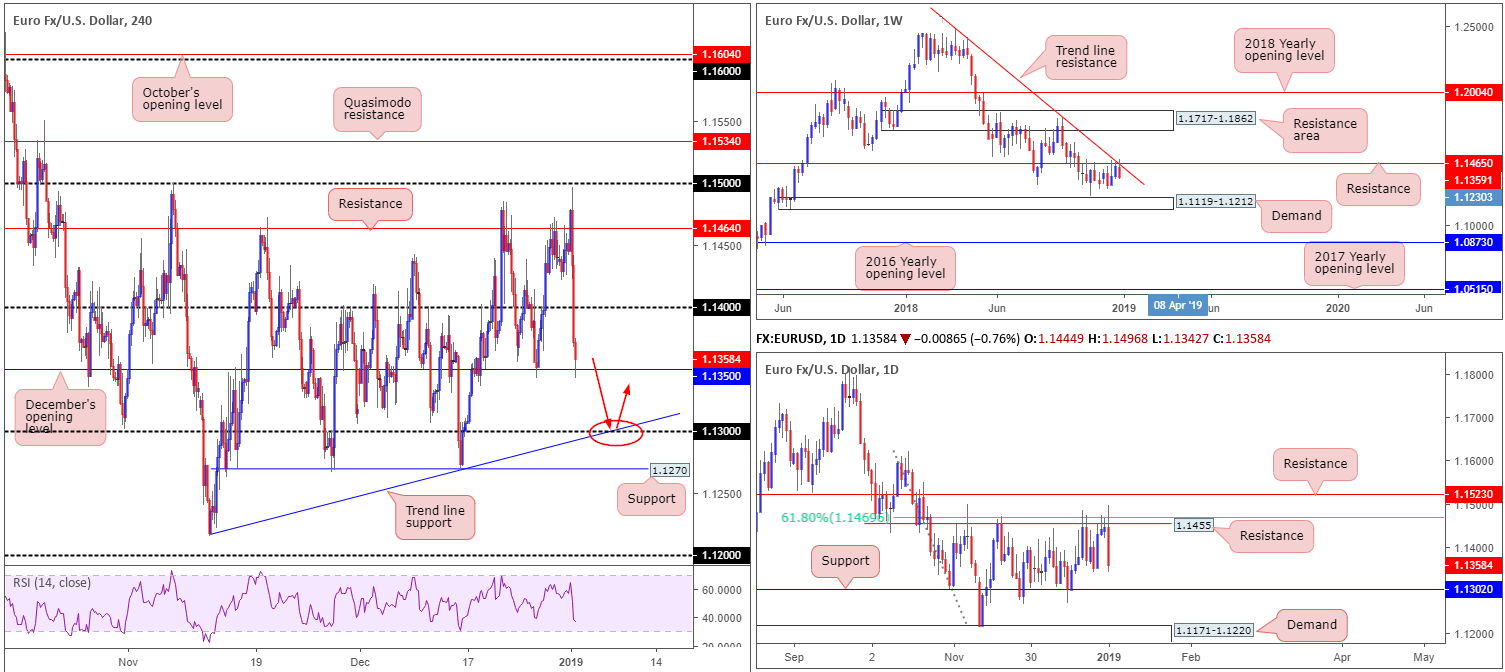
With in-line core Eurozone PMIs unable to spur price action, along with a resurgence of USD bidding witnessed during Asia, the EUR/USD rotated aggressively south just ahead of its 1.15 handle Wednesday. Shedding more than 0.70% in the shape of two dominant H4 bearish candles (at the time of writing), the research team notes 1.14 put up little fight, though December’s opening level coming in at 1.1350 appears firm at the moment. In the event this level is violated, though, there’s limited support on the radar until we cross swords with H4 trend line support (extended from the low 1.1215) and its intersecting round number 1.13, shadowed closely by H4 support priced in at 1.1270.
While December’s opening level highlighted above at 1.1350 did a superb job holding price action higher over the Christmas break (Dec 26), as well as the candles chalking up a higher high in opening trade Wednesday, a long from 1.1350 is questionable, according to our technical studies.
Weekly movement is notching up heavy losses from resistance at 1.1465, which happens to overlap with a trend line resistance (etched from the high 1.2476). Further selling from this point has demand at 1.1119-1.1212 to target. The outlook dims further on the daily chart. Resistance at 1.1455 and its converging 61.8% Fibonacci resistance value at 1.1469 held price lower in recent trade, opening up the possibility of further downside developing towards nearby support at 1.1302 that boasts strong historical significance.
Areas of consideration:
Entering long from December’s opening level on the H4 timeframe at 1.1350 is a chancy move for reasons stated above. Nevertheless, the 1.13 handle positioned just south of the barrier and its merging H4 trend line support (red circle) are likely of interest to some traders – even more so when one takes into account the round number is positioned closely to the daily support level highlighted above at 1.1302.
Traders either have the choice of entering on the back of additional candlestick confirmation (entry/stop parameters can be defined according to this pattern), or trusting the confluence presented and simply placing a limit order to buy at 1.13. Either way, the next upside target from 1.13 is the underside of December’s opening level at 1.1350.
Today’s data points: US ADP Non-Farm Employment Change; US ISM Manufacturing PMI.
GBP/USD:
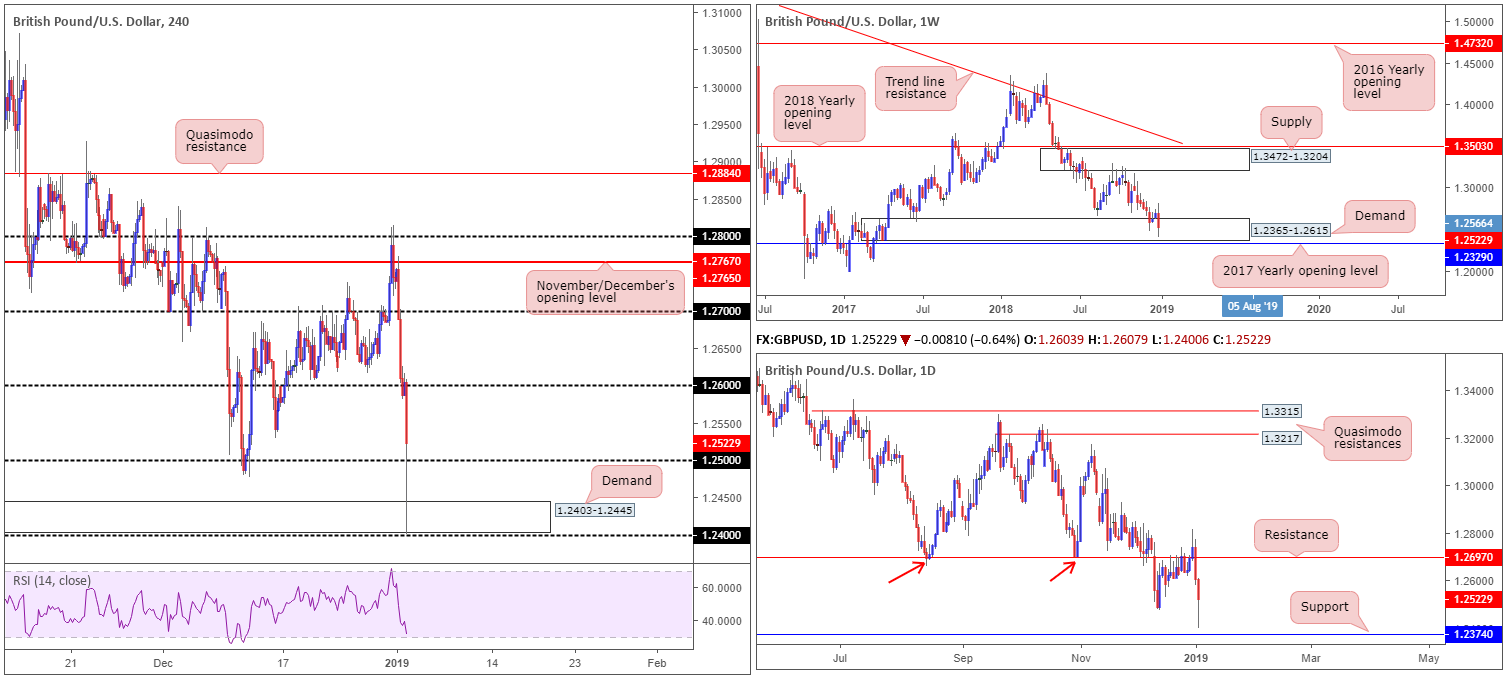
In recent hours, the British pound erased 200 pips in the space of 30 minutes, clocking lows of 1.24 – the lowest levels seen since April 2017. With many analysts labelling this a ‘flash crash’, likely due to a lack of liquidity in the markets, coupled with Brexit-related concerns and Apple’s China news.
Despite striking lows of 1.24 in early Asia, the GBP/USD has reclaimed almost 60% of the move in recent trade, firmly lifting the candles back above 1.25 and exposing 1.26 as a possible resistance on the H4 timeframe. The story on the weekly timeframe, however, reveals demand at 1.2365-1.2615 remains in the fold. Note just south of this zone we also have a support in the shape of a 2017 yearly opening level at 1.2329. Lower down on the curve, daily price shows the unit recently came within striking distance of support coming in at 1.2374, before correcting northbound. The next port of call to the upside on this scale falls in around resistance drawn from 1.2697.
Areas of consideration:
In view of weekly price trading from demand, the psychological level 1.25 is likely an area of interest for possible longs today should H4 price close above this number, with 1.26 as a viable (initial) upside target. Though given recent events, the research team urges traders to trade with caution and only consider 1.25 as support if, and only if, it is accompanied with additional confirmation, such as a bullish candlestick signal.
Today’s data points: US ADP Non-Farm Employment Change; US ISM Manufacturing PMI.
AUD/USD:
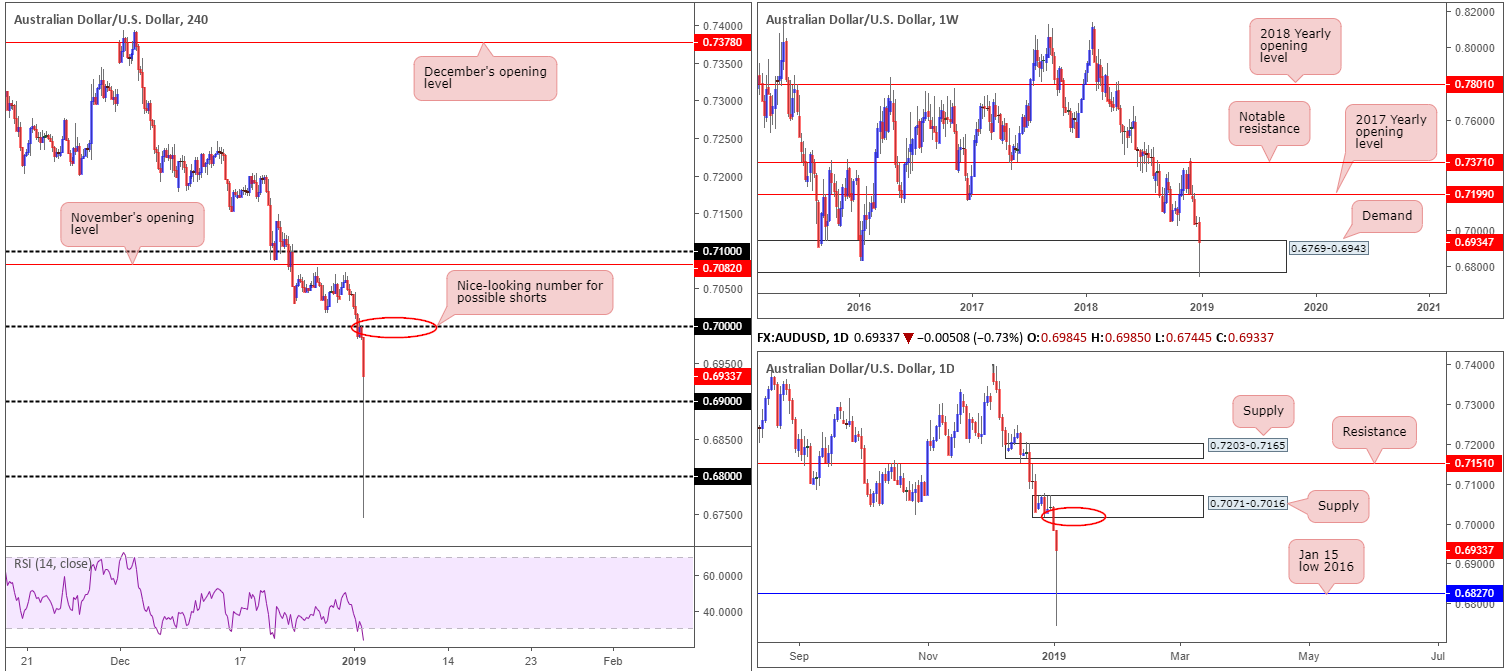
Apple’s recent announcement concerning a dismal quarter – and with some shock results in China partly to blame – rattled the Australian dollar in Asia trade today, sending the AUD/USD pair to lows of 0.6744 – numbers not seen since 2009!
From the top, this has seen weekly price marginally stab through the underside of demand at 0.6769-0.6943, though the move was probably not sufficient enough to take out stop-loss orders on this scale. Daily flow, on the other hand, connected with the 0.6827 January 15 low and now appears poised to reconnect with supply posted at 0.7071-0.7016. In terms of H4 action, the research team’s picture consists mainly of round numbers given recent moves. After reclaiming 0.69 to the upside, the key figure 0.70 will likely be on the radar for many traders today for possible shorts. Note this round number is positioned just a few pips south of daily supply mentioned above at 0.7071-0.7016
Areas of consideration:
Although we’re effectively trading from weekly demand at the moment, the 0.70 number on the H4 scale is of interest for a possible short play, according to our technical studies. With that being said, though, it is recommended to wait for additional candlestick confirmation to form prior to pulling the trigger here (entry/stop parameters can be defined according to this pattern), since it’s difficult to judge if the daily candles will make a run towards its noted supply area, thus causing a potential fakeout play to be seen on the H4.
Today’s data points: US ADP Non-Farm Employment Change; US ISM Manufacturing PMI.
USD/JPY:
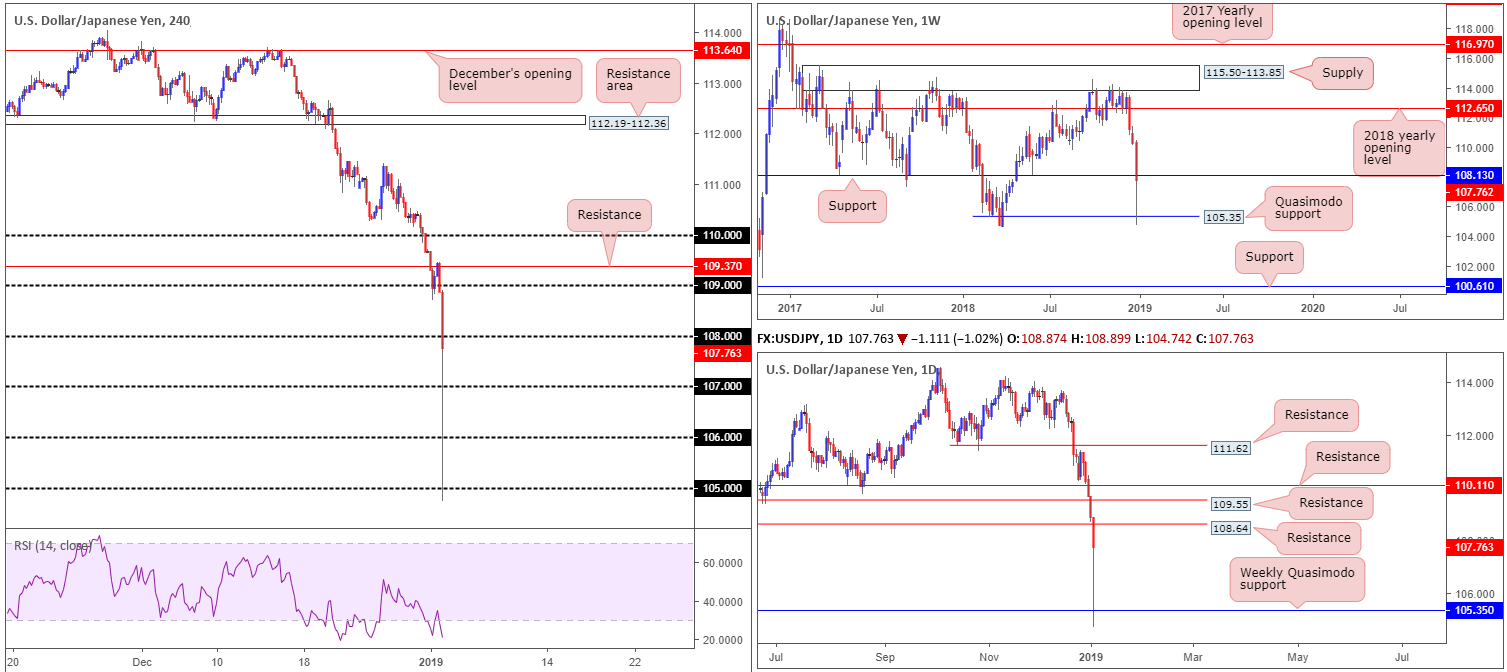
The USD/JPY is seen churning near its mid-107 level today as markets slowly fade the drop witnessed in Asia on refreshed global risk aversion, fueled by a disappointing Apple earnings forecast. Within the span of thirty minutes price slipped over 350 pips, crunching through several round numbers before finally stabilizing at 1.05.
As can be seen from the weekly timeframe this morning, support at 108.13 was ripped apart, leaving Quasimodo support at 105.35 free to enter the fight. Should the pair reclaim 108.13 this week, the path north appears relatively free towards the 2018 yearly opening level at 112.65.
Things are a little more restricted on the daily timeframe, however, as the next port of resistance can be seen around 108.64. H4 price, similar to that of the AUD/USD, consists mainly of round numbers. 108 is a focal point at the moment as price is visibly hovering just south of this number. Above here 109 is in view, though in between traders may want to acknowledge daily resistance highlighted above at 108.64.
Areas of consideration:
Keeping things simple this morning, our technical reading shows possible buying opportunities above 108. A H4 close beyond this number that’s followed up with a retest (preferably in the shape of a bullish candlestick formation – entry/stop parameters can be defined according to this pattern) is likely to be sufficient enough to justify a buy in this market, targeting 108.64 as the initial upside target. Traders are, however, reminded to keep risk/reward considerations in mind, targeting at least a 1:1 ratio towards the first take-profit zone.
Today’s data points: US ADP Non-Farm Employment Change; US ISM Manufacturing PMI; Japanese banks are closed in observance of the 4-day Bank Holiday.
USD/CAD:
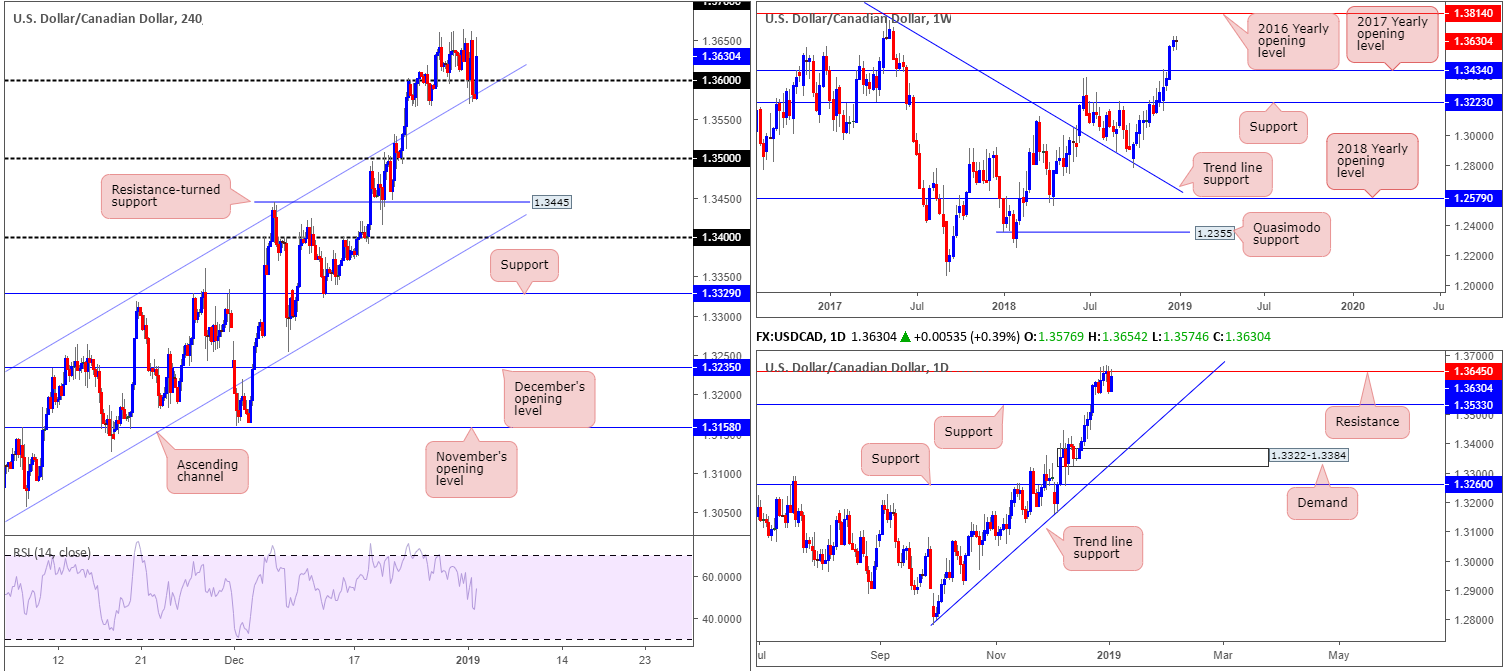
Having witnessed the price of oil rebound and the US dollar trade higher against the majority of its G10 peers Wednesday, the USD/CAD retreated lower and tested 1.36. Though the H4 candles mildly surpassed 1.36, channel resistance-turned support (extended from the high 1.3132) provided a base for buyers to reenter the fight in early Asian hours today.
According to H4 structure, the research team notes limited resistance ahead until crossing swords with 1.37. Further supporting this bias is weekly price, showing room to press as far north as its 2016 yearly opening level at 1.3814. The only grumble, nevertheless, is daily resistance priced in at 1.3645, which capped price action over the Christmas holiday.
Areas of consideration:
Before considering a long position in this market, a H4 close above daily resistance at 1.3645 would be needed, according to our reading. This would likely clear sellers out of the market for a run to at least 1.37, and quite possibly the 2016 yearly opening level at 1.3814 on the weekly timeframe.
Today’s data points: US ADP Non-Farm Employment Change; US ISM Manufacturing PMI.
USD/CHF:
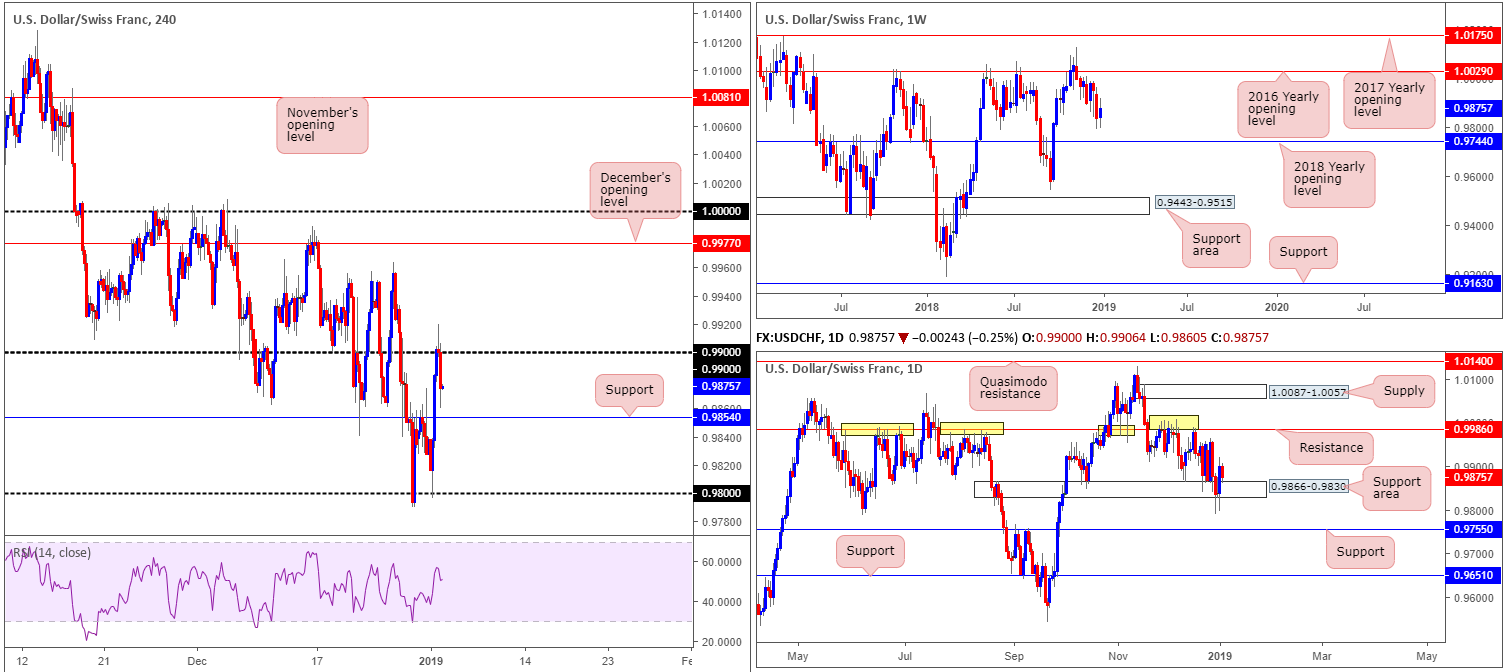
Broad-based USD buying lifted the USD/CHF to higher ground Wednesday, consequently breaching H4 resistance at 0.9854 (now acting support) and concluding the day challenging 0.99 in the shape of a H4 bearish pin-bar formation.
While early Asia sported a moderate wave of selling from 0.99, the current H4 support remains unchallenged. It might interest some traders to note the H4 level is seen housed within the upper limit of a daily support area coming in at 0.9866-0.9830. On a wider perspective, however, weekly price shows room to press beyond both the H4 support and daily support area to weekly support priced in at 0.9744 (converges closely with another layer of daily support at 0.9755).
Areas of consideration:
Going on what we have marked up on the charts, some traders may opt for a long play off the H4 support at 0.9854. This, as noted above, is located within a daily support area. Therefore, it is likely to offer at least a bounce (conservative traders may want to consider waiting for additional candle confirmation before pressing the buy button – entry/stop parameters can be defined according to this pattern). However, with room seen for weekly price to explore lower ground, there’s a chance buyers may be overthrown here for weekly support at 0.9744/daily support at 0.9755.
Today’s data points: US ADP Non-Farm Employment Change; US ISM Manufacturing PMI.
XAU/USD (Gold):
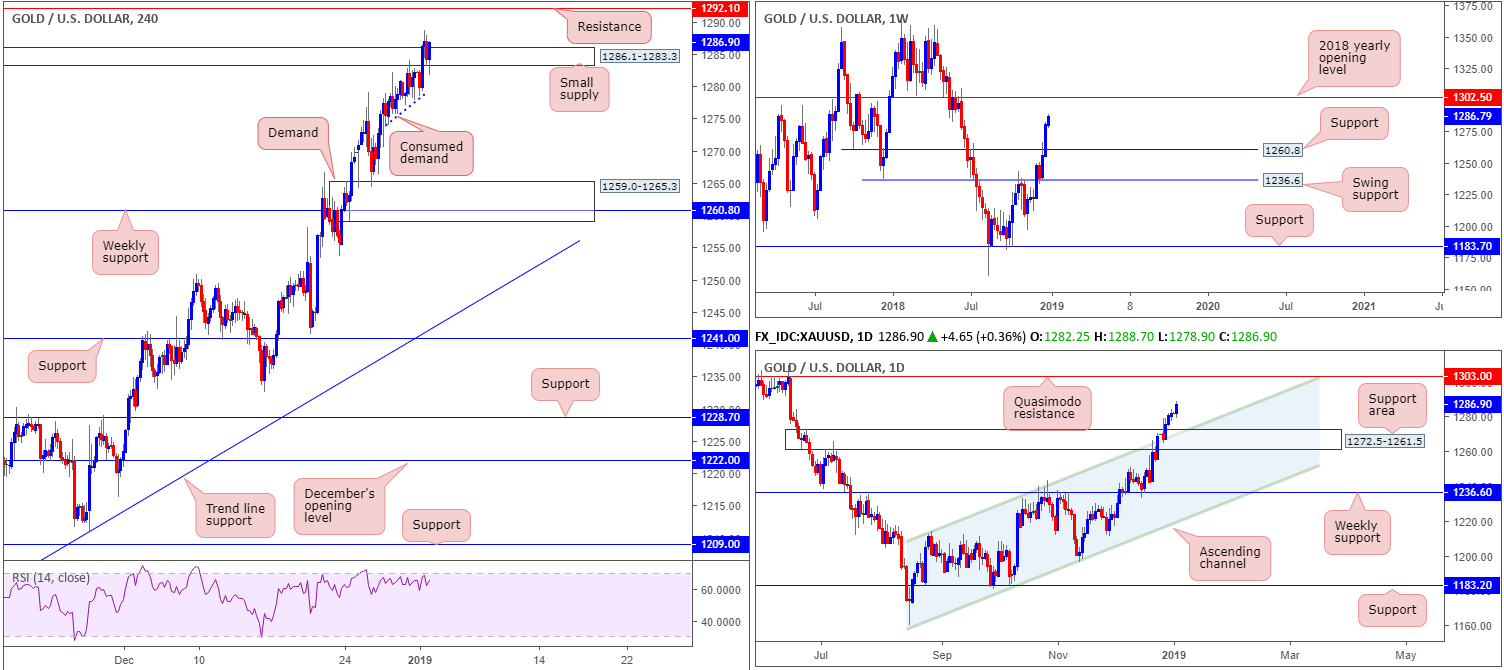
The precious metal kicked off the New Year in fine form Wednesday, gravitating to highs of 1288.7. In response to equity markets exploring lower ground, fueling a flight-to-safety scenario, bullion shook hands with highs not seen since June of 2018.
Stop-loss orders from traders looking to fade H4 supply at 1286.1-1283.3 have likely been filled, thanks to recent movement. In addition to this, breakout buyers’ orders have also possibly been brought into the market as traders attempt to join gold’s Bull Run. The next upside objective from current price on the H4 scale falls in around resistance at 1292.1 – a level extended from early June 2018.
The bullish vibe is also echoed higher up on the curve. Weekly activity, as is evident from the chart, displays room to press as far north as resistance priced in at 1302.5: the 2018 yearly opening level. By the same token, the daily candles also show room to discover higher ground until reaching Quasimodo resistance at 1303.0.
Areas of consideration:
Despite all three timeframes pointing to further buying, the H4 chart lacks an appropriate base of support to buy this market. Beneath current price, limited demand is visible until 1259.0-1265.3, which, as you can see, houses weekly support within at 1260.8. What’s also notable from a technical perspective is the H4 demand is positioned around the lower edge of the daily support area coming in at 1272.5-1261.5. Therefore, should the H4 candlesticks hit the brakes and reverse from current price (before reaching the H4 resistance at 1292.1) and test the aforementioned demand, active buyers likely reside within this base for a possible long opportunity (stop-loss orders are likely best tucked beneath the lower edge of the H4 demand).
An alternative to the above is to drill down to lower-timeframe structure and attempt to buy dips off local structure, with an initial take-profit zone located at 1292.1, followed by higher-timeframe resistances mentioned above.
The use of the site is agreement that the site is for informational and educational purposes only and does not constitute advice in any form in the furtherance of any trade or trading decisions.
The accuracy, completeness and timeliness of the information contained on this site cannot be guaranteed. IC Markets does not warranty, guarantee or make any representations, or assume any liability with regard to financial results based on the use of the information in the site.
News, views, opinions, recommendations and other information obtained from sources outside of www.icmarkets.com.au, used in this site are believed to be reliable, but we cannot guarantee their accuracy or completeness. All such information is subject to change at any time without notice. IC Markets assumes no responsibility for the content of any linked site. The fact that such links may exist does not indicate approval or endorsement of any material contained on any linked site.
IC Markets is not liable for any harm caused by the transmission, through accessing the services or information on this site, of a computer virus, or other computer code or programming device that might be used to access, delete, damage, disable, disrupt or otherwise impede in any manner, the operation of the site or of any user’s software, hardware, data or property.


