
DXY:
The US dollar index (DXY) chart indicates a bullish momentum, suggesting a potential bullish continuation towards the 1st resistance level at 102.77 which is an overlap resistance and also coincides with the 78.60% Fibonacci retracement and the 100% Fibonacci projection levels, indicating Fibonacci confluence. Additionally, should the bullish momentum extend further, the 2nd resistance at 103.44 represents an overlap resistance that could hinder its progress.
The 1st support at 102.01 is considered an overlap support and aligns with the 23.60% Fibonacci retracement level, making it a crucial level to watch for potential bounces. Additionally, the 2nd support at 101.47 acts as another significant support area, coinciding with the 38.20% Fibonacci retracement level, further reinforcing its importance.

EUR/USD:
The EUR/USD chart is currently demonstrating a bearish trend, suggesting a likely continuation of this bearish movement towards the first support level at 1.0918. This support level is significant as an overlap support and is aligned with both the 78.60% Fibonacci retracement and the 61.80% Fibonacci projection levels, indicating a Fibonacci confluence.
If the price were to fall further, the second support level at 1.0839, also acting as an overlap support, aligns with the 100% Fibonacci projection level and could serve as a solid barrier against further decline.
However, if there is a reversal in the trend, the first resistance level at 1.0959, which is an overlap resistance, could pose a challenge for bullish price movements. If the price breaks past this level, the second resistance level at 1.1038, also an overlap resistance, could present a significant obstacle to further price increases.

EUR/JPY:
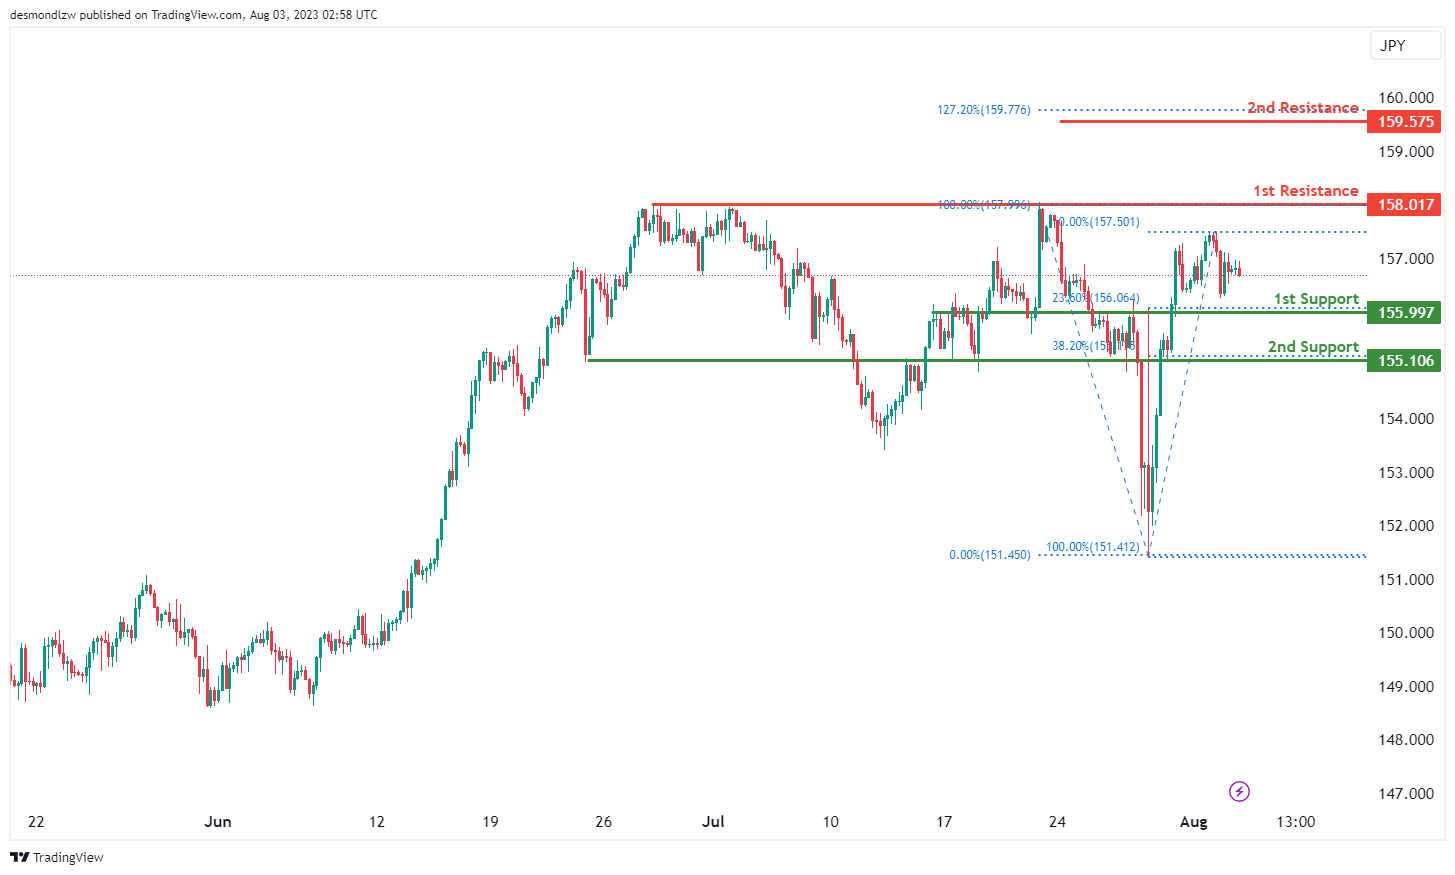
The EUR/JPY instrument currently shows a neutral momentum, suggesting the price could potentially fluctuate between the first resistance level and the first support level.
The first support level at 155.99 is significant due to its role as an overlap support and its alignment with the 23.60% Fibonacci retracement level. Should the price drop further, the second support level at 155.10, also functioning as an overlap support, aligns with the 38.20% Fibonacci retracement level and could act as a firm barrier against additional losses.
On the upside, the first resistance level is located at 158.01. This level is significant due to its role as a multi-swing high resistance and could provide a robust barrier to bullish movements.
If the price manages to breach the first resistance level, the second resistance level at 159.57 could present a substantial obstacle to further upward momentum. This resistance level is notable due to its alignment with the 127.20% Fibonacci extension level.
EUR/GBP:
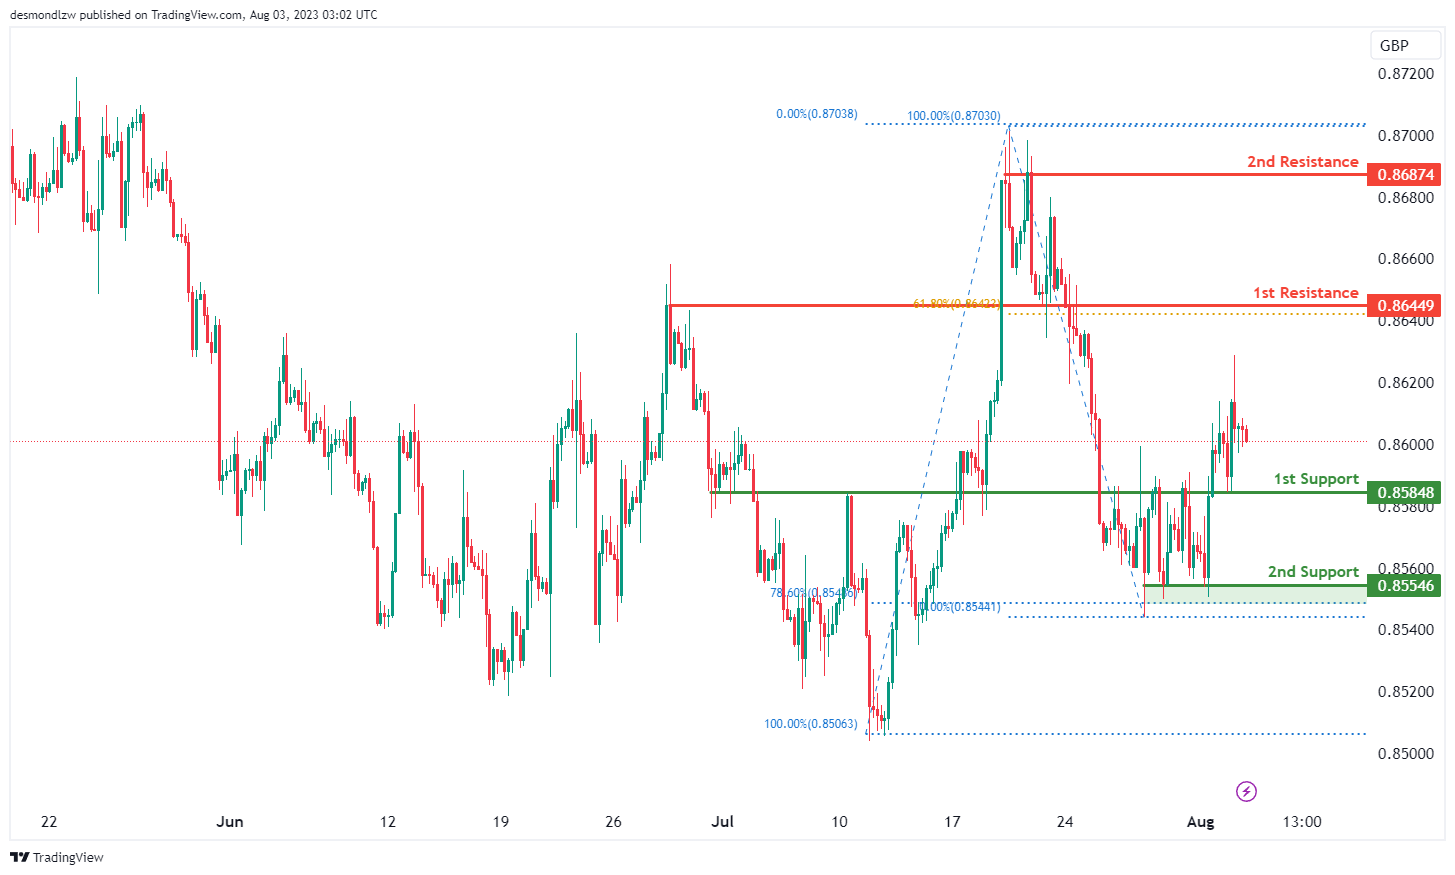
The EUR/GBP instrument currently exhibits a bearish momentum, indicating that the price could potentially continue its bearish trend towards the first support level at 0.8584. This support level is noteworthy due to its role as an overlap support.
Should the price fall further, the second support level at 0.8554, which functions as a multi-swing low support, aligns with the 78.60% Fibonacci retracement level and could provide a solid floor against further price decline.
On the upside, the first resistance level at 0.8644, serving as an overlap resistance, coincides with the 61.80% Fibonacci retracement level and could pose a substantial barrier to bullish movements.
Further up, the second resistance level at 0.8687, identified as a multi-swing high resistance, could also serve as a significant obstacle to further price increases.
GBP/USD:
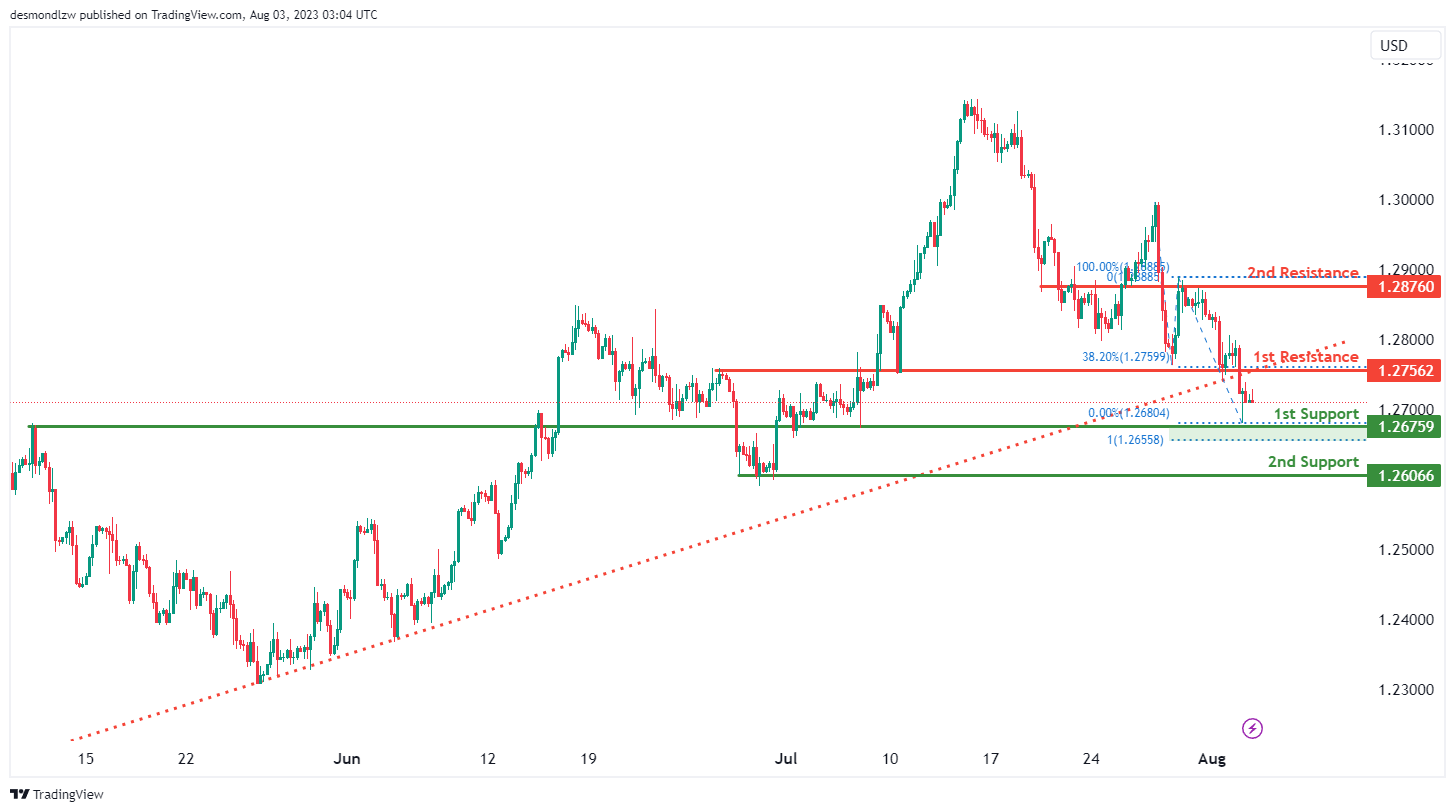
The GBP/USD chart is demonstrating a bearish momentum, bolstered by the price breaking below an ascending support line, signaling a potential bearish move. There’s an expectation for this bearish trend to continue towards the first support level at 1.2676, notable for being an overlap support and aligning with the 100% Fibonacci projection level.
If the price declines further, the second support level at 1.2607, also an overlap support, could act as a barrier to more losses.
However, in the event of a price reversal, the first resistance level at 1.2756, recognized as an overlap resistance and aligned with the 38.20% Fibonacci retracement level, may provide a significant hurdle. If the price breaks past this level, the second resistance at 1.2876, another overlap resistance, may present further challenges to price increases.
GBP/JPY:
The GBP/JPY instrument is currently exhibiting a bullish momentum, indicating a possible bullish bounce off the first support level at 181.90, which acts as a pullback support, and heading towards the first resistance level at 183.81. This resistance level is significant due to its role as a multi-swing high resistance.
If the price begins to decline, the second support level at 179.88, acting as an overlap support and aligning with the 50% Fibonacci retracement level, could act as a solid barrier against further price drop.
In the interim, the price might encounter an obstacle at the intermediate resistance level of 182.49, which serves as an overlap resistance and could pose a significant hurdle for the bullish price movement.

USD/CHF:
The USD/CHF chart is showing a bullish trend, supported by the price positioning above a major ascending trend line, hinting at the possibility of more bullish momentum.
This trend is expected to continue towards the first resistance level at 0.8819, which is significant due to its role as an overlap resistance and its alignment with the 61.80% Fibonacci retracement level. An intermediate resistance level is also present at 0.8794, which is an overlap resistance and aligns with the 161.80% Fibonacci extension level.
If the price manages to break past the first resistance, the second resistance at 0.8909 could pose a significant challenge. This level is an overlap resistance and aligns with the 78.60% Fibonacci retracement level.
In the case of a downturn, the first support level is at 0.8697, recognized for being an overlap support and aligning with the 38.20% Fibonacci retracement level. This could prevent further price decline. If the price drops past this level, the second support level at 0.8631, another overlap support, could provide a more substantial price floor.

USD/JPY:
The USD/JPY is showing a bullish momentum, suggesting a likely bullish continuation towards the first resistance level at 143.88. This resistance is notable due to its role as an overlap resistance, and its alignment with the 78.60% Fibonacci retracement and 145.00% Fibonacci projection levels, indicating a Fibonacci confluence.
If the price breaks past the first resistance, the second resistance level at 144.86, marked by a swing high resistance, may present a significant challenge to further bullish momentum.
In terms of support, the first level is at 142.09, recognized as an overlap support and coinciding with the 23.60% Fibonacci retracement level. The second support level is at 140.75, another overlap support, aligned with the 50% Fibonacci retracement level. These could prevent further price decline.

USD/CAD:
The USD/CAD chart is showing a bullish momentum, suggesting a potential bullish continuation towards the first resistance level at 1.3387. This resistance is notable as an overlap resistance and aligns with the 78.60% Fibonacci projection level. Before reaching the first resistance, price could encounter some resistance at 1.3353, which serves as an intermediate resistance level, due to its role as an overlap resistance and its alignment with the 61.80% Fibonacci projection level.
Looking upwards, if the price breaks past the first resistance, the second resistance level is at 1.3467, defined by the 127.20% Fibonacci extension level. This could present a substantial obstacle to continued bullish momentum.
The first support level is at 1.3271, which is an overlap support. Before the 1st support, an additional support level can be found at 1.3299, serving as an intermediate support point and could potentially halt a price decline.

AUD/USD:
The AUD/USD instrument is currently in a bearish trend, and it’s likely that the price may continue to move downwards to the first support level at 0.6465. This level acts as a swing low support and coincides with the 145.00% Fibonacci extension level, adding additional significance.
Should the price drop beyond the first support, the second support at 0.6403, functioning as an overlap support, is expected to halt further decline. This level also aligns with the 161.80% Fibonacci extension level.
In case of a price reversal, the first resistance level is at 0.6547, which is an overlap resistance, and could present an obstacle to bullish price movements. If the price breaks past this resistance, the second resistance at 0.6595, acting as an overlap resistance, might further impede the price’s upward progression.

NZD/USD
The NZD/USD instrument is currently in a bullish trend, with a potential for a bullish bounce off the first support level at 0.6065 and a move towards the first resistance. This support level acts as a swing low support and aligns with the -27.20% Fibonacci expansion level.
If the price declines past the first support, the second support level at 0.5993, also acting as a swing low support, is expected to prevent further decline.
On the other hand, if the price starts to rise, the first resistance at 0.6132, functioning as an overlap resistance, might hinder bullish progression. If the price surges past this resistance, the second resistance at 0.6221, which corresponds to a swing high resistance, could pose an additional obstacle.

DJ30:
The DJ30 instrument currently exhibits a bullish trend, implying a potential bullish bounce off the first support level at 35228.58, and a subsequent movement towards the first resistance level at 35728.64. The first support level is noteworthy due to its role as a pullback support and its alignment with the 23.60% Fibonacci retracement level.
If the price descends further, the second support level at 34938.35, which also acts as a pullback support and aligns with the 38.20% Fibonacci retracement level, could provide a firm floor to prevent additional losses.
On the bullish side, the first resistance level is significant for its role as a multi-swing high resistance. If the price attempts to break this level, it might encounter a significant hurdle at the second resistance level at 35847.94, aligning with the 127.20% Fibonacci extension level.

GER30:
The GER30 instrument currently shows a weak bullish momentum with low confidence, suggesting a possible bullish bounce from the first support level at 16000.84 towards the first resistance level at 16214.24. The first support level is significant as a multi-swing low support and aligns with the 50% Fibonacci retracement level.
If the price drops further, the second support level at 15685.94, which serves as an overlap support and coincides with the 78.60% Fibonacci retracement, could potentially halt further losses.
In terms of upward resistance, the first resistance level at 16214.24, an overlap resistance, aligns with the 50% Fibonacci retracement level. Beyond this, the second resistance level at 16319.30 is crucial due to its role as an overlap resistance. This level is also in line with the 61.80% Fibonacci retracement and projection, indicating a potential Fibonacci confluence that might pose challenges to bullish movements.

US500
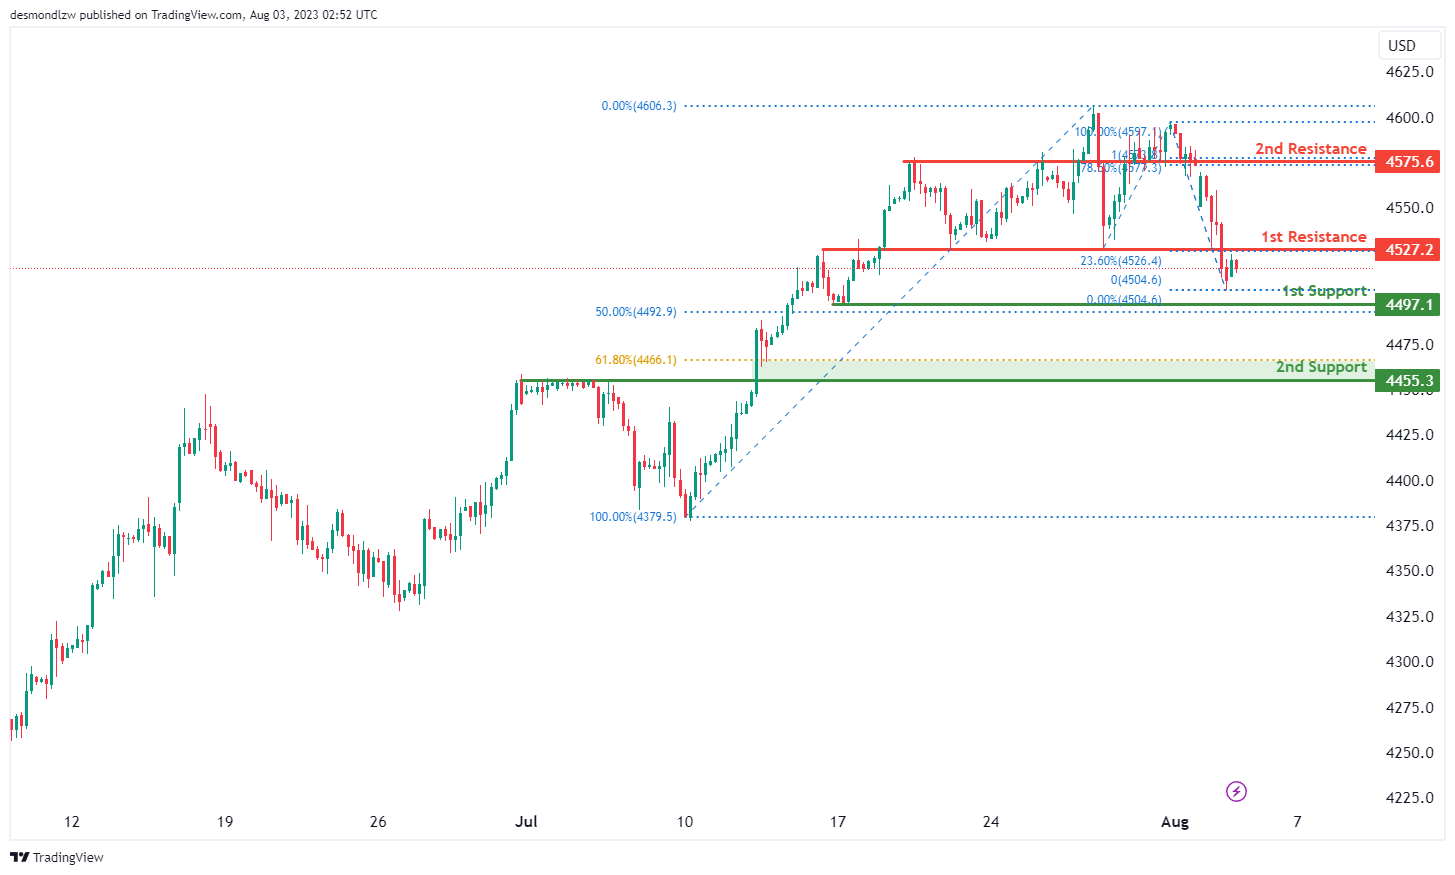
The US500 instrument currently exhibits a bullish momentum, suggesting a potential bullish continuation towards the first resistance level at 4527.2. This resistance level is notable due to its role as an overlap resistance and its alignment with the 23.60% Fibonacci retracement level.
In terms of support, the first support level at 4497.1 functions as a swing low support and aligns with the 50% Fibonacci retracement level, providing a potential floor for any price decline. Should the price drop further, the second support level at 4455.3, serving as a pullback support, aligns with the 61.80% Fibonacci retracement level and could provide additional support against further losses.
If the price exceeds the first resistance level, the second resistance level at 4575.6, which serves as an overlap resistance, is of interest due to its alignment with the 78.60% Fibonacci retracement level and 100% Fibonacci projection. This Fibonacci confluence could present a significant obstacle for further bullish momentum.
BTC/USD:
The BTC/USD instrument is presently in a bearish trend, as indicated by its position below the bearish Ichimoku cloud. This suggests a potential bearish continuation towards the first support level at 28840, which is considered significant due to its role as a multi-swing low support and its alignment with the 78.60% Fibonacci retracement level.
If the price drops further, the second support level at 28200, acting as a pullback support, could serve to limit further decline.
On the resistance side, the first resistance level at 29567 is considered significant due to its role as an overlap resistance. If the price moves past this level, it could face a challenge from the second resistance level at 30333. This level is notable as a multi-swing high resistance and aligns with the 50% Fibonacci retracement level, suggesting it could present a significant obstacle for any potential bullish movements.

ETH/USD:
The ETH/USD instrument currently exhibits a bearish momentum, suggesting a possible bearish continuation towards the first support level at 1827.07. This support level is significant due to its role as a multi-swing low support.
Should the price descend further, the second support level at 1777.96 could come into play. This level is notable as an overlap support and may serve as a barrier to further losses.
On the upside, the first resistance level is at 1888.39. This level holds significance due to its role as an overlap resistance and could provide a challenge to bullish movements. If the price breaks past this level, it might face another hurdle at the second resistance level at 1918.34, which is also identified as an overlap resistance.

WTI/USD:
The WTI/USD chart is currently exhibiting a bearish momentum on the chart, primarily influenced by its recent break below an ascending support line. This break has triggered the potential for a bearish move in the market.
As a result of this bearish momentum, the price could possibly continue its downward trajectory, heading towards the first support level located at 78.76. This support level holds significant weight due to its role as a pullback support, complemented by its alignment with a 23.60% Fibonacci retracement level.
In addition to the first support, there is a second support level at 76.91, which gains strength from its identity as an overlap support and its association with a 38.20% Fibonacci retracement level.
On the flip side, the market faces resistance levels that could impede any upward movement. The first resistance, situated at 80.31, is reinforced by its status as an overlap resistance and its alignment with a 50.00% Fibonacci retracement level. Lastly, the second resistance, found at 83.27, is noteworthy for being a multi-swing high resistance point.

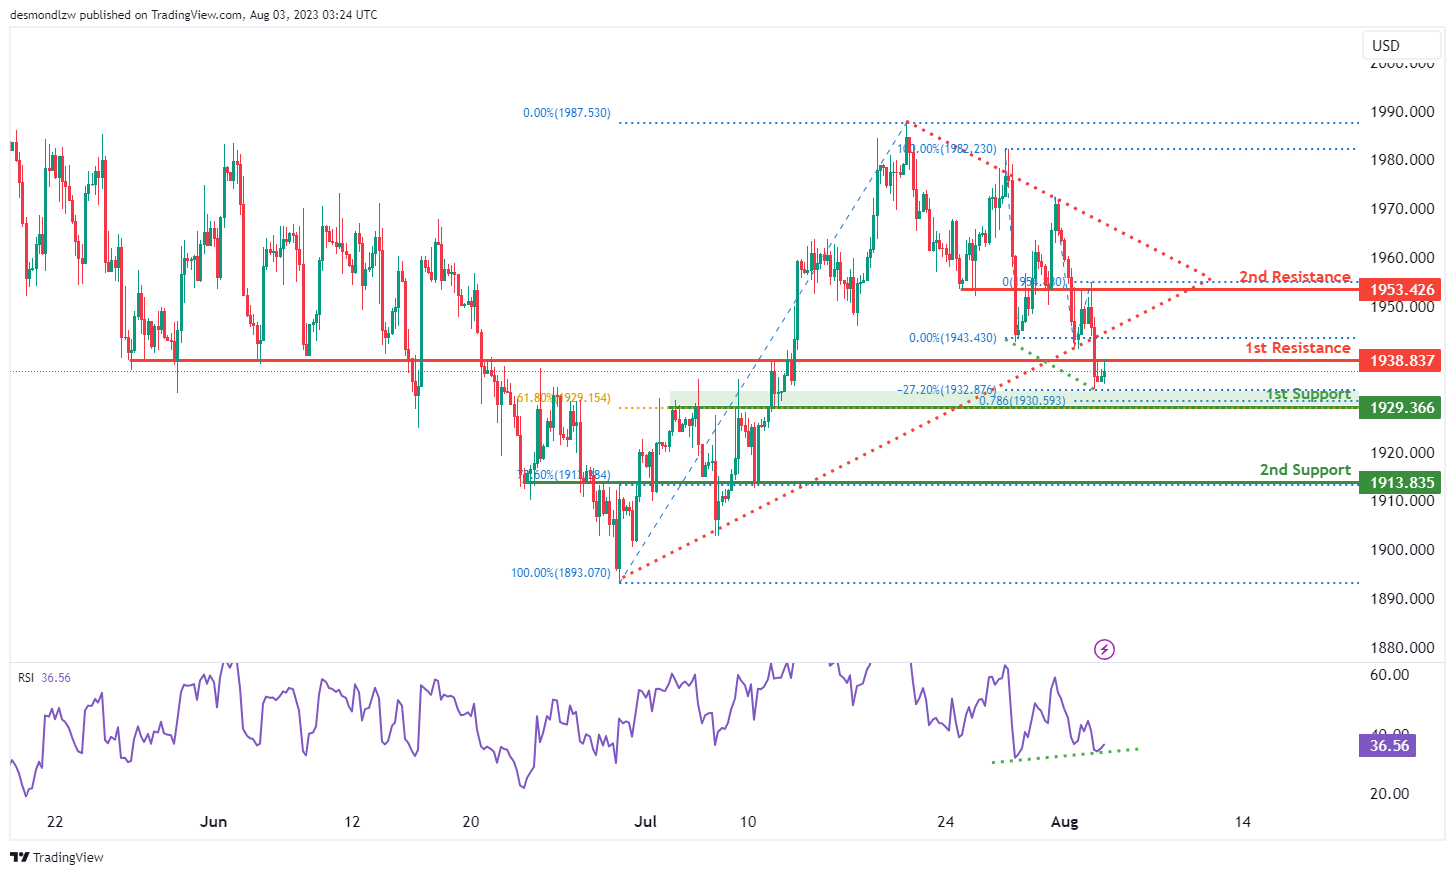
XAU/USD (GOLD):
Gold (XAU/USD) is currently experiencing a bearish trend, accentuated by the price breaking below an ascending support line, suggesting potential bearish movements. The expectation is for the bearish trend to continue towards the first support level at 1929.37. This support level is significant because it serves as a pullback support and aligns with both the 61.80% Fibonacci retracement and 78.60% Fibonacci projection levels, indicating a Fibonacci confluence.
Should the price drop even further, the second support level at 1913.84, functioning as an overlap support, aligns with the 78.60% Fibonacci retracement level, and may limit further losses.
In case of a price rebound, the first resistance level is at 1938.84, recognized as an overlap resistance, which could pose a challenge. Beyond that, the second resistance level is at 1953.43, another overlap resistance, which may offer additional resistance to upward movement.
Additionally, the Relative Strength Index (RSI) is displaying a bullish divergence compared to the price, suggesting a potential bounce in the near future.
The accuracy, completeness and timeliness of the information contained on this site cannot be guaranteed. IC Markets does not warranty, guarantee or make any representations, or assume any liability regarding financial results based on the use of the information in the site.
News, views, opinions, recommendations and other information obtained from sources outside of www.icmarkets.com, used in this site are believed to be reliable, but we cannot guarantee their accuracy or completeness. All such information is subject to change at any time without notice. IC Markets assumes no responsibility for the content of any linked site.
The fact that such links may exist does not indicate approval or endorsement of any material contained on any linked site. IC Markets is not liable for any harm caused by the transmission, through accessing the services or information on this site, of a computer virus, or other computer code or programming device that might be used to access, delete, damage, disable, disrupt or otherwise impede in any manner, the operation of the site or of any user’s software, hardware, data or property.


