
A note on lower-timeframe confirming price action…
Waiting for lower timeframe confirmation is our main tool to confirm strength within higher timeframe zones, and has really been the key to our trading success. It takes a little time to understand the subtle nuances, however, as each trade is never the same, but once you master the rhythm so to speak, you will be saved from countless unnecessary losing trades. The following is a list of what we look for:
- A break/retest of supply or demand dependent on which way you’re trading.
- A trendline break/retest.
- Buying/selling tails/wicks – essentially we look for a cluster of very obvious spikes off of lower timeframe support and resistance levels within the higher timeframe zone.
- Candlestick patterns. We tend to stick with pin bars and engulfing bars as these have proven to be the most effective.
We typically search for lower-timeframe confirmation between the M15 and H1 timeframes, since most of our higher-timeframe areas begin with the H4. Stops are usually placed 3-5 pips beyond confirming structures.
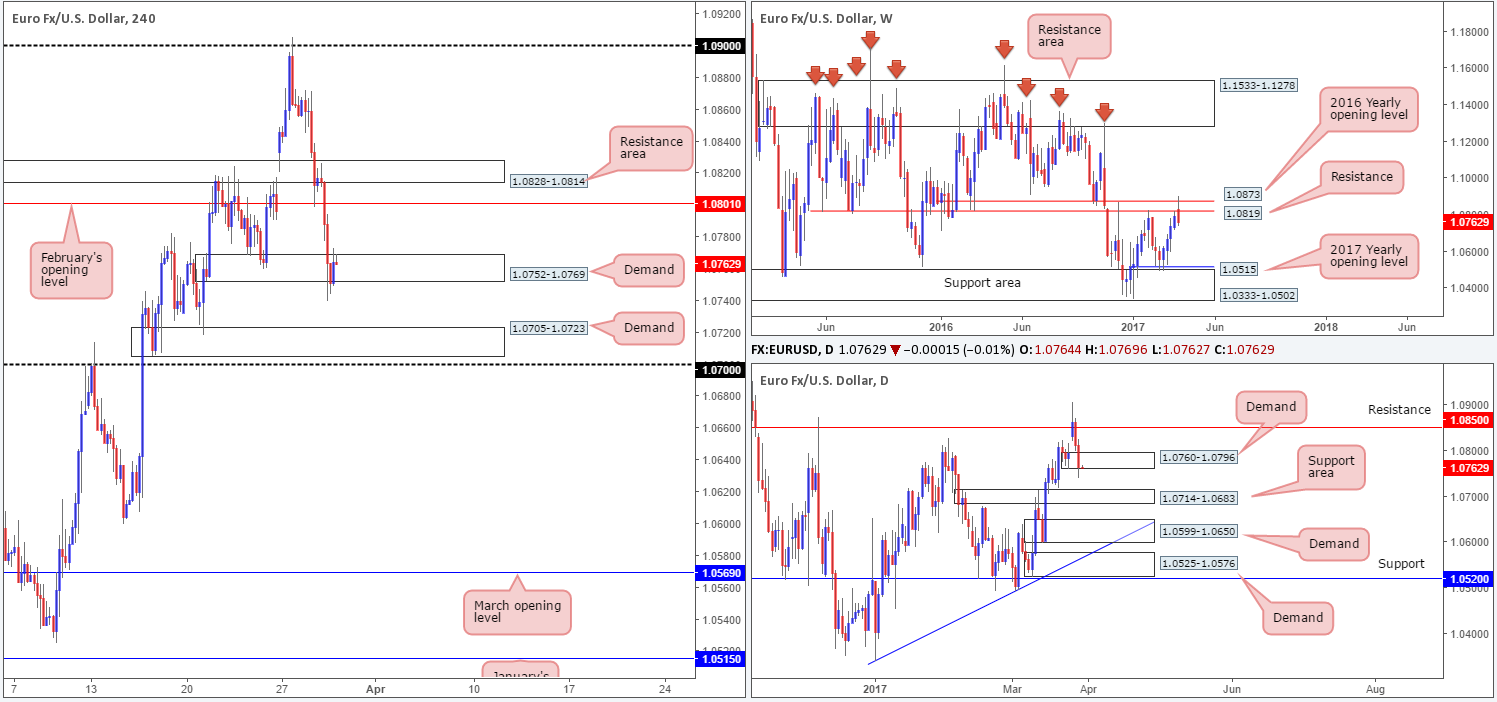
EUR/USD:
Despite the H4 demand at 1.0752-1.0769 holding firm yesterday, the EUR is under noticeable pressure. The selloff from the 2016 yearly opening level at 1.0873 has been strong. According to the weekly timeframe, and this is assuming that price also remains below resistance at 1.0819, the next downside target does not come into view until the 2017 yearly opening level at 1.0515/support area at 1.0333-1.0502. On a more positive note, however, daily demand at 1.0760-1.0796 is in play and may lend a hand to the H4 bulls!
Our suggestions: To our way of seeing things, the pair reflects quite a strong bearish stance at present. While there are daily/H4 demands currently in motion, both have recently suffered a breach. The next downside hurdle beyond the current H4 demand is 1.0705-1.0723: another H4 demand base which happens to occupy the top edge of a daily support area coming in at 1.0714-1.0683. Seeing as how there are only 20 or so pips to play with between the two H4 areas, our team is reluctant to commit to shorts. Sometimes no position is the better position!
Data points to consider: US final GDP and US unemployment claims at 1.30pm. FOMC member Kaplan also takes the stage at 4pm GMT.
Levels to watch/live orders:
- Buys: Flat (stop loss: N/A).
- Sells: Flat (stop loss: N/A).
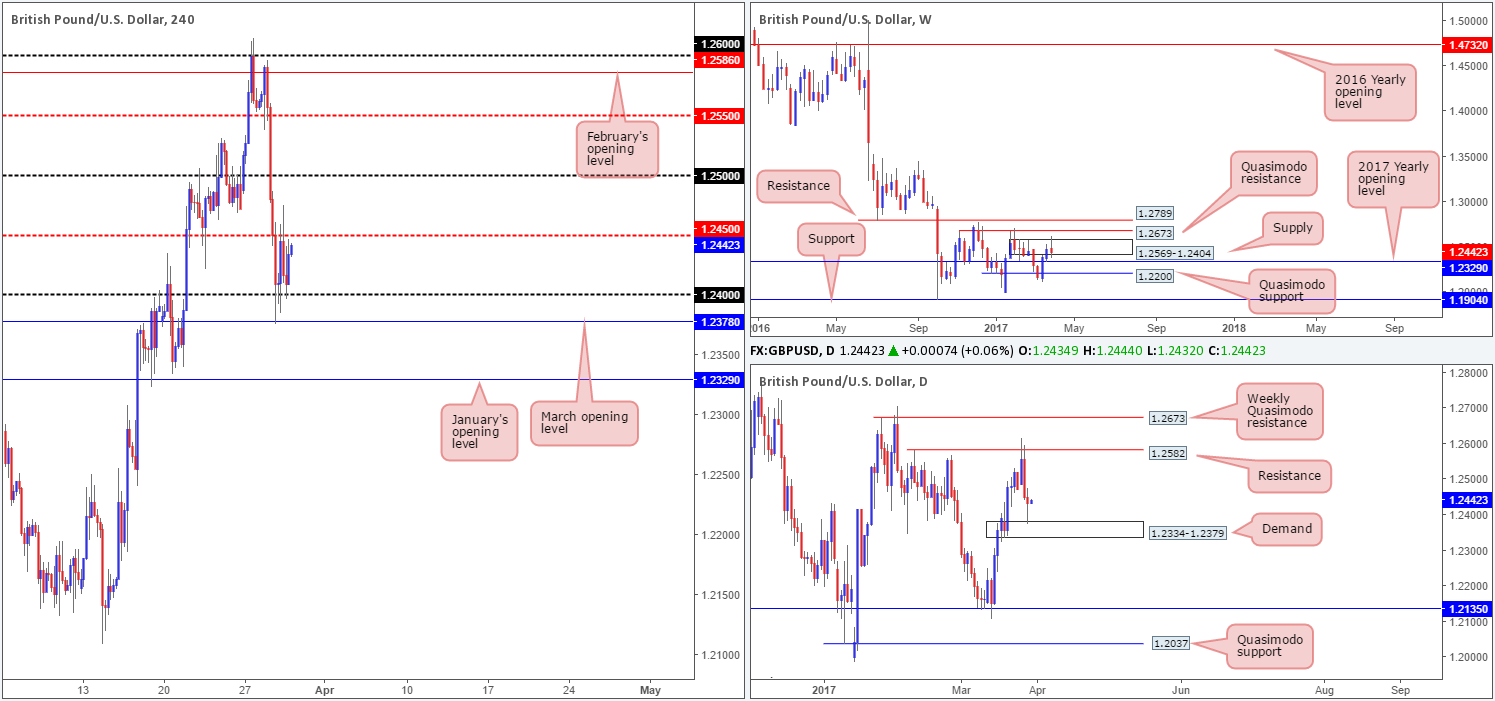
GBP/USD:
Following an upside breach of the weekly supply zone at 1.2569-1.2404, the bears have remained in the driving seat. Unfortunately though, this selling could come to a halt sometime soon, due to the 2017 yearly opening base sitting just below at 1.2329. On the other side of the coin, nevertheless, daily action has already touched base with a demand area pegged at 1.2334-1.2379. Should the bulls hold ground here, the unit could potentially rally back up to resistance drawn in at 1.2582.
Jumping across to the H4 candles, we can see that the pair spent yesterday’s sessions fluctuating between a mid-level resistance at 1.2450 and the 1.24 handle, as British Prime Minister Theresa May invoked Article 50 of the Lisbon Treaty. Directly below this temporary range is March’s opening level at 1.2378, whereas to the upside we have the 1.25 handle in sight.
Our suggestions: A difference of opinion is clearly seen on the higher timeframes (see above). Therefore, trading this market is tricky. In the event that the H4 closes above 1.2450 and holds as support, however, there might be scope to trade long here for a quick bounce up to 1.25. We would not want to target any higher than this given that there is a weekly supply area in motion.
Data points to consider: US final GDP and US unemployment claims at 1.30pm. FOMC member Kaplan also takes the stage at 4pm GMT.
Levels to watch/live orders:
- Buys: Watch for price to engulf 1.2450 and look to trade any retest seen thereafter ([waiting for a lower-timeframe signal to form following the retest is advised – see the top of this report] stop loss: dependent on where one confirms the line).
- Sells: Flat (stop loss: N/A).
AUD/USD:
As can be seen from the H4 chart this morning, supply at 0.7684-0.7674 elbowed its way into the spotlight yesterday, following the break of the mid-level resistance 0.7650. A short from this region is not something we would typically label as high probability. Not only is there little leg room seen below to 0.7650/March’s opening level at 0.7642, the supply also lacks higher-timeframe convergence.
An area we do like the look of, however, is the H4 Quasimodo resistance level coming in at 0.7738. This line brings together a collection of noteworthy resistances: the daily Quasimodo resistance at 0.7734 and a weekly trendline resistance etched from a high of 0.7835, which is located directly below the weekly supply at 0.7849-0.7752.
Our suggestions: Apart from the H4 Quasimodo resistance level highlighted above, there’s not much else to hang our hat on at the moment. Should price strike 0.7738 sometime today, we would, dependent on the time of day, consider entering short without additional confirmation and placing stops above the apex of the Quasimodo formation at 0.7752.
Data points to consider: US final GDP and US unemployment claims at 1.30pm. FOMC member Kaplan also takes the stage at 4pm GMT.

Levels to watch/live orders:
- Buys: Flat (stop loss: N/A).
- Sells: 0.7738 (stop loss: 0.7752).
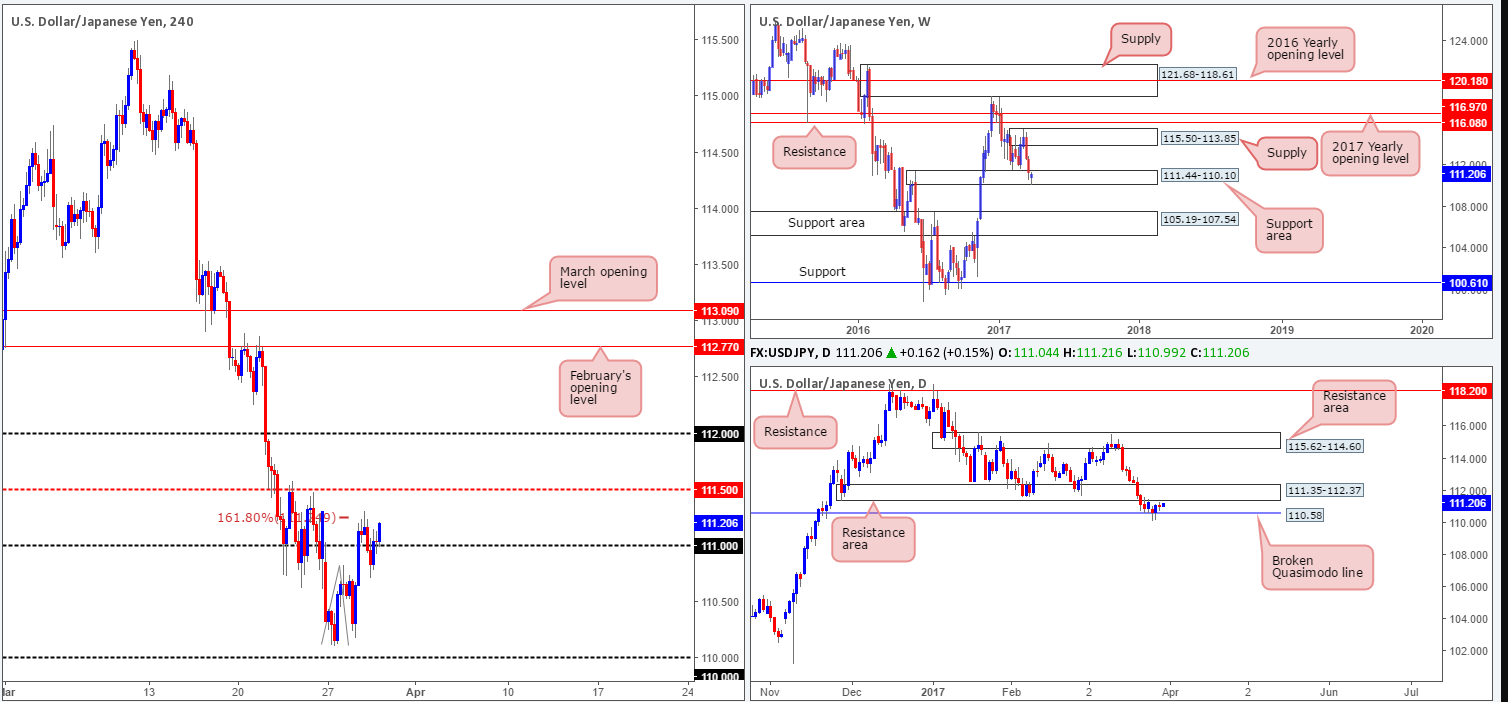
USD/JPY:
In recent sessions, the USD/JPY sold off from the 161.8% H4 Fib ext. at 111.25 (taken from the low 110.11) and even managed to surpass the 111 handle. As you can see though, price managed to recover relatively quickly and broke back above 111 going into the US segment.
In view of weekly bulls defending the support area at 111.44-110.10, the H4 mid-level resistance at 111.50 will likely be challenged today. 111.50 also happens to be housed within a daily resistance area at 111.35-112.37, which has capped upside since the 23rd March.
Our suggestions: The bulls do look to be gaining the upper hand at the moment. With that being said though, we would like to see a decisive H4 close above 111.50 before committing here. A close above this number would, in our opinion, demonstrate strength from the weekly support area and weakness from the daily resistance area.
As such, a close above 115.50, followed by a retest as support and a lower-timeframe confirming signal (see the top of this report) is, we believe, enough to justify a long position, targeting 112 as an initial take-profit zone.
Data points to consider: US final GDP and US unemployment claims at 1.30pm. FOMC member Kaplan also takes the stage at 4pm GMT.
Levels to watch/live orders:
- Buys: Watch for price to engulf 111.50 and look to trade any retest seen thereafter ([waiting for a lower-timeframe signal to form following the retest is advised] stop loss: dependent on where one confirms the line).
- Sells: Flat (stop loss: N/A).
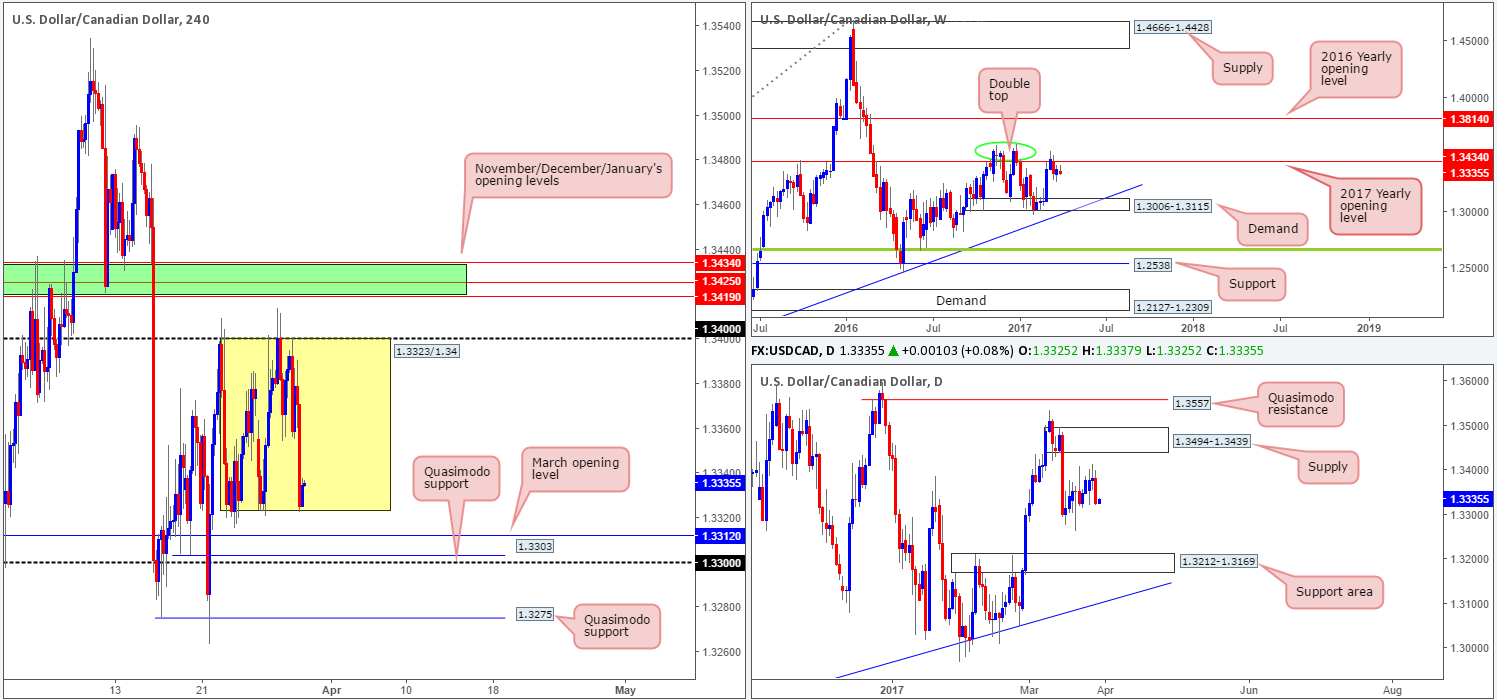
USD/CAD:
Since the 22nd March, the USD/CAD has been chiseling out a consolidation fixed between 1.3323/1.34. Helped by a recovery in oil prices, the pair was forced down to the lower limits of this range yesterday, which, as you can see, is currently holding form. Of particular interest here is that this H4 range has formed just below the 2017 yearly opening level at 1.3434. Owing to there being space for the market to selloff on both the weekly and daily charts, the consolidation will eventually break to the downside. So, we’ll refrain from entering long within this boundary.
Our suggestions: Although the higher timeframes show room to drop lower, H4 structure could potentially throw a spanner in the works here. Directly below the current H4 range, there’s March’s opening level at 1.3312 to contend with, as well as the H4 Quasimodo support at 1.3303 and 1.33 handle. Given this factor, a short on the break of this range is also not really something we’d feel comfortable trading.
Data points to consider: US final GDP and US unemployment claims at 1.30pm. FOMC member Kaplan also takes the stage at 4pm GMT.
Levels to watch/live orders:
- Buys: Flat (stop loss: N/A).
- Sells: Flat (stop loss: N/A).
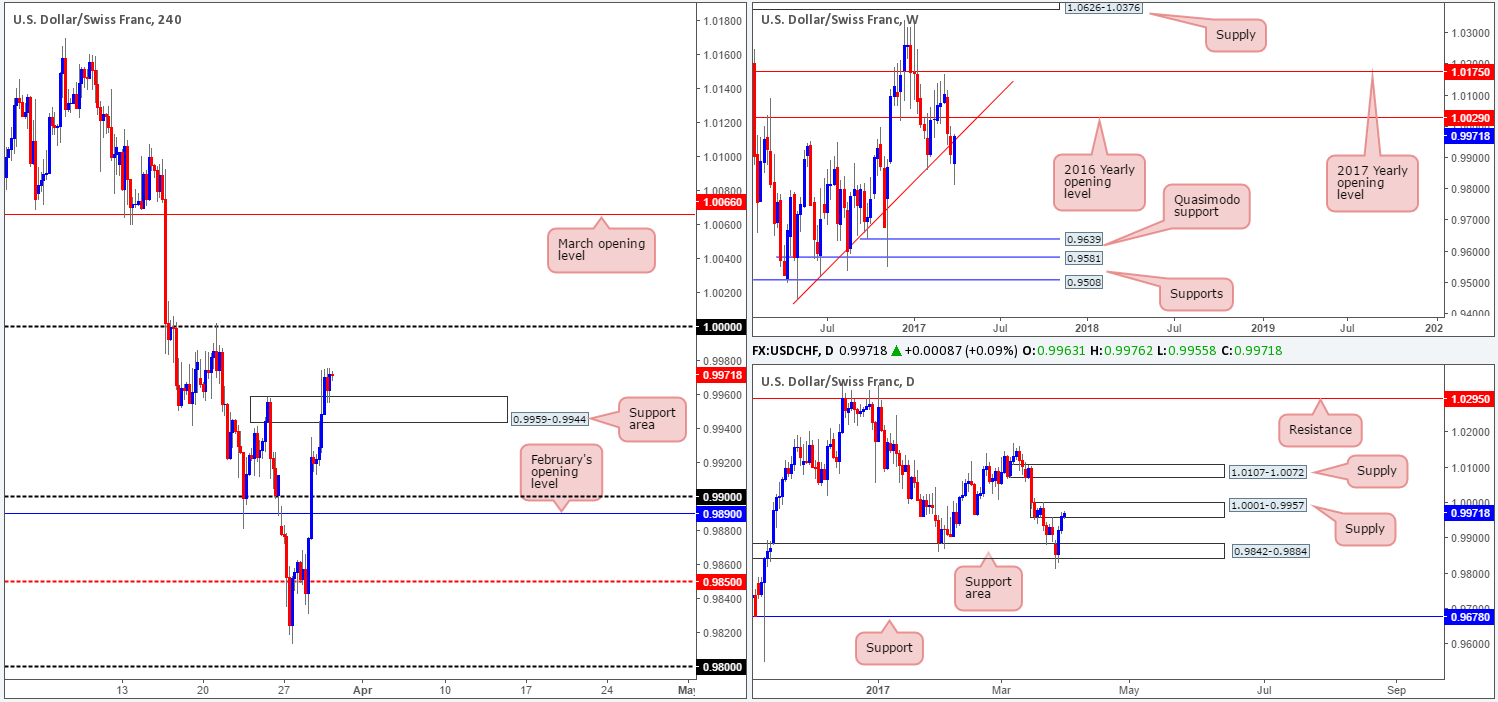
USD/CHF:
Kicking this morning’s report off with a look at the weekly chart, we can see that price is now testing the underside of a recently broken trendline support taken from the low 0.9443. In conjunction with weekly price, the buyers and sellers on the daily chart are currently battling for position within supply drawn from 1.0001-0.9957.
Turning our attention to the H4 chart, nonetheless, the support area at 0.9959-0.9944 is holding firm, which could force price to test parity (1.0000) sometime today. 1.0000 is, in our opinion, a sound number to be looking to short from owing to it also being planted within the top edge of the current daily supply!
Our suggestions: Psychological boundaries are typically prone to fakeouts, and 1.0000 is not any different. Therefore, before a sell is considered here, we would like to see some form of lower-timeframe confirmation present itself (see the top of this report). This will help avoid the dreaded fakeout! The first take-profit target from this angle is the above noted H4 support area.
Data points to consider: US final GDP and US unemployment claims at 1.30pm. FOMC member Kaplan also takes the stage at 4pm GMT.
Levels to watch/live orders:
- Buys: Flat (stop loss: N/A).
- Sells: 1.0000 region ([waiting for a lower-timeframe confirming signal to form before pulling the trigger is advised] stop loss: dependent on where one confirms the area).
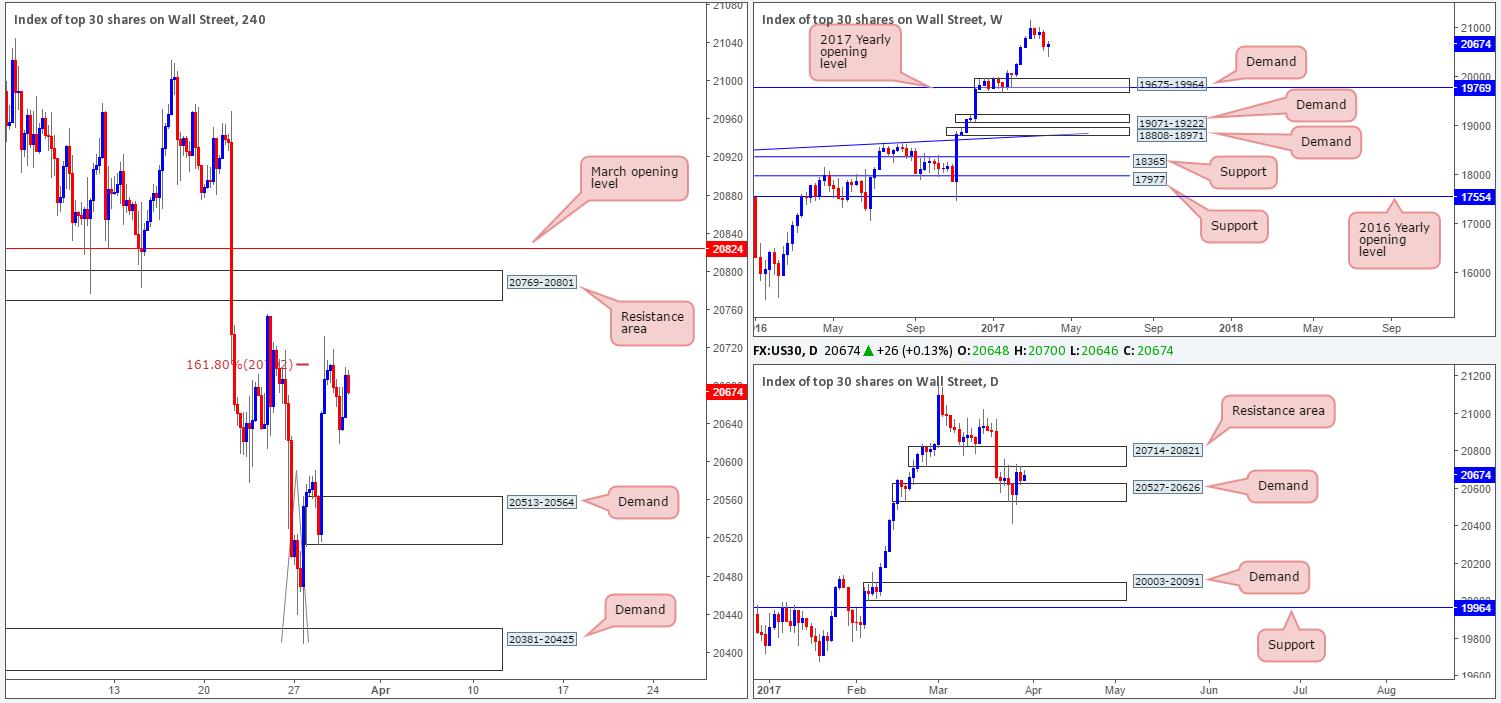
DOW 30:
US stocks managed to catch an offer from the H4 161.8% ext. at 20703 (drawn from the low 20410) going into the early hours of yesterday’s session. This brought the unit down to a low of 20620, before price stabilized and begun to advance into the day’s end. As mentioned in Wednesday’s report, the H4 Fib ext. is bolstered by a daily resistance area coming in at 20714-20821. So, there is a chance that the sellers could step in on this market again today. The flipside to this, of course, is that weekly action is in the process of printing a nice-looking buying tail on a pullback from record highs of 21170. It takes a lot of money (professional money) to create such a pattern on this scale!
Our suggestions: Neither a long nor short seems attractive at this time. It doesn’t help to see daily price so tightly confined between the aforementioned resistance area and demand at 20527-20626. To confirm bullish strength, we want to see H4 price close above March’s opening level at 20824.
Data points to consider: US final GDP and US unemployment claims at 1.30pm. FOMC member Kaplan also takes the stage at 4pm GMT.
Levels to watch/live orders:
- Buys: Flat (stop loss: N/A).
- Sells: Flat (stop loss: N/A).
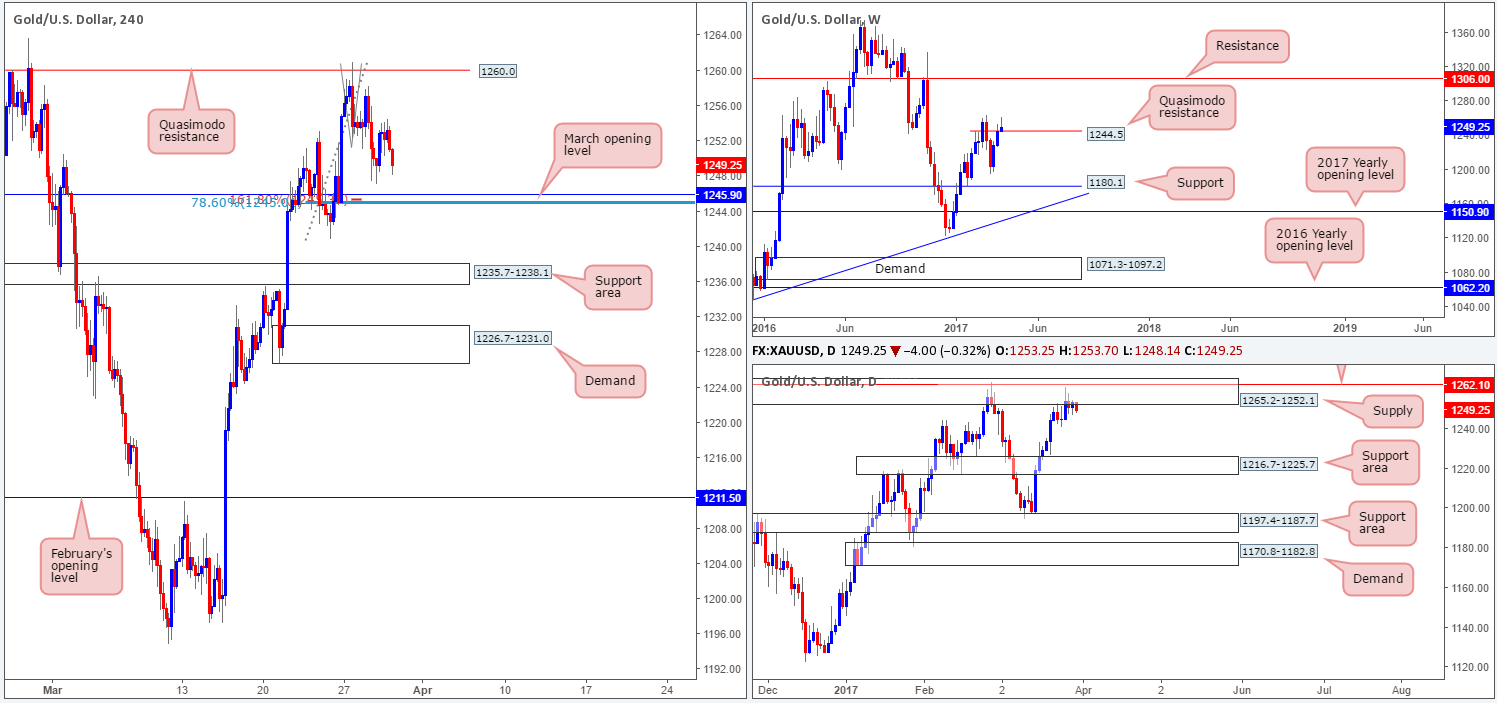
GOLD:
Gold prices are little changed this morning, despite the unit ranging over $7. As such, H4 price remains loitering just ahead of March’s opening level at 1245.9. Further bolstering this level is a 161.8% Fib ext. at 1245.3 taken from the high 1260.9 and a 78.6% retracement penciled in from the low 1240.8 at 1245.0. Additionally, there is a potential three-drive H4 approach setting up from the high 1260.9.
As we mentioned in yesterday’s report that although we do expect a bounce to be seen from the 1245.0/1245.9 neighborhood, let’s not forget to be mindful of the bigger picture here. Weekly movement shows that price is trading above a weekly Quasimodo resistance line at 1244.5. Nevertheless, our desk has noted that until the high of this formation is broken (1263.7), the weekly line will remain valid. In other words, all the while the daily supply area at 1265.2-1252.1 is in play, the bears have the upper hand.
Our suggestions: Based on the confluence seen surrounding the 1245.9 zone, we might look to trade this level for a scalp this morning (still, we would prefer it if this level is confirmed by the lower timeframes beforehand [see the top of this report]). Aiming to trade this level for anything more than a small bounce is risky given the higher-timeframe structures in motion right now.
Levels to watch/live orders:
- Buys: 1245.9 region ([waiting for a lower-timeframe confirming signal to form is advised before pulling the trigger [stop loss: dependent on where one confirms this area).
- Sells: Flat (stop loss: N/A).


