
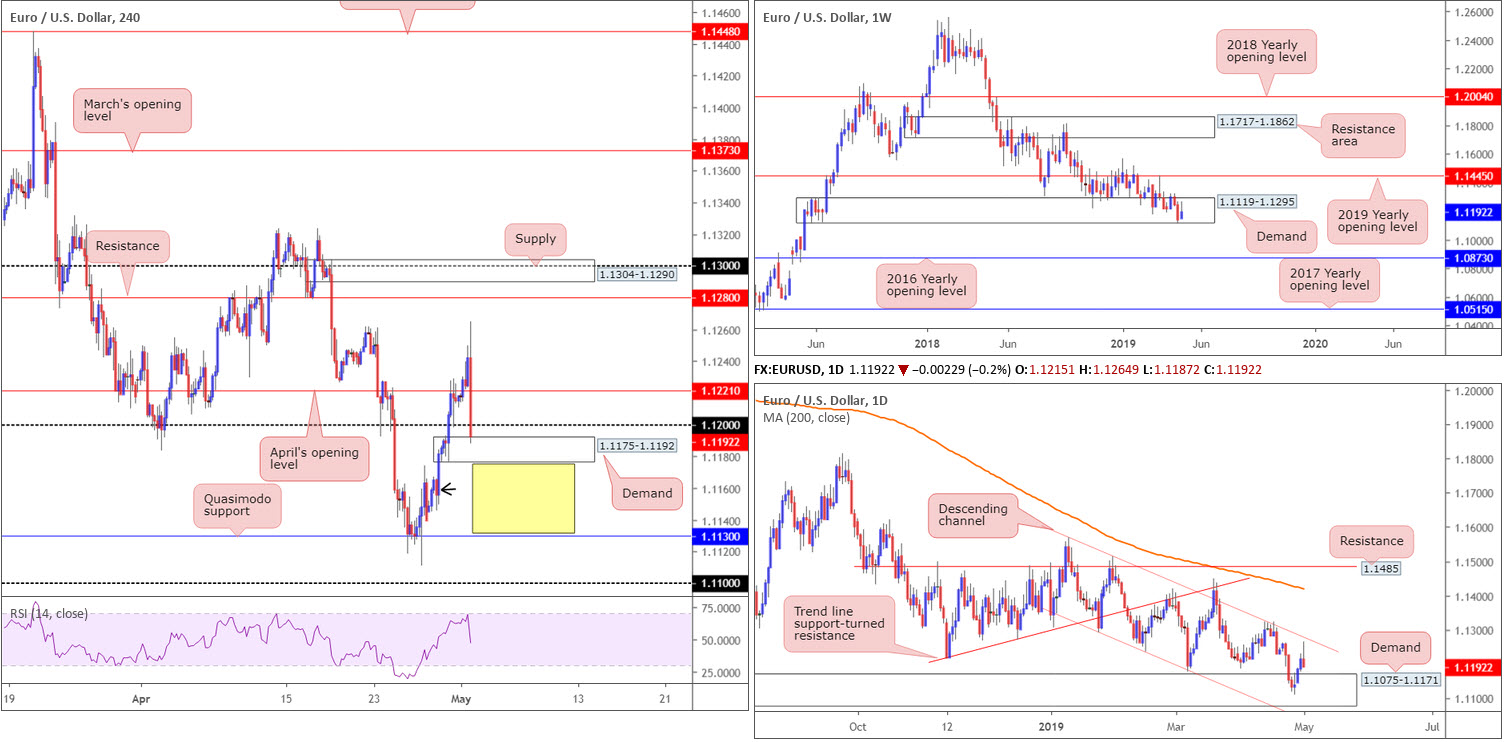
EUR/USD:
In recent hours, the EUR/USD spun off into a phase of selling, consequently sailing through April’s opening level at 1.1221 and the 1.12 handle on the H4 timeframe. The move, as of writing, chalked up a post-fed low of 1.1187, though is seen finding a floor of support off a nearby demand coming in at 1.1175-1.1192. As expected, the FOMC held the Federal Funds Rate at between 2.25-2.50%. Fed’s Powell during the press conference, also talked up the US economy, offering the greenback some much-needed respite.
In the event the current H4 demand area fails to hold price action, the next port of call is likely to be around Quasimodo support at 1.1130. There is some mild demand seen in between here (black arrow), though probably not sufficient to draw in adequate buying power. It might also interest some traders to note the RSI indicator turned lower just ahead of its overbought value and is now edging its way below the 50.0 zone.
On the weekly timeframe, buyers and sellers continue to war for position amid a long-standing demand area at 1.1119-1.1295. In terms of daily movement, price action came within striking distance of connecting with channel resistance etched from the high 1.1569 before turning lower. As you can see, the unit ended the day closing within close proximity to demand plotted at 1.1075-1.1171 (glued to the underside of the current weekly demand area).
Areas of consideration:
The space between the current H4 demand area and H4 Quasimodo support at 1.1130 may be of interest to sellers should we break into this area (yellow). Do, however, remain cognizant the market is trading within weekly demand and positioned close by daily demand as well.
Aside from the above, this is a flat market in terms of technical structure offering confluence to trade.
Today’s data points: Limited.
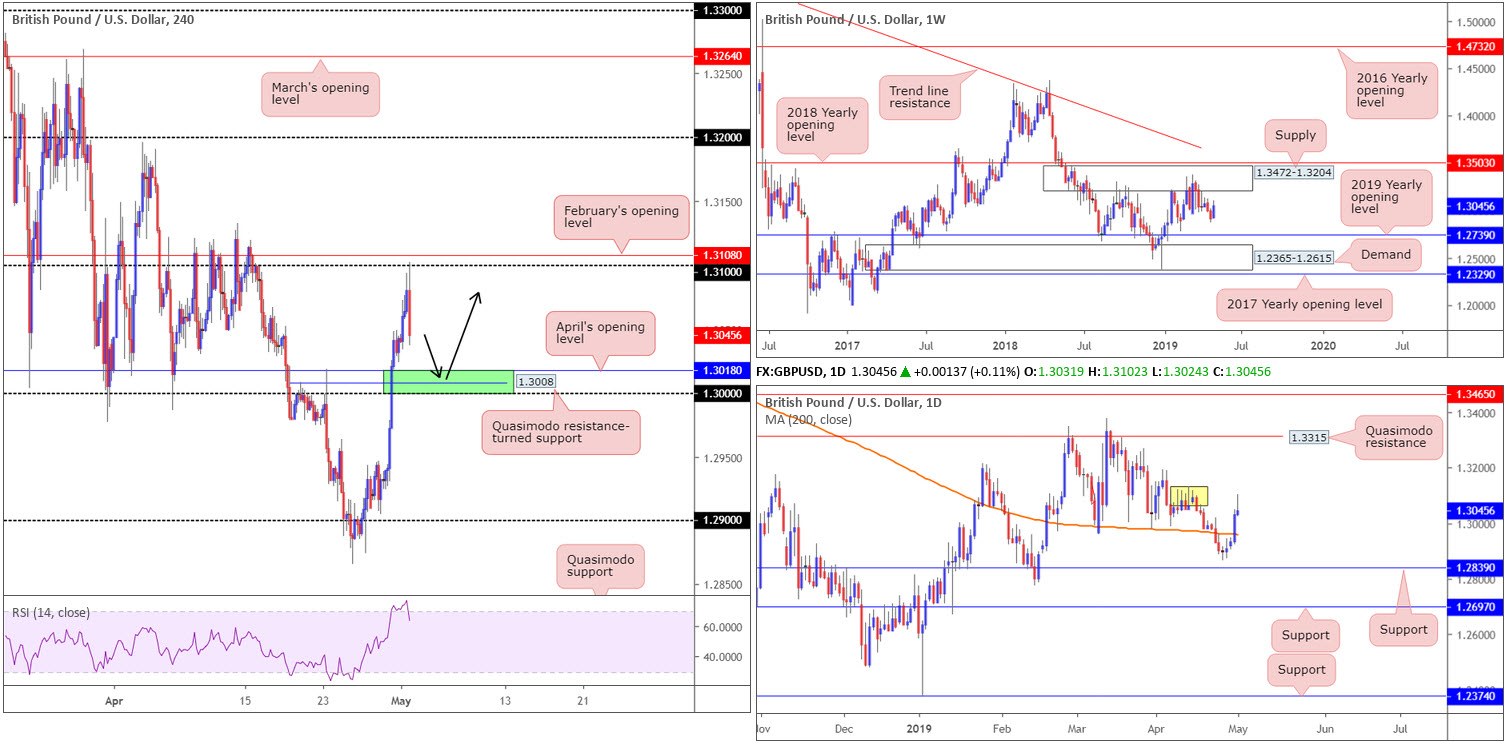
GBP/USD:
Sterling maintained recent momentum Wednesday, reinforced by better-than-expected Markit manufacturing PMI as well as upbeat rhetoric regarding the state of cross-party Brexit negotiations. The move, however, swiftly peaked at a high of 1.3102 as the dollar gathered traction amid remarks from Fed’s Chairman Jerome Powell.
As of writing, the unit trades at 1.3047 and has unlocked the door for a possible move back towards key figure 1.30 on the H4 timeframe (surrounding supports: Quasimodo resistance-turned support at 1.3008 and April’s opening level at 1.3018 – green).
Recent buying, as is evident on the daily timeframe, made a run for supply emerging around 1.3070ish (yellow). Note above here, active supply is limited until reaching Quasimodo resistance at 1.3315. Selling from the current supply has the 200-day SMA to target. In terms of weekly flow, price action could move in either direction with supply overhead visible at 1.3472-1.3204 and the 2019 yearly opening level surfacing below at 1.2739.
Areas of consideration:
The green H4 support zone discussed above at 1.30/1.3018 is still an area traders may find use in for potential longs. A retest of this area in the shape of a H4 bullish candlestick formation is likely enough to entice buyers into the market. Waiting for additional candlestick confirmation helps traders identify buyer intent; helps avoid a fakeout beneath 1.30 and also provides structure by which to position entry and risk levels.
The only drawback to buying 1.30/1.3018 is daily price reacting from supply (see above). This could be enough to squeeze H4 buyers from the said zone.
Today’s data points: BoE Inflation Report; MPC Official Bank Rate Votes; Monetary Policy Summary; Official Bank Rate; Asset Purchase Facility; MPC Asset Purchase Facility Votes; BoE Gov Carney Speaks.
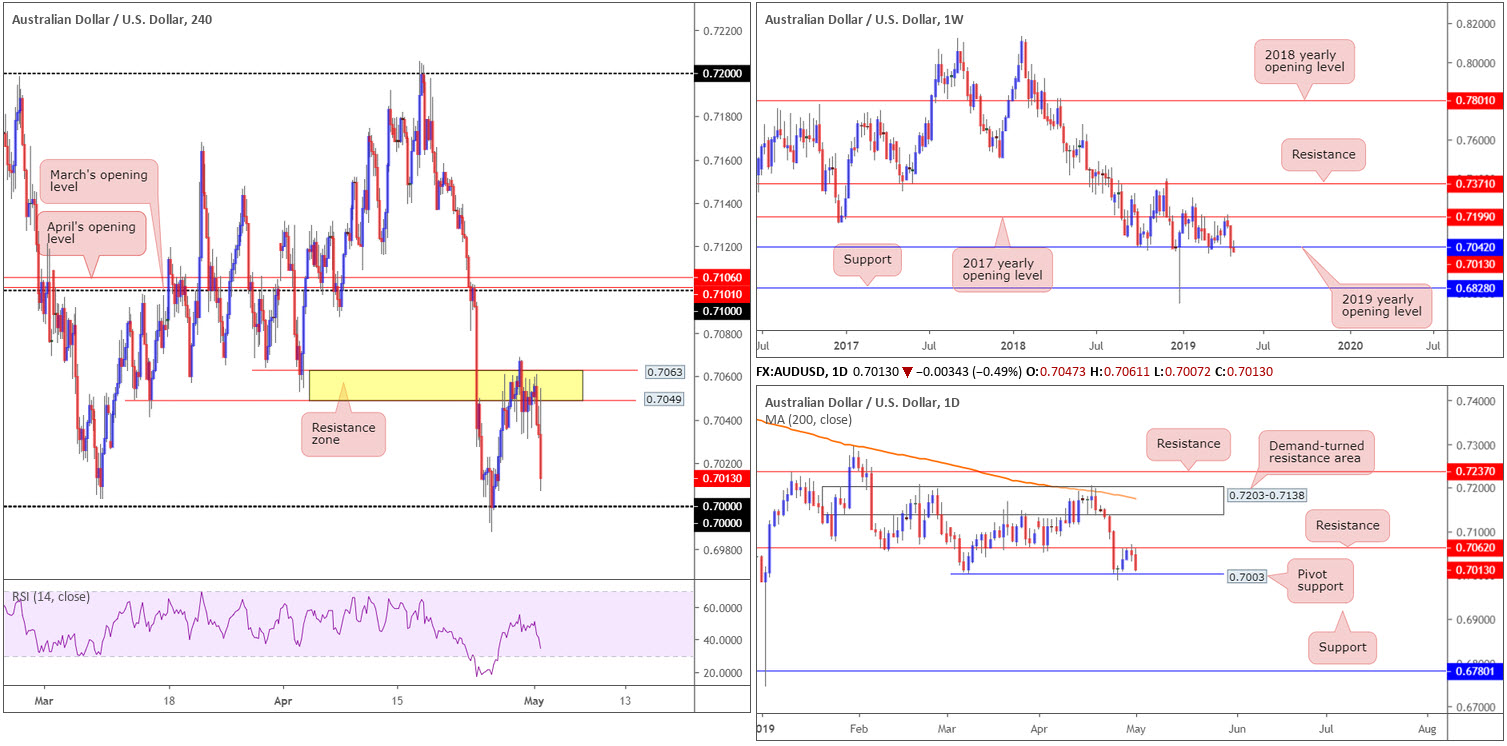
AUD/USD:
Guided by FOMC-induced selling, the H4 resistance area at 0.7063-0.7049 (comprised of two Quasimodo support-turned resistances) held ground. This area, having seen it draw a connection with daily resistance plotted at 0.7062, was a noted zone to keep eyeballs on for shorts. Well done to any of our readers who managed to pin down a sell from here. The next downside target on the H4 scale falls in around the key figure 0.70, which happens to merge closely with a pivot support at 0.7003 on the daily timeframe.
Another constructive development worth highlighting is the current weekly candle has marginally dethroned its 2019 yearly opening level support at 0.7042. A weekly close formed beneath here could set the stage for another wave of selling towards support plotted at 0.6828.
Areas of consideration:
As of current price, there are no immediate opportunities to trade, according to our technical studies. Sellers short from 0.7063/0.7049 are likely targeting 0.70 as the initial take-profit zone. A break beyond 0.70 on a H4 closing basis will likely clear the runway south to 0.69. Note, however, the higher timeframes suggest price action could potentially drop as far south as weekly support priced in at 0.6828.
strong H4 close formed beneath 0.70 that’s followed up with a retest (preferably by way of a H4 bearish candlestick formation – more of a conservative route than simply selling the breakout candle) may, given the higher-timeframe setting, draw in additional shorts.
Today’s data points: Limited.
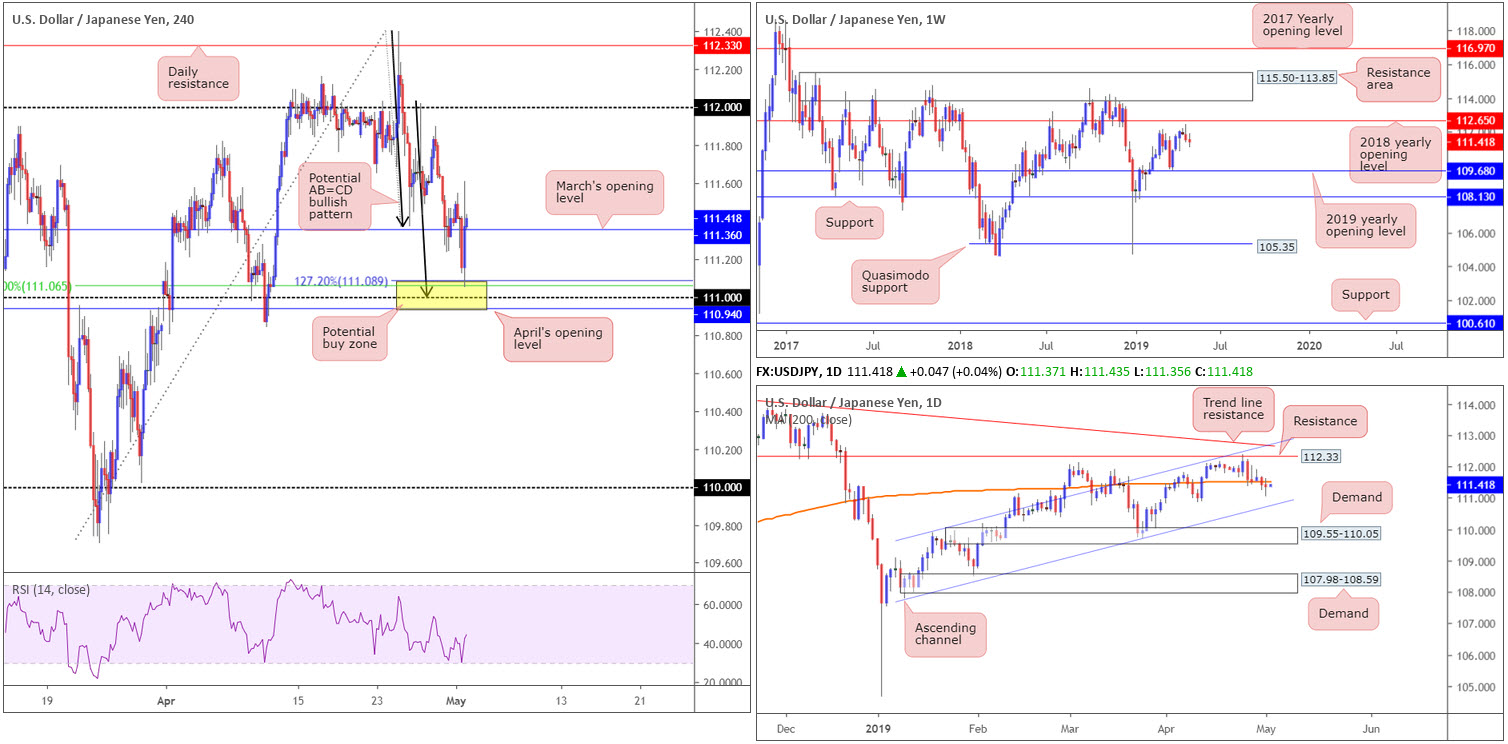
USD/JPY:
Movement on the H4 timeframe witnessed the candles dip their toes into a rather interesting area of support marked in yellow at 110.94/111.08 Wednesday (comprised of April’s opening level at 110.94, the round number 111, a 50.0% support value at 111.06 and a 127.2% AB=CD [black arrows] Fibonacci ext. point at 111.08).
An FOMC-induced rally propelled H4 price from the aforementioned zone and reclaimed March’s opening level at 111.36. Well done to any of our readers who managed to jump aboard this move. This was a noted zone to watch in Wednesday’s morning briefing.
Although buyers on the H4 timeframe reflect a bullish stance at present, daily action recently crossed below its 200-day SMA (orange) and perhaps unlocked the door for an approach towards nearby channel support etched from the low 107.77.
Areas of consideration:
For folks long this market from 110.94-111.08, taking some profits off the table and reducing risk to breakeven at this point may be an idea. Overhead, although the path is reasonably clear north on the H4 timeframe, we do have resistance by way of the 200-day SMA situated around 111.50. In the event we do push for higher ground, nevertheless, keep an eye on the 111.89 April 29, followed closely by the 112 handle.
Today’s data points: Limited.
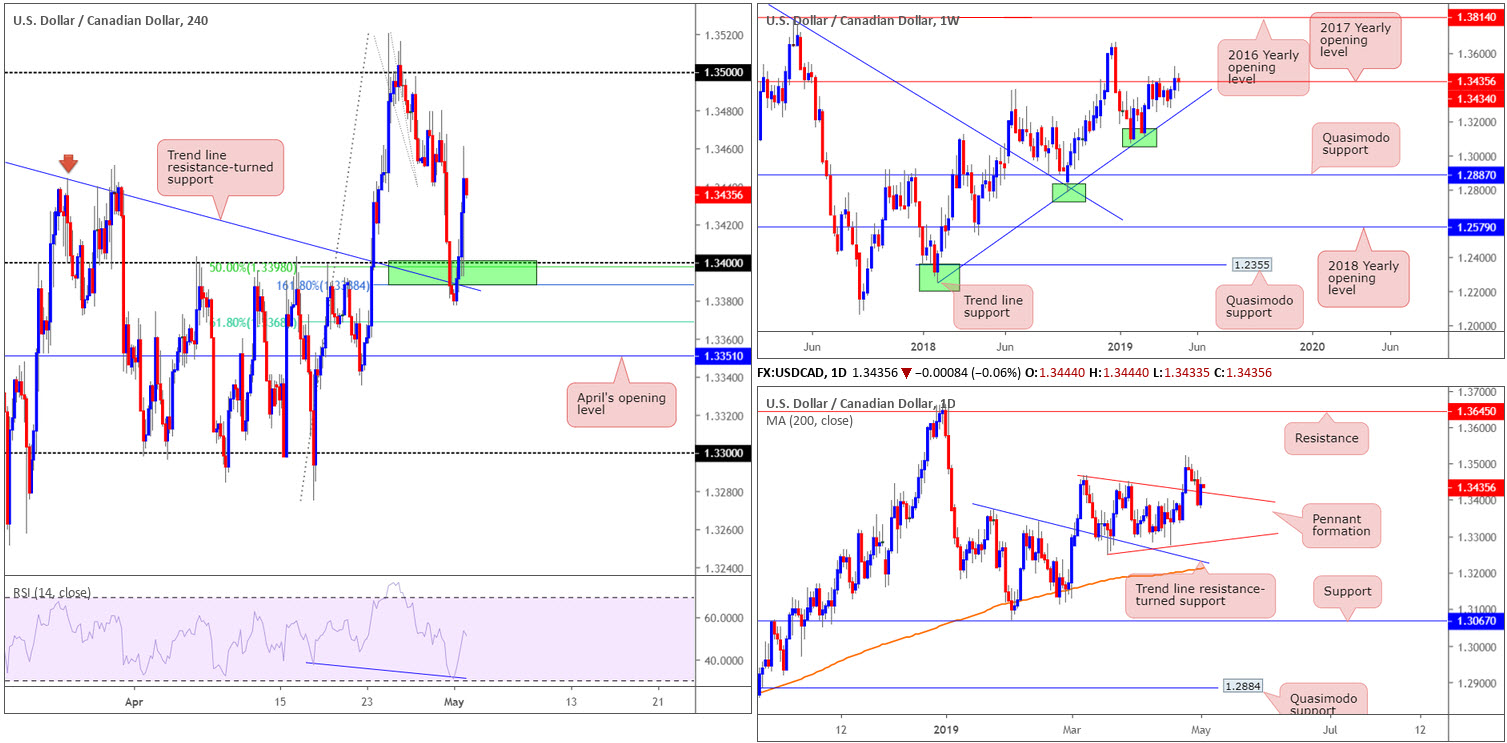
USD/CAD:
For folks who read Wednesday’s briefing you may recall the piece highlighted a potential buy zone on the H4 timeframe at 1.3388/1.34 (green). The area comprised of a round number at 1.34, a trend line resistance-turned support etched from the high 1.3443, a 161.8% Fibonacci ext. at 1.3388, a 50.0% support value at 1.3398 and also the RSI indicator (blue line) printing hidden bullish divergence (whereby price leads the way as opposed to the indicator).
The research team also added:
‘With the green H4 zone at 1.3388/1.34 being somewhat small in size, waiting for a H4 close to form back above 1.34 and buying the breakout candle (entry at the close with a stop beneath its extreme) could be an option, targeting 1.3450ish as an initial upside base’.
Well done to any of our readers who bought above 1.34 – an absolutely smashing trade offering incredible risk/reward.
In terms of where we now stand on the higher timeframes, focus on the weekly timeframe remains around the 2017 yearly opening level at 1.3434. A decline from here has nearby trend line support taken from the low 1.2247 in sight, whereas a move higher could bring in the 2018 yearly high at 1.3664.
Daily movement, as you can see, retested the top edge of a pennant formation and is so far holding ground. This, by and of itself, is likely attracting buyers into the market, with a possible take-profit target residing around resistance at 1.3645.
Areas of consideration:
Unless the market retests 1.34 again, there’s limited support available on the H4 timeframe at current price to take advantage of further upside. An alternative is to long the daily timeframe on the back of yesterday’s buying from the top edge of the pennant formation, with a stop-loss order plotted beneath yesterday’s low point at 1.3377.
Today’s data points: Limited.
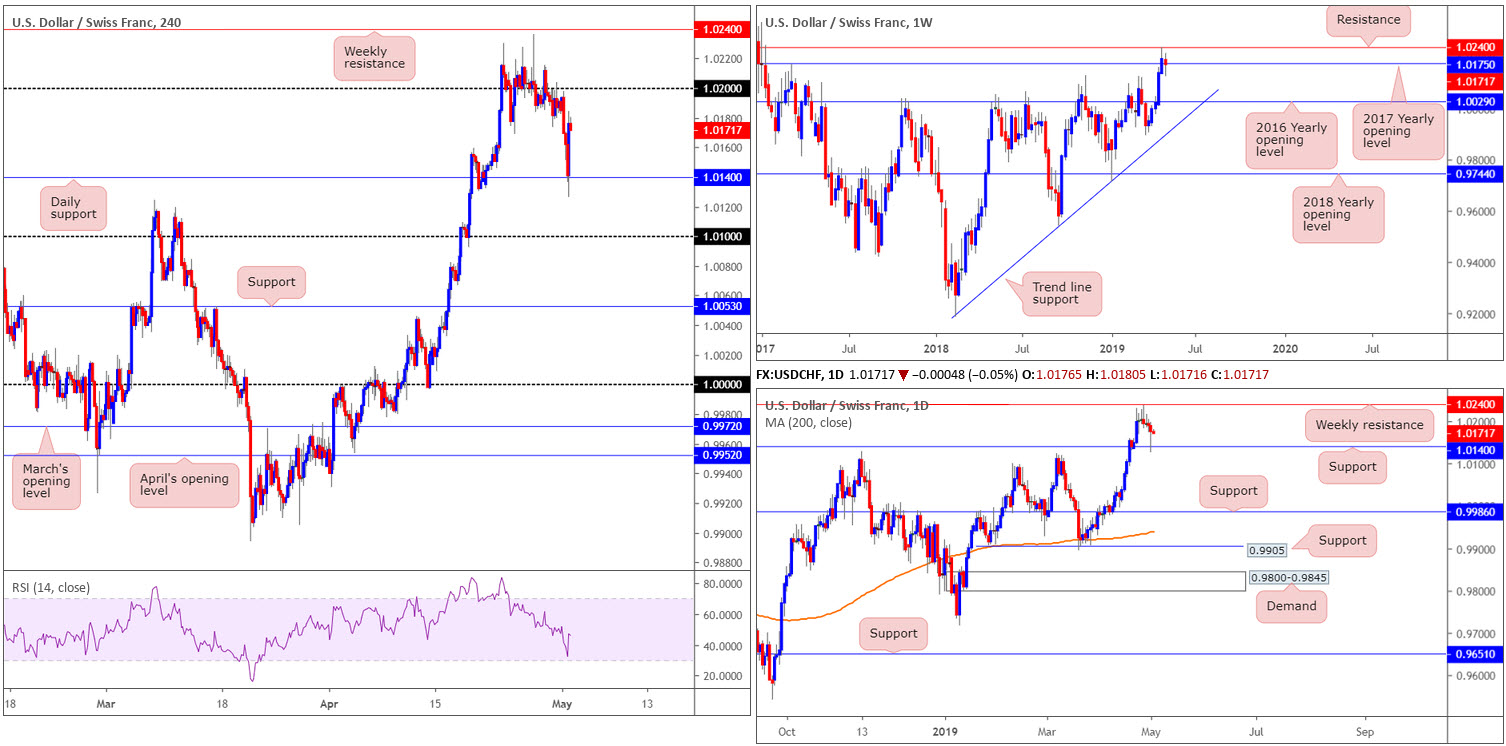
USD/CHF:
Starved of support, the H4 candles eventually broke out of a tight 1-week range around the 1.02 handle. A result of recent selling brought in daily support priced at 1.0140, which, as you can see, was aggressively defended amid FOMC-induced buying. It might also be worth noting weekly price is seen tackling its 2017 yearly opening level at 1.0175.
Areas of consideration:
Thanks to price recently tagging in daily support and weekly price establishing some ground with the 2017 yearly opening level, buyers appear to be in the driving seat at the moment. The problem, however, unless a retest of daily support is seen, is there’s limited support available on the H4 timeframe at current price.
An ideal scenario would to have the H4 candles revisit 1.0140 and chalk up a bullish candlestick pattern – think a Hammer formation or an engulfing pattern. That way, traders are able to identify buyer intent and use the candlestick’s structure to base entry and risk levels from.
Today’s data points: Limited.
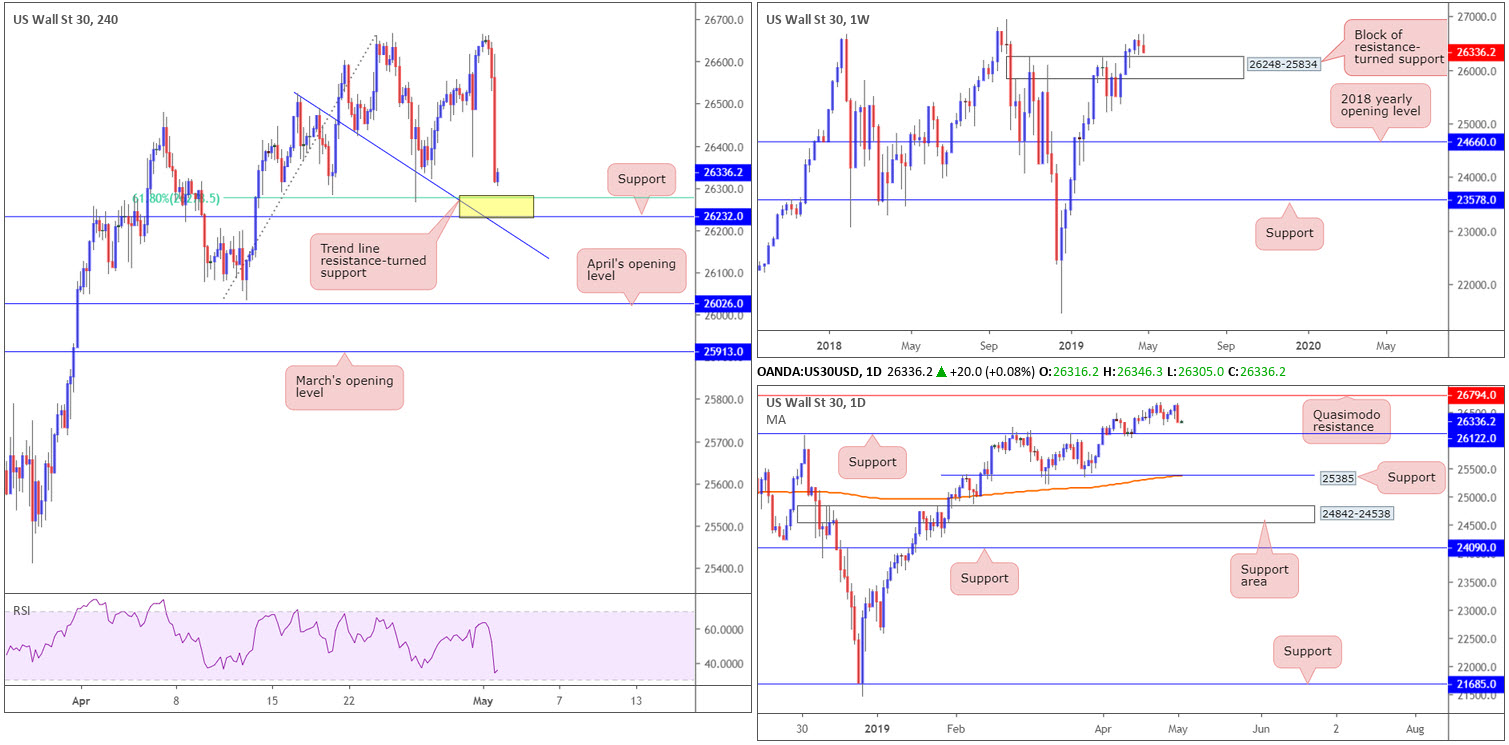
Dow Jones Industrial Average:
US equities wrapped up Wednesday’s session lower after the Federal Reserve kept interest rates unchanged, as well as Fed’s Powell acknowledging a slowdown in investment by businesses and household spending.
The Dow Jones Industrial Average dropped 299 points, down 1.12% (CFD) to 26316.
From a technical perspective, the H4 candles are now within close range of support at 26232 and a 61.8% Fibonacci support value at 26277. Further adding to this, a nearby trend line resistance turned support (26525) is also seen merging closely with the two said supports, and the RSI indicator is seen approaching its oversold value.
In view of the higher timeframes, weekly price is hovering just north of a resistance-turned support area coming in at 26248-25834. Further buying from this point has the all-time high of 26939 to target. Located within the top region of the current support zone on the weekly timeframe, daily structure displays support at 26122. To the upside, however, a Quasimodo resistance is present at 26794.
Areas of consideration:
The yellow zone highlighted on the H4 timeframe between 26232/26277 is likely of interest to some traders this morning. Not only is it formed by a H4 support, a 61.8% H4 Fibonacci support and a H4 trend line resistance-turned support, the area holds within it the top edge of the weekly support area at 26248. Therefore, should the market print a notable H4 or H1 bullish candlestick formation from this area today (entry and risk parameters can be defined according to the selected candlestick’s rules of engagement), a long could be a consideration.
Today’s data points: Limited.
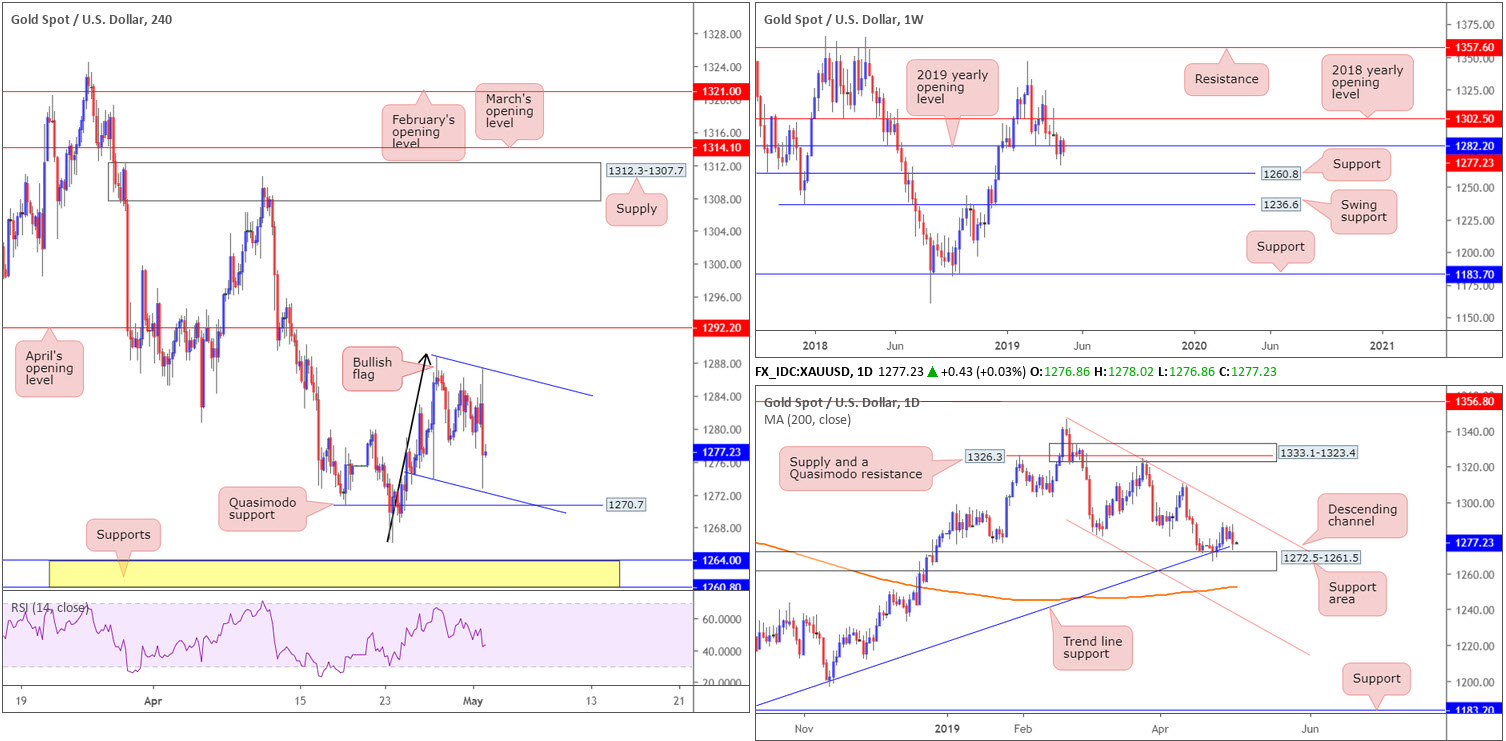
XAU/USD (GOLD):
Kicking this morning’s report off from the top, the research team notes the price of gold reflects a mild bearish stance on the weekly timeframe. In recent sessions, the unit has remained beneath its 2019 yearly opening level at 1282.2, possibly setting the runway for a move towards support priced in at 1260.8.
Contrary to weekly structure, the yellow metal remains bolstered by a support area coming in at 1272.5-1261.5, and a merging trend line support etched from the low 1160.3 on the daily timeframe. The next upside target from current price rests at a channel resistance drawn from the high 1346.7.
A closer reading of price action on the H4 timeframe shows bullion compressing within the limits of a bullish flag pattern (1288.7/1273.9). Areas outside of this border are the Quasimodo support at 1270.7, followed by two nearby supports (yellow) at 1260.8/1264.0) and April’s opening level at 1292.2 (resistance).
Areas of consideration:
Having observed daily price garnering support out of 1272.5-1261.5, the current H4 bullish flag is likely to keep forming today. This, by and of itself, opens up possible long opportunities off its lower boundary, targeting the opposing limit, closely followed by April’s opening level at 1292.2 should we break out to the upside.
In terms of trade management, traders may wish to enter long at the lower boundary of the H4 flag and position stops beneath the apex of the Quasimodo support (1266.1).
The accuracy, completeness and timeliness of the information contained on this site cannot be guaranteed. IC Markets does not warranty, guarantee or make any representations, or assume any liability with regard to financial results based on the use of the information in the site.
News, views, opinions, recommendations and other information obtained from sources outside of www.icmarkets.com.au, used in this site are believed to be reliable, but we cannot guarantee their accuracy or completeness. All such information is subject to change at any time without notice. IC Markets assumes no responsibility for the content of any linked site. The fact that such links may exist does not indicate approval or endorsement of any material contained on any linked site.
IC Markets is not liable for any harm caused by the transmission, through accessing the services or information on this site, of a computer virus, or other computer code or programming device that might be used to access, delete, damage, disable, disrupt or otherwise impede in any manner, the operation of the site or of any user’s software, hardware, data or property.


