
A note on lower timeframe confirming price action…
Waiting for lower timeframe confirmation is our main tool to confirm strength within higher timeframe zones, and has really been the key to our trading success. It takes a little time to understand the subtle nuances, however, as each trade is never the same, but once you master the rhythm so to speak, you will be saved from countless unnecessary losing trades. The following is a list of what we look for:
- A break/retest of supply or demand dependent on which way you’re trading.
- A trendline break/retest.
- Buying/selling tails/wicks – essentially we look for a cluster of very obvious spikes off of lower timeframe support and resistance levels within the higher timeframe zone.
- Candlestick patterns. We tend to only stick with pin bars and engulfing bars as these have proven to be the most effective.
We search for lower timeframe confirmation between the M15 the H1 timeframes, since most of our higher-timeframe areas begin with the H4. Stops are usually placed 5-10 pips beyond confirming structures.
EUR/USD:
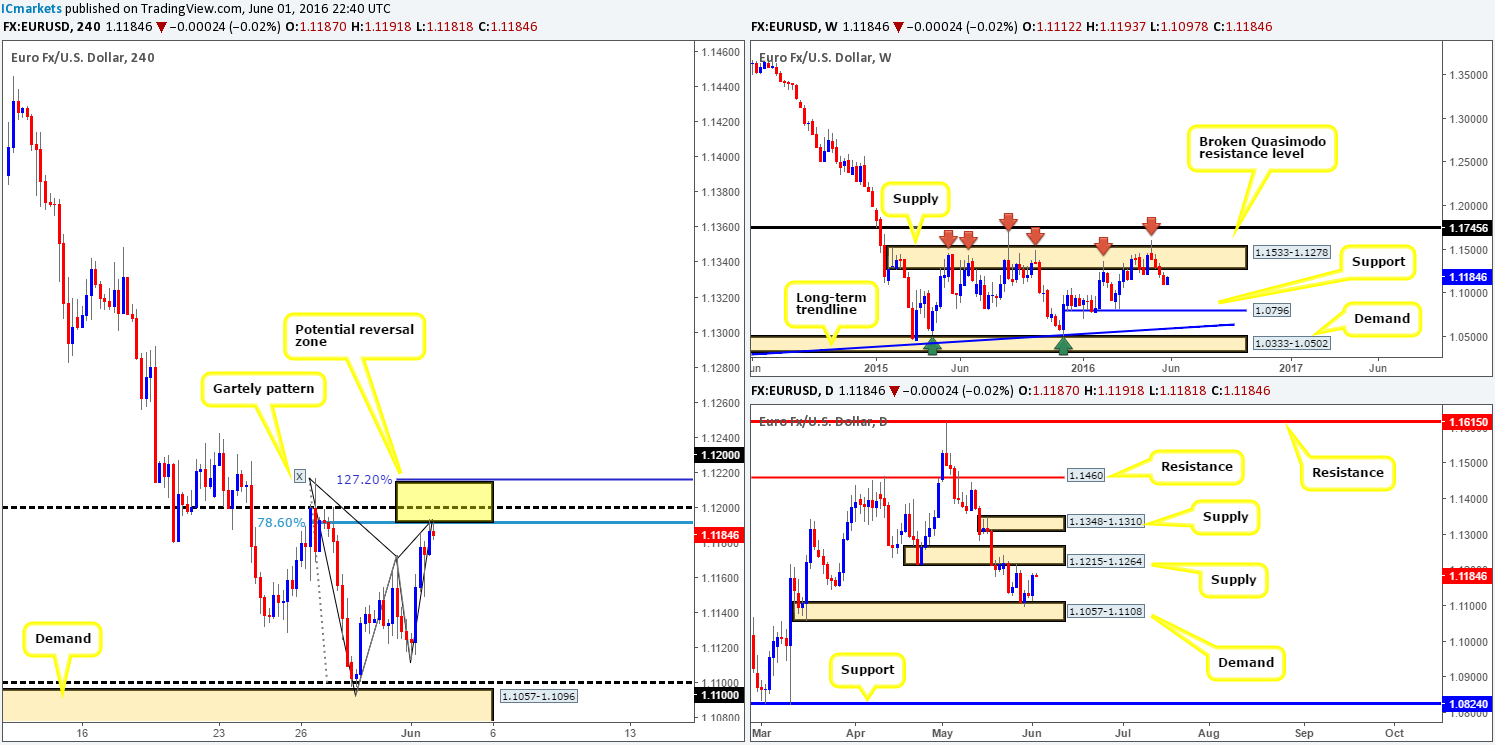
The value of the EUR strengthened during yesterday’s trading, bringing price to highs of 1.1193 on the day. What this also did, as can be seen from the H4 chart, was form a nice-looking H4 Harmonic bearish Gartley pattern – the potential reversal zone (PRZ – yellow box) can be drawn from 1.1216/1.1191.
From where we’re standing, this is a very high-probability sell zone for the following reasons:
- The H4 Harmonic pattern is bolstered by daily supply at 1.1215-1.1264.
- Recently came off of a strong move from a weekly supply area seen at 1.1533-1.1278.
- The psychological number 1.12 is positioned within the Gartley PRZ.
Our suggestions: Usually, we would look to short this pattern without lower timeframe confirmation given the higher timeframe confluence. However, for a pending order to be placed we absolutely need all structures to fuse beautifully. The only grumble we have in this particular situation is the fact that the USDX (U.S. Dollar index) shows a major-league H4 support around the 95.20 region, and when current price in this market stands at 95.42, it’s a little concerning. With that being the case, the USDX could potentially drop lower to connect with this barrier, thus pushing the EUR higher. Now, as far as we’re concerned, all this means is instead of entering at market we’re going to attempt to enter with lower timeframe confirmation once/if price drives higher into our Gartley PRZ.
For ways of confirming a higher timeframe zone, we look for a lower timeframe demand to be engulfed and retested, a trendline break/retest or a collection of selling wicks preferably forming around a lower timeframe resistance. We search for lower timeframe confirmation between the M15 the H1 timeframes, since most of our higher-timeframe areas begin with the H4. Stops are usually placed 5-10 pips beyond confirming structures.
Levels to watch/live orders:
- Buys: Flat (Stop loss: N/A).
- Sells: 1.1216/1.1191 [Tentative – confirmation required] (Stop loss: dependent on where one confirms this area).
GBP/USD:
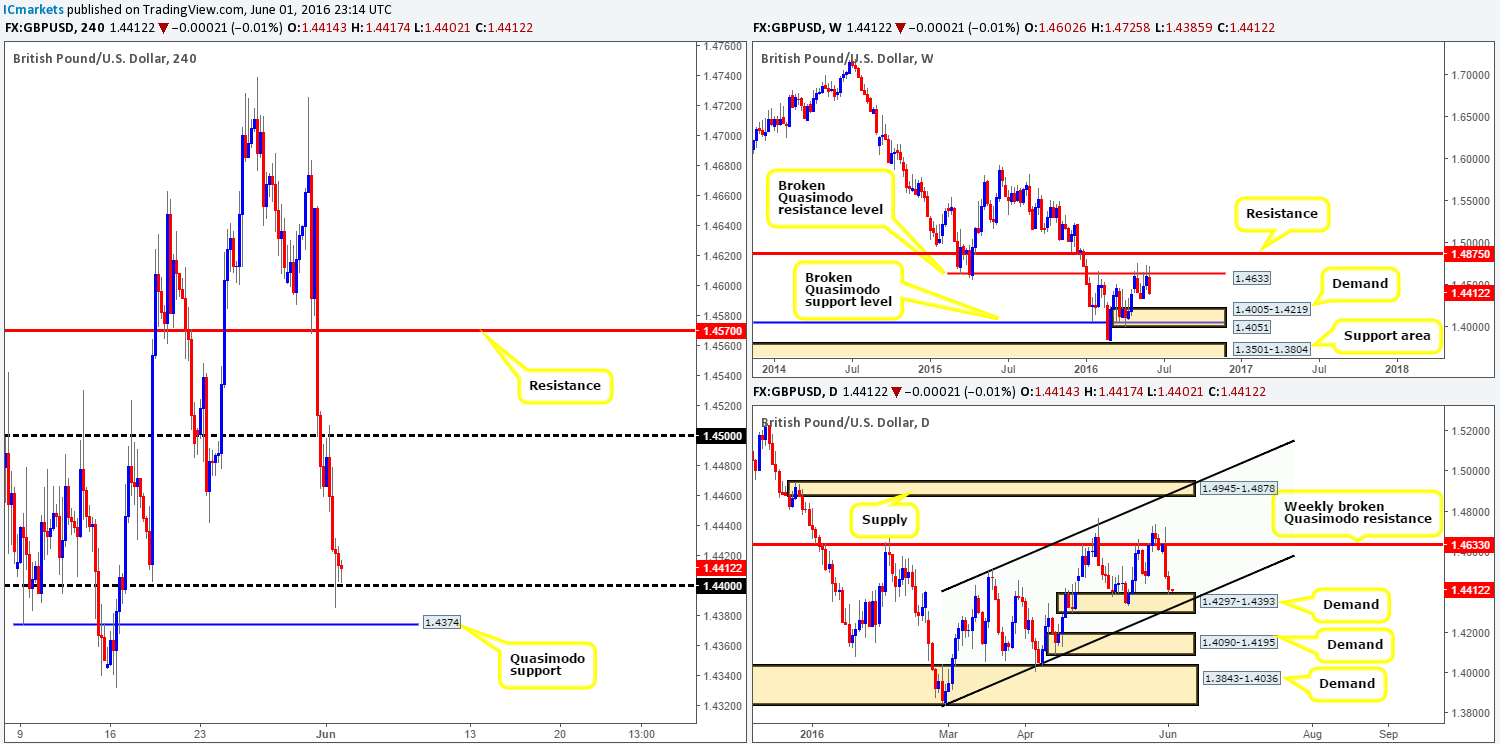
Starting with the weekly chart this morning, it’s clear to see that the bears are once again stamping in their authority from the weekly broken Quasimodo barrier (BQM) seen at 1.4633. In the event that this continues, the next downside target to have an eyeball on is weekly demand penciled in at 1.4005-1.4219. However, looking down on the daily chart, demand at 1.4297-1.4393 (converges with daily channel support extended from the low 1.3835) has recently been brought into view thanks to increased selling pressure from the above said weekly level.
With H4 price seen retesting the 1.45 handle as resistance yesterday, and then plummeting 100-pips lower to test 1.44, where do we go from here? Well, as we can all see, for now 1.44 is holding firm. Despite this, we have no interest in buying from 1.44 today since there is little response being seen from this number, and there is a nice-looking H4 Quasimodo support lurking just below at 1.4374.
Our suggestions: Watch for price to break through 1.44 today and connect with the aforementioned H4 Quasimodo support line to enter long. Although the H4 Quasimodo is housed within the current daily demand zone, one still has to tread carefully here due to what’s been noted on the weekly chart above. Therefore, the best thing we can do is to enter only if there is a lower timeframe buy signal seen (see the top of this report for ways of confirming higher timeframe zones).
Levels to watch/live orders:
- Buys: 1.4374 region [Tentative – confirmation required] (Stop loss: dependent on where one confirms this area).
- Sells: Flat (Stop loss: N/A).
AUD/USD:
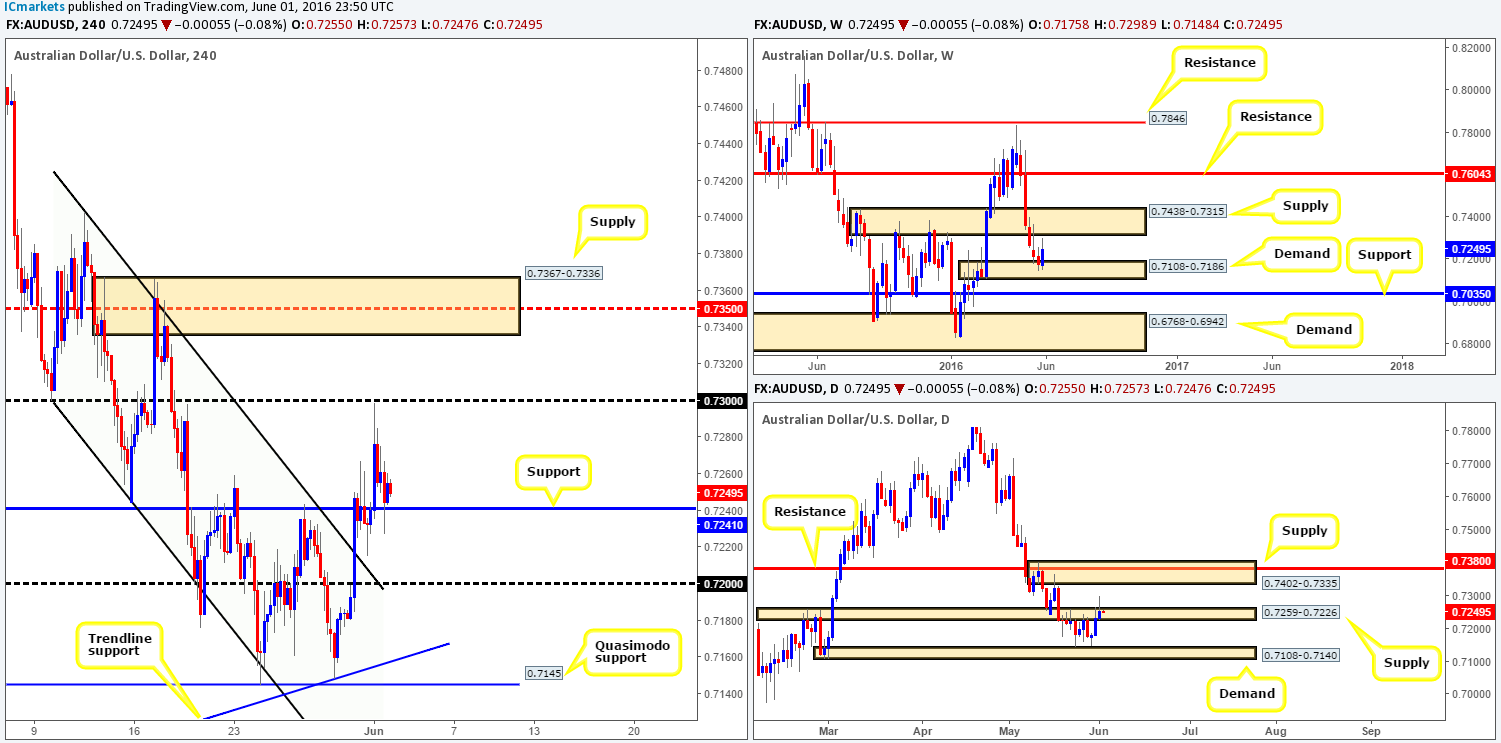
Using a top-down approach this morning, it can be seen that weekly action recently came within touching distance of connecting with weekly supply at 0.7438-0.7315, following a bounce from weekly demand at 0.7108-0.7186. On the other side of the ledger, daily price aggressively whipsawed through a daily supply zone at 0.7259-0.7226, and has likely consumed a truckload of stops in the process! The next area beyond this zone falls in at 0.7402-0.7335 – another supply area which is lodged deep within the above said weekly supply base.
Stepping across to the H4 chart, one can see that price made a quick run to highs of 0.7298 in the early hours of yesterday morning, before collapsing to lows of 0.7227. With the commodity currency currently respecting H4 support coming in at 0.7241, is this a line worth entering long from?
Our suggestions: To our way of seeing things right now, trading long from the current H4 support is certainly something to consider today, since the path north on the daily chart is possibly clear for further upside (see above). It is, however, not a setup we would label high probability due to price coming so close to hitting the aforementioned weekly supply! Therefore, we would highly recommend waiting for a lower timeframe buy setup to form around the 0.7241 region before risking capital on this idea (see the top of this report for ways of confirming higher timeframe zones). Should one manage to net a position long from here, we’d personally be looking to take partial profits at the 0.73 handle and reducing risk to breakeven.
Levels to watch/live orders:
- Buys: 0.7241 region [Tentative – confirmation required] (Stop loss: dependent on where one confirms this area).
- Sells: Flat (Stop loss: N/A).
USD/JPY:
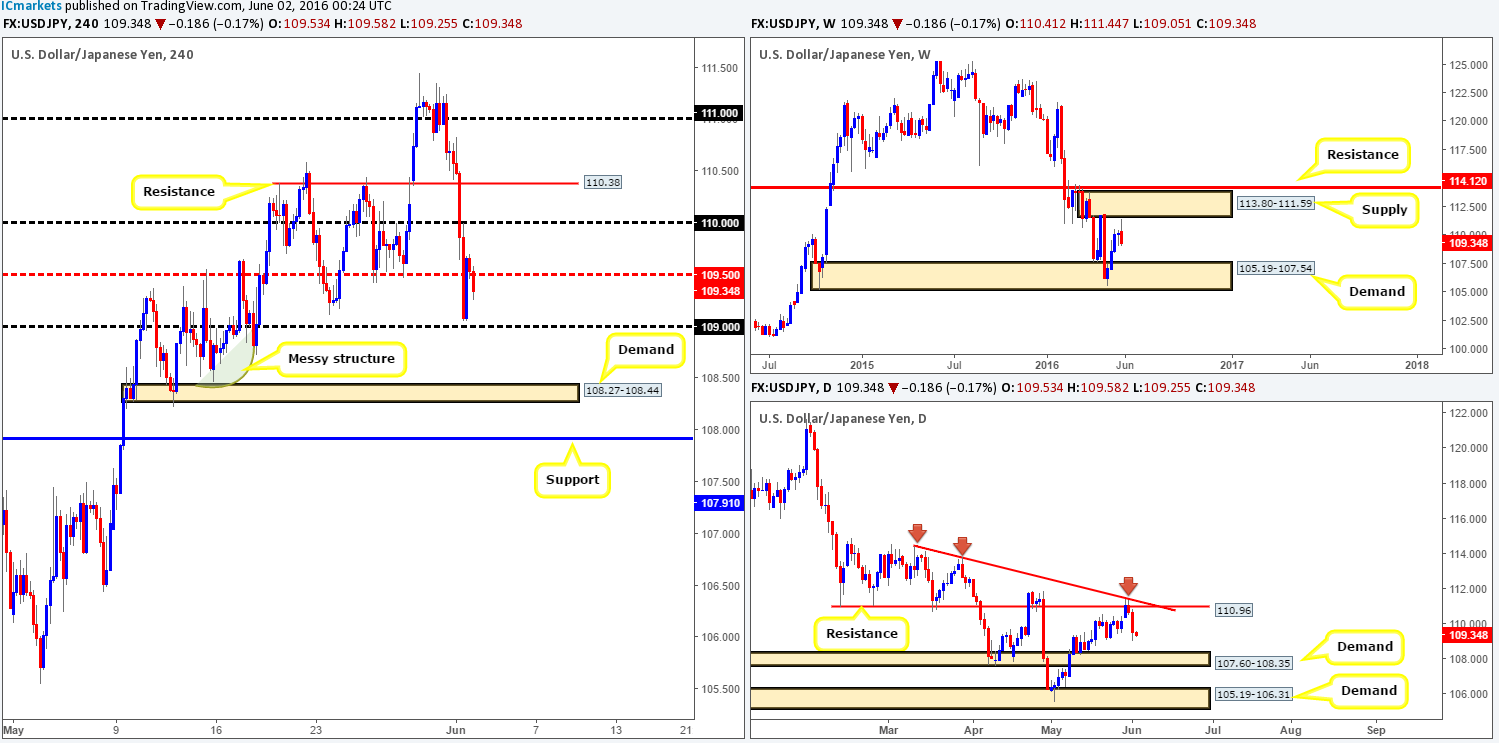
An unrelenting squeeze to the downside took place yesterday, weighed on heavily by the Japanese Prime Minister Shinzo Abe announcing that the planned sales tax increase is to be delayed. Several H4 technical supports were engulfed during this bearish onslaught with price bottoming out just ahead of the 109 handle going into the American session.
Although there was a clear fundamental driver to this recent surge in Yen buying, technicians should have been prepared for this as well! Of late price has been lingering very close to weekly supply at 113.80-111.59, along with a converging daily resistance line at 110.96 and daily trendline resistance taken from the high114.44.
Given the higher timeframe picture, our team is now looking for price to cut through the 109 number today, since beyond here there’s little structure stopping price from connecting with H4 demand at 108.27-108.44 (lodged just within daily demand at 107.60-108.35), followed closely by H4 support at 107.91 (also positioned within the aforementioned daily demand).
Our suggestions: Watch for price to close below 109 and look to trade any retest seen thereafter, targeting the above said levels in bold. Waiting for lower timeframe confirmation to form following the retest is a MUST for us, as this usually avoids being whipsawed out of a position (see the top of this report for ways of confirming higher timeframe zones).
Levels to watch/live orders:
- Buys: Flat (Stop loss: N/A).
- Sells: Watch for price to consume 109 and then look to trade any retest seen thereafter (lower timeframe confirmation required).
USD/CAD:
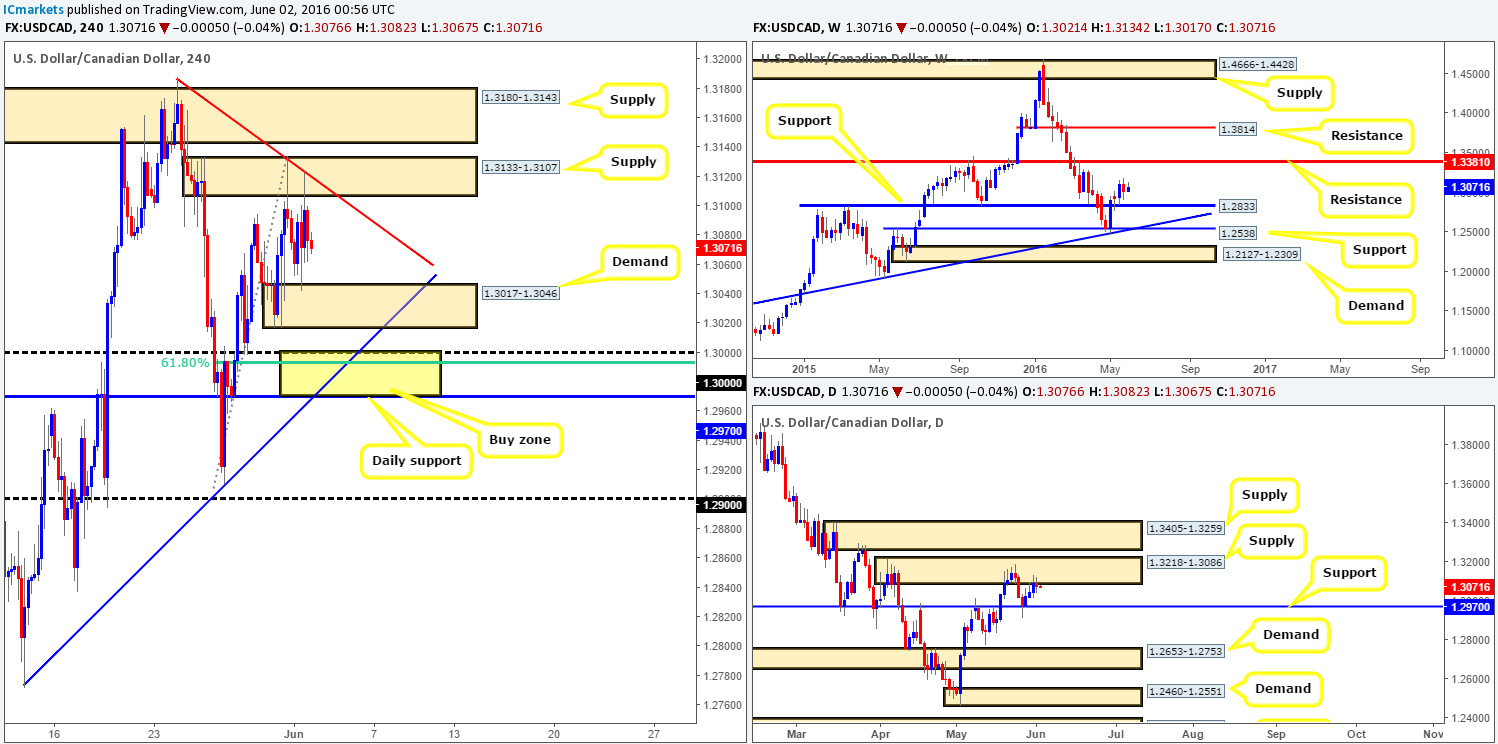
Beginning with the weekly chart this morning, price, as you can see, continues to loiter between weekly resistance drawn from 1.3381 and a weekly support coming in at 1.2833. Meanwhile, daily action is still flirting with the underside of daily supply chalked up at 1.3218-1.3086, with the next downside target sitting nearby at 1.2970 – a daily support.
Looking at yesterday’s action on the H4 chart, however, the Loonie is now seen capped by a H4 supply area seen at 1.3133-1.3107 and a H4 demand carved from 1.3017-1.3046. Although both areas have intersecting H4 trendlines and the H4 supply is bolstered by the aforementioned daily supply, we are not interested in trading these zones today. What we are interested in, as we mentioned in yesterday’s report, is the H4 buy zone (yellow box) at 1.2970/1.30 due to the following converging structures:
- Daily support at 1.2970.
- The large psychological boundary 1.30.
- H4 trendline support extended from the low 1.2771.
- H4 61.8% Fibonacci support at 1.2978.
In regards to entering at this zone, waiting for lower-timeframe confirmation is still the more preferred route to take, as weekly price could jab lower to connect with weekly support at 1.2833 and essentially ignore our buy zone.
Levels to watch/live orders:
- Buys: 1.2970-1.3000 [Tentative – confirmation required] (Stop loss: dependent on where one confirms this area).
- Sells: Flat (Stop loss: N/A).
USD/CHF:
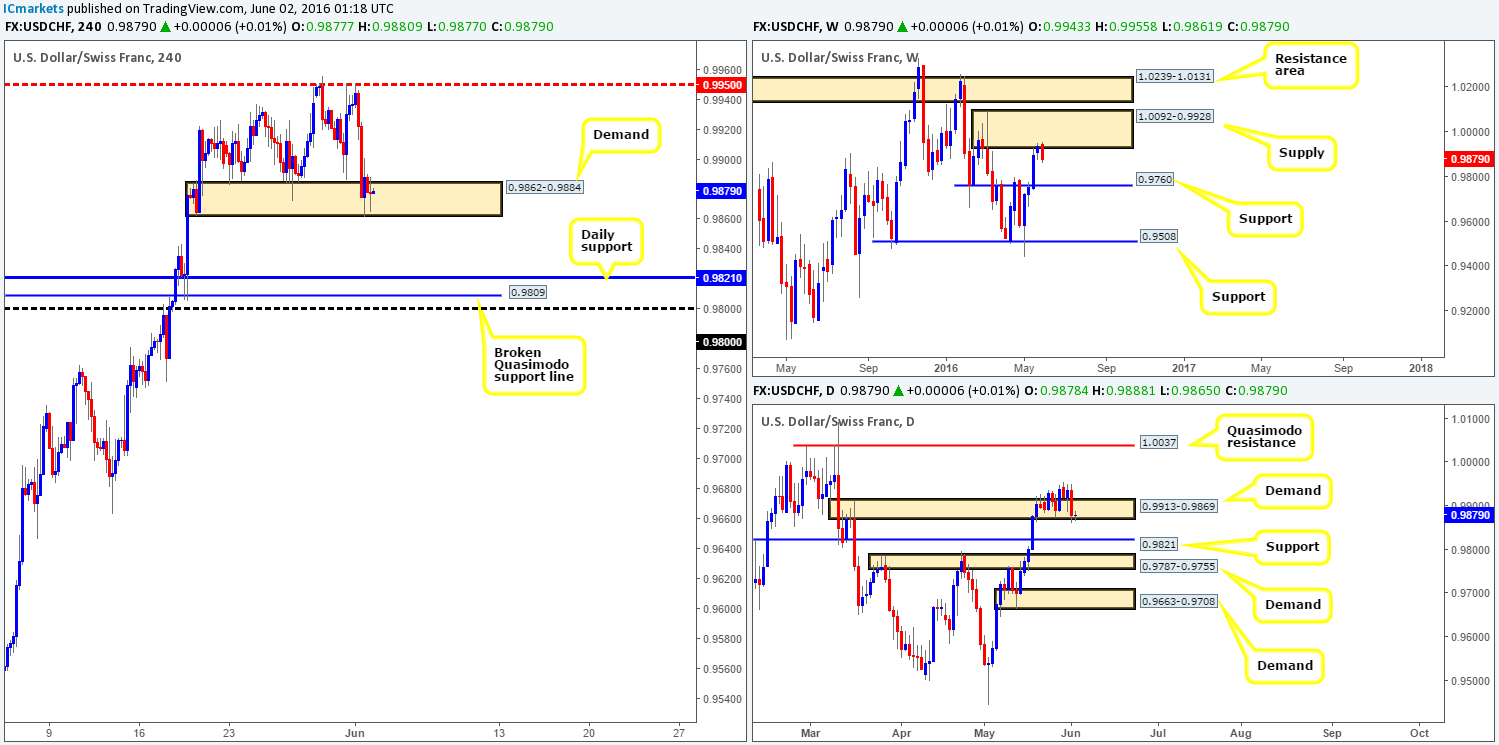
The USD/CHF once again failed to muster enough strength to push above the H4 mid-way resistance 0.9950 yesterday, as this market plowed lower from here going into London trading, bringing price into the jaws of a H4 demand at 0.9862-0.9884. This area is currently on very shaky ground in opinion. Not only has this zone seen a rather muted response on the H4, but to buy from here, you’d be trading against weekly sellers from weekly supply seen at 1.0092-0.9928. In addition to this, daily demand at 0.9913-0.9869 was recently spiked, thus opening up the possibility to further downside towards daily support at 0.9821.
Our suggestions: Watch for price to close below the current H4 demand and look to trade any retest of this area thereafter, targeting the 0.9800/0.9821 region (psychological support 0.9800, broken H4 Quasimodo line support at 0.9809 and a daily support at 0.9821).
Levels to watch/live orders:
- Buys: Flat (Stop loss: N/A).
- Sells: Watch for price to consume 0.9862-0.9884 and then look to trade any retest seen thereafter (lower timeframe confirmation required).
DOW 30:
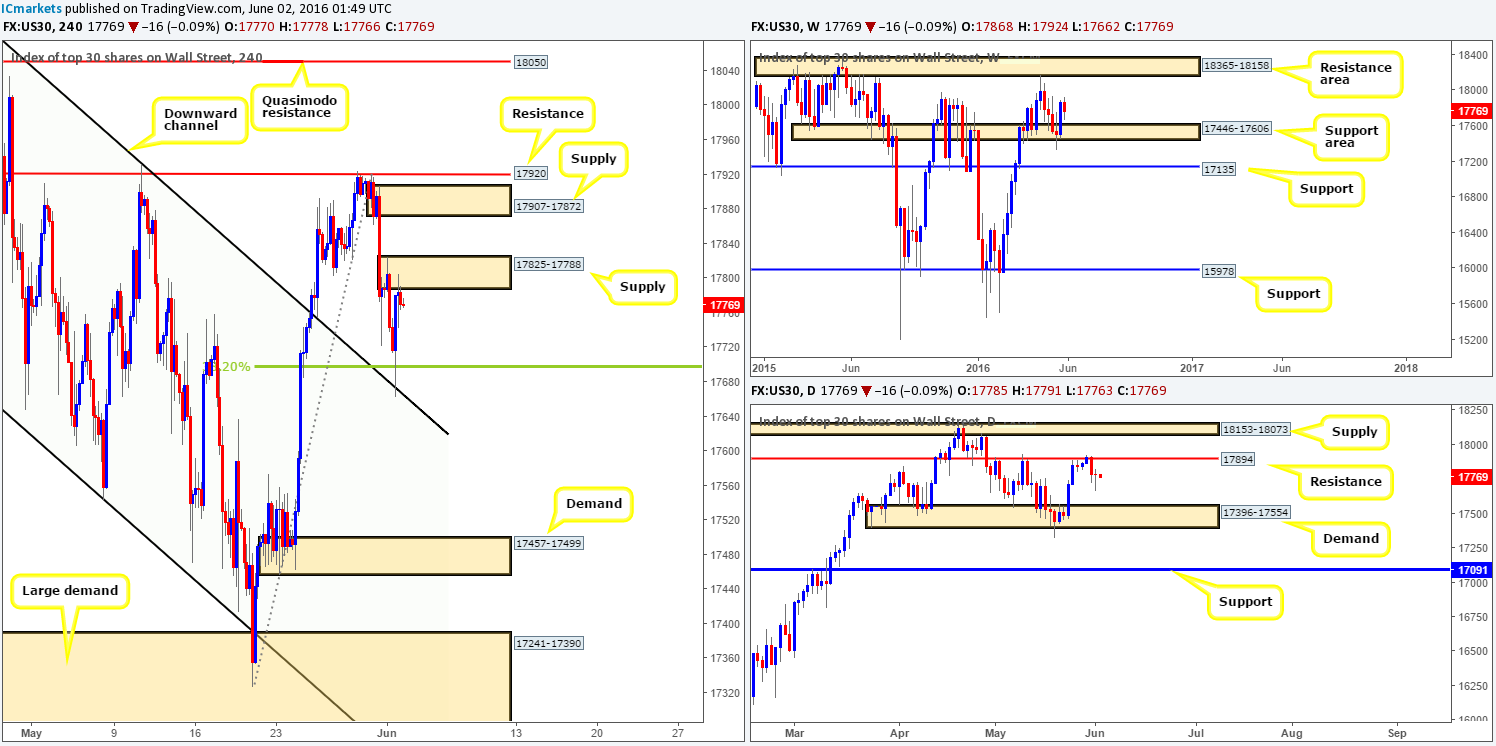
Looking at the weekly chart, it is clearly seen that the buyers have so far struggled to uphold last week’s bullish advance from the weekly support area carved from 17446-17606. This very likely has something to do with the fact that offers have been holding firm around a daily resistance level at 17894 since the beginning of this week. What is more, from this timeframe there is scope for further selling down to a daily demand base seen at 17396-17554, so we may see more depreciation in this market yet!
Over on the H4 chart, however, a pocket of bids were filled yesterday around the 17680 region, bolstered by a H4 channel resistance-turned support (18167) and a 38.2% H4 Fibonacci support at 17697. This, as can be seen from the chart, quickly brought the DOW up to H4 supply at 17825-17788, which is currently holding firm.
Our suggestions: Trading from the H4 supply in play right now is certainly a possibility since price has, as we mentioned above, recently come off of a daily resistance line at 17894. However, there is always the chance that the weekly bulls may kick back into action, so we would highly recommend only selling this market together with a lower timeframe confirming signal (see the top of this report for ideas on confirmation). Although a pending order, if filled of course, guarantees you a position in this market, we feel, especially under the current circumstances, waiting for that extra bit of confirmation is worthwhile.
Levels to watch/live orders:
- Buys: Flat (Stop loss: N/A).
- Sells: 17825-17788 [Tentative – confirmation required] (Stop loss: dependent on where one confirms this area).
Gold:
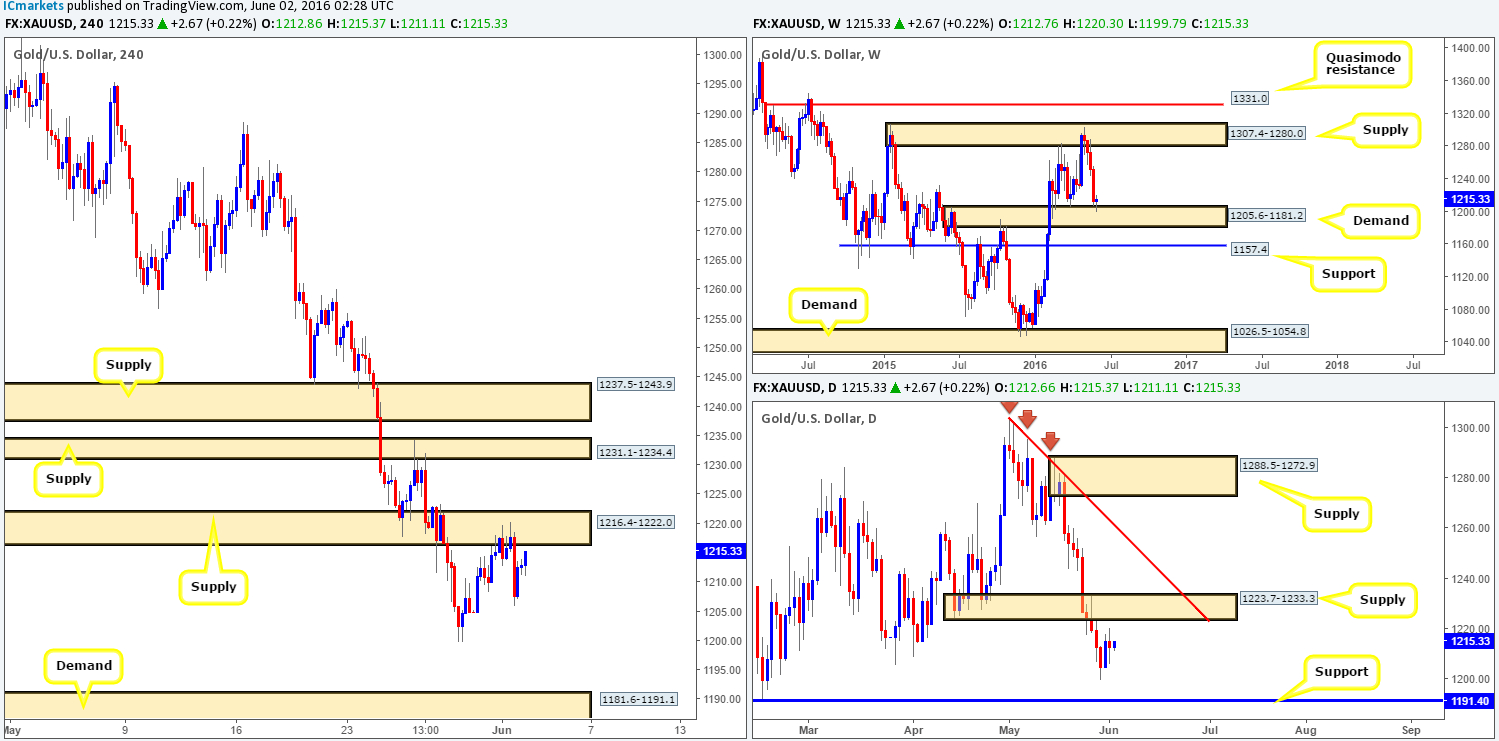
During the course of yesterday’s sessions, we saw the buyers and sellers battle for position within H4 supply at 1216.4-1222.0. It was only until the U.S. session opened for business did we see the sellers take charge and push the yellow metal to lows of 1205.8 which since then slightly reversed tracks into the close. Personally, we have zero interest in selling from this H4 supply due to the following reasons:
- The H4 supply above at 1231.1-1234.4 is lodged within the extremes of a daily supply base coming in at 1223.7-1233.3, thus making it a safer base to look for shorts rather than the current area.
- Weekly price has recently found a floor of bids around a weekly demand area at 1205.6-1181.2.
With the above in mind, one could look to short from the H4 supply zone at 1231.1-1234.4. It would still be a risky trade in our book, however, since you’d not only be going against potential weekly buying, but there’s also a possibility that price may fake higher to connect with neighboring H4 supply just above at 1237.5-1243.9.
We have not been fond of Gold for a while now as price action has not been able to find a balance. If we buy, we try to always look for room for price to move, and vice versa when selling. The only area that really has taken our fancy over the past few days is H4 demand at 1181.6-1191.1. Reason being is this zone sits just below daily support at 1191.40, and is also located within the depths of the above said weekly demand. Therefore, once/if price reaches this low, our team will look at buying this market, but for now, we are happy sitting on the sidelines for the time being.
Levels to watch/live orders:
- Buys: 1181.6-1191.1 [Entering from here at market is a possibility] (Stop loss: 1180.3).
- Sells: Flat (Stop loss: N/A).


