
EUR/USD:
As expected, the FOMC kept rates unchanged between 1.75-2.00% on Wednesday, and made minor tweaks to its policy statement. Risk sentiment overshadowed the Fed’s announcement as the US is expected to apply a 25% tariffs on $200B of Chinese goods. In terms of recent US data, ISM manufacturing slipped to a 12-month low, missing expectations (58.1 vs consensus 59.4 vs prior 60.2). The ADP also reported 219k jobs were added to the US economy in July, beating consensus seeking 185k.
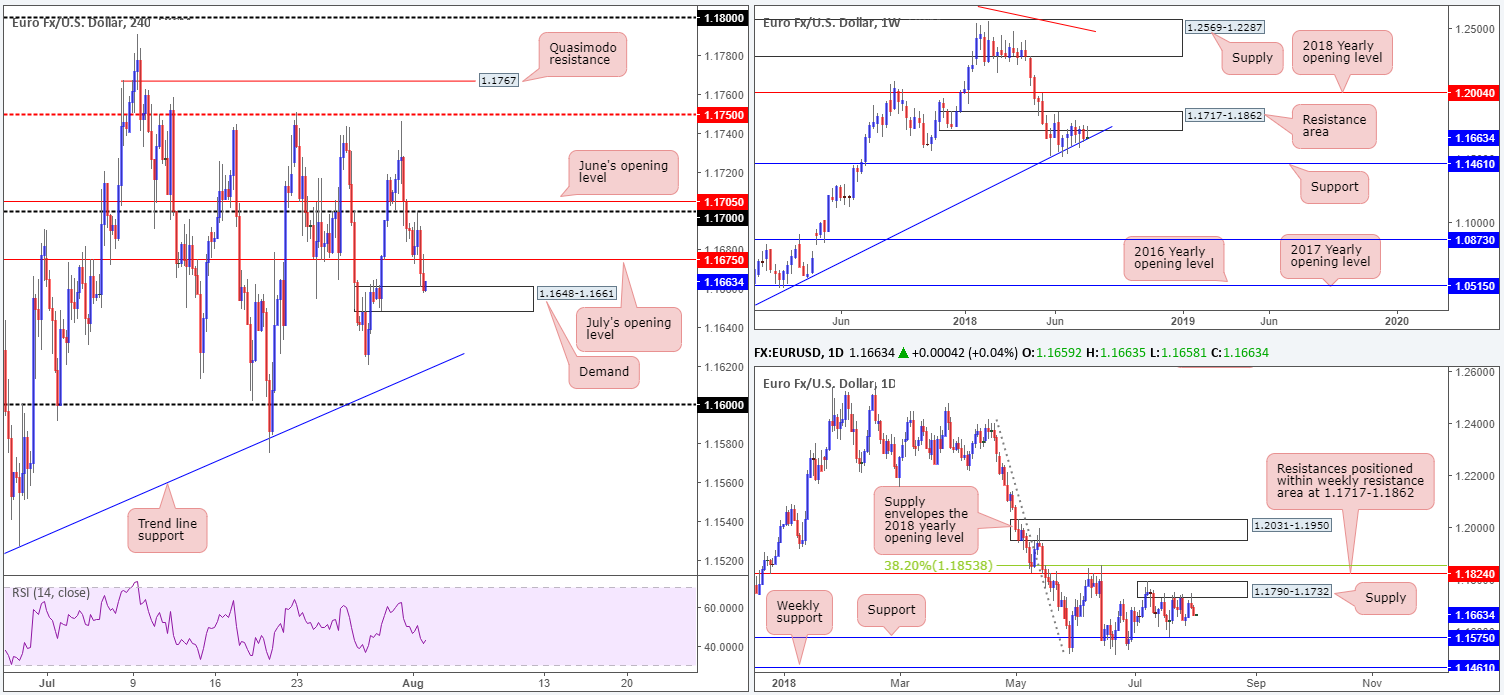
Technicals witnessed a breach of July’s opening level on the H4 timeframe at 1.1675 (now acting resistance), consequently guiding the candles toward demand positioned at 1.1648-1.1661. Meanwhile, weekly action is seen testing trend line support (etched from the low 1.0340), after selling off from a nearby resistance area plotted at 1.1717-1.1862. In terms of daily flow, trade extended losses from supply at 1.1790-1.1732 yesterday, an area clearly of interest in this market at the moment. The nice-looking bearish pin-bar candle formation created on Tuesday likely helped encourage sellers into the market. Further downside from this point has support etched in at 1.1575 to target.
Areas of consideration:
H4 demand mentioned above at 1.1648-1.1661 has likely caught the eye of traders, given its strong upside momentum. What’s also interesting is this area converges with the aforementioned weekly trend line support almost to the pip. The only grumble, of course, is daily movement threatening to push lower (see above) and neighboring resistance at 1.1675 on the H4 timeframe (July’s opening level).
Whether or not one believes a long from the current demand is valid is ultimately down to the individual trader. In our humble opinion, though, resistance is too close to consider longs: one has 14 pips of room to play with between the top edge of the demand (1.1661) and the next potential level of resistance (1.1675)!
Today’s data points: US unemployment claims.
GBP/USD:
Sterling concluded Wednesday’s session unchanged, hovering between H4 mid-level resistance at 1.3150 and the 1.31 handle. This ranging action is likely to continue ahead of today’s BoE rate decision, where it is expected to lift rates by 25bps.
Owing to yesterday’s lackluster performance, much of the following analysis will echo thoughts put forward in Wednesday’s report…
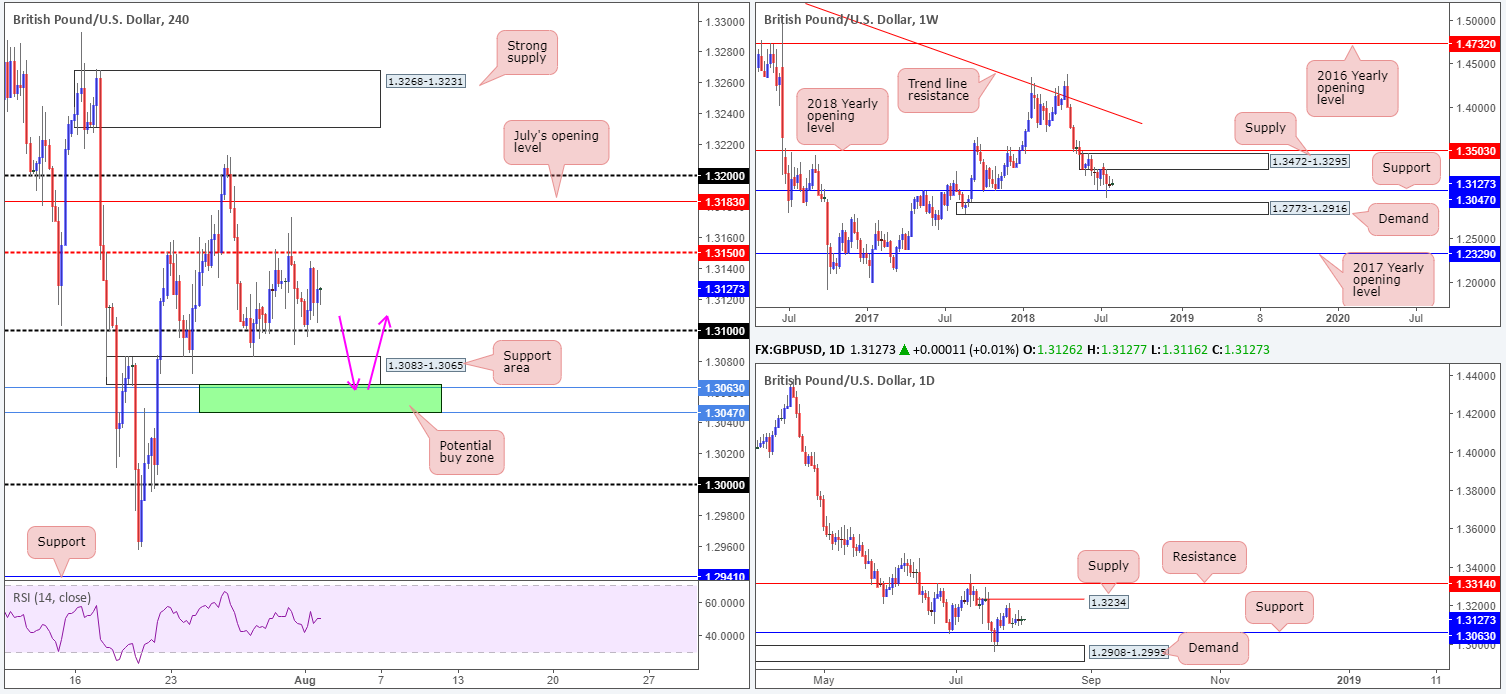
With stop-loss orders likely tripped beneath 1.31, traders’ crosshairs are now likely fixed on the H4 support area drawn in at 1.3083-1.3065.
Technically speaking, higher-timeframe flows show weekly price remains buoyant above support at 1.3047, a barrier displaying history as far back as mid-2015. Daily price, on the other hand, continues to drift between a supply seen at 1.3234 and support priced in at 1.3063.
Areas of consideration:
On account of the above reading, the team still believes the market has a soft spot for the small H4 area marked in green at 1.3047/1.3063 as a possible buy zone, comprised of both the aforementioned weekly and daily supports. Besides its construction being made up of higher-timeframe levels, stop-loss orders beneath 1.31 and the noted H4 support area will also likely provide liquidity to those with big pockets looking to buy from here.
The first ‘trouble’ area from 1.3047/1.3063 can be seen at 1.31. A H4 close above this barrier would be an ideal cue to begin thinking about taking some profit off the table and reducing risk to breakeven.
Aggressive traders may look to buy the top edge (1.3063) at market with stop-loss orders tucked beneath the zone at 1.3045. Conservative traders, however, might want to consider holding fire and waiting for a H4 full or near-full-bodied bull candle to form (stops beneath the candle’s rejection tail) before pulling the trigger.
Today’s data points: UK construction PMI; BoE policy decision, minutes, quarterly inflation report and press conference (BoE Gov. Carney); US unemployment claims.
AUD/USD:
Structure is unchanged.
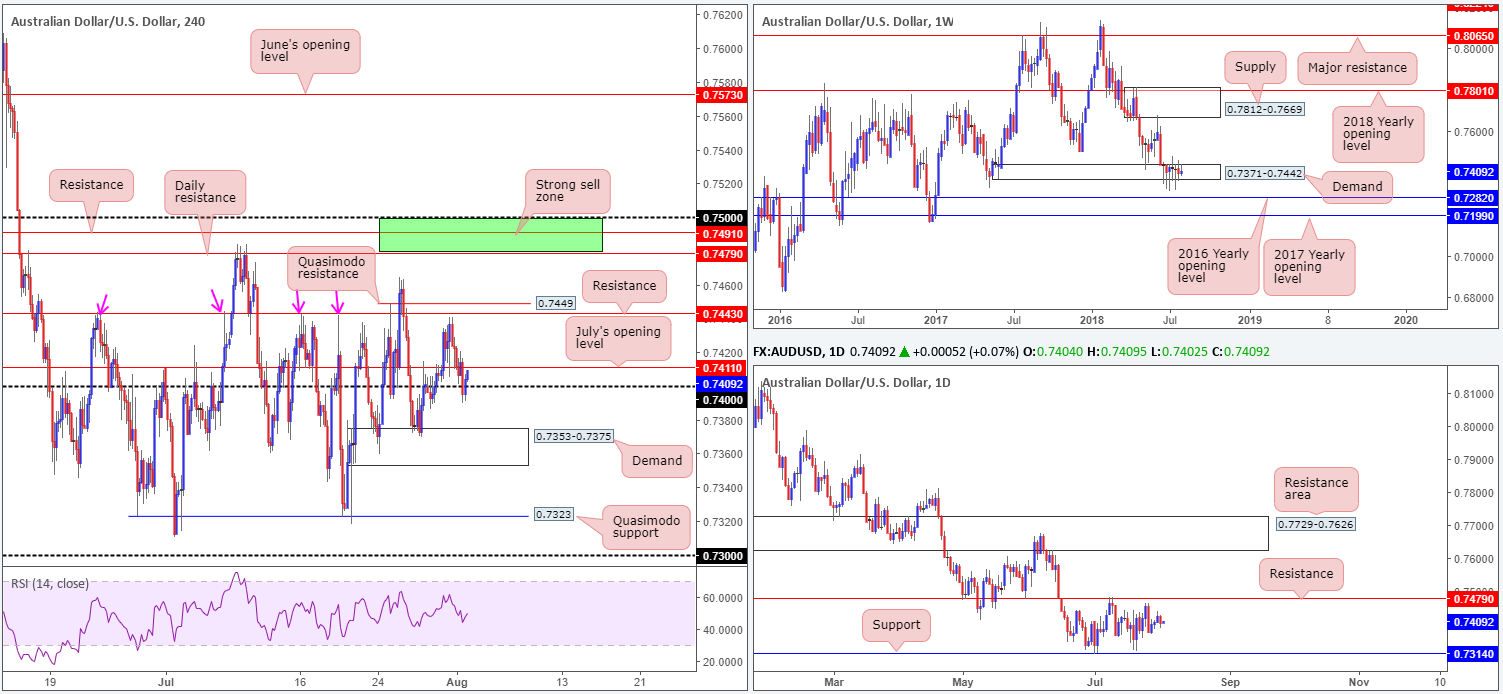
As you can see, H4 structure remains restricted. Price action revisited 0.74 going into Wednesday’s closing bell, and is now facing possible resistance from the underside of 0.7411: July’s opening level. A crack above 0.7411 likely clears the path north to resistance at 0.7443, followed closely by Quasimodo resistance at 0.7449. Between 0.7411 and 0.7443, one has less than 30 pips to play with. A push back beneath the 0.74 handle, on the other hand, will likely see sellers target the top edge of demand at 0.7375 – 25 pips of room! A break through 0.7443 and nearby Quasimodo resistance at 0.7449, nonetheless, likely opens the path to 0.75/0.7479, a H4 sell zone marked in green comprised of a round number, a H4 resistance and daily resistance.
In terms of weekly price action, little has changed over the past month and a half. Demand at 0.7371-0.7442 remains in a fragile state, opening the window to a possible test of the 2016 yearly opening level at 0.7282 sometime down the road. In the event the bulls regain consciousness, however, a retest of supply at 0.7812-0.7669 may eventually be on the cards. The reason behind the lack of movement on the weekly timeframe, technically that is, likely has something to do with the fact daily flow continues to respect its current range. Since early July, the commodity currency has fluctuated between support drawn from 0.7314 and resistance chalked up at 0.7479.
Areas of consideration:
The only area of interest that jumps out at us this morning is the H4 sell zone mentioned above at 0.75/0.7479. Already holding price lower once in early July, this area has a healthy chance of holding should it be tested. As the approach has yet to complete it’s difficult to pin down any firm take-profit targets. In regards to stop-loss orders, nevertheless, traders are urged to wait for H4 price to print something of note (a full or near-full-bodied H4 bear candle) from within the zone (tuck stops above the candle’s rejection wick), since there’s a chance the market may witness a fakeout above 0.75 (common viewing around psychological boundaries).
Today’s data points: Australian trade balance; US unemployment claims.
USD/JPY:
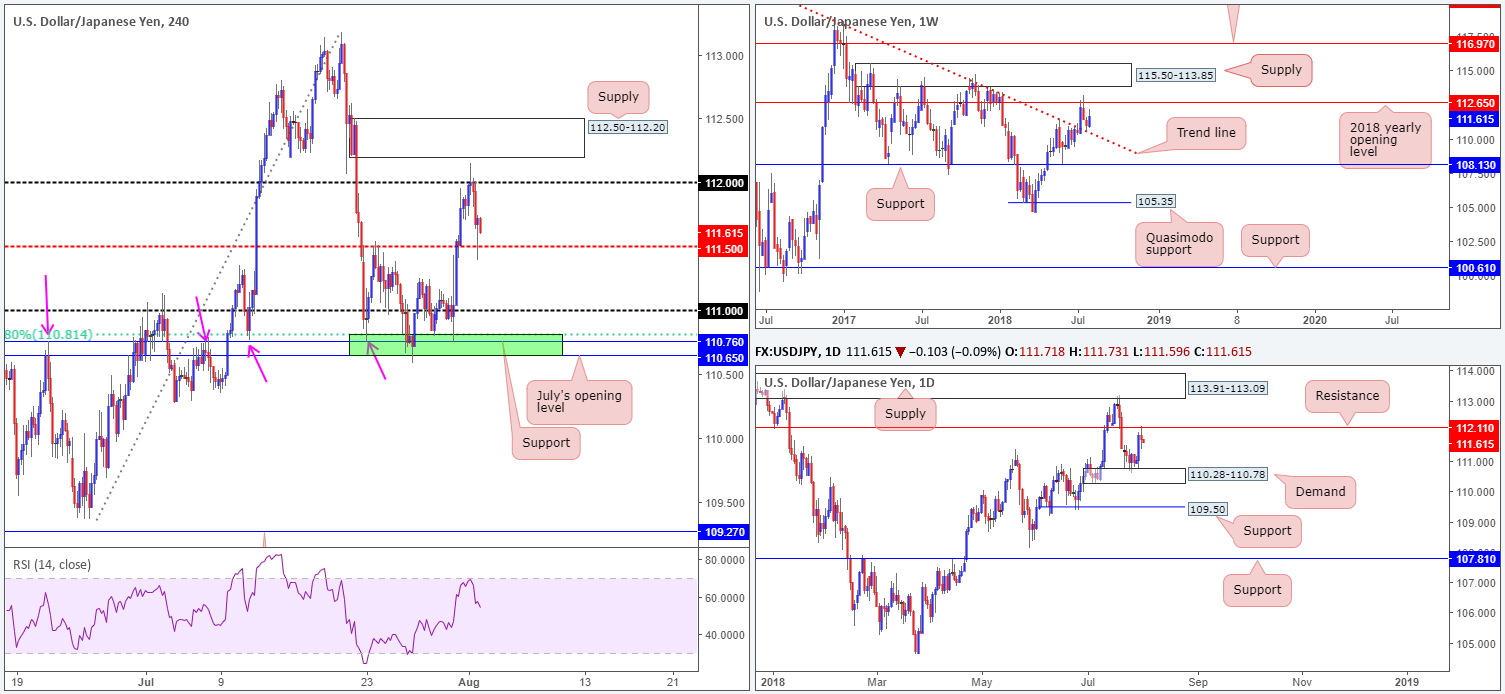
USD/JPY traders went back to playing on the defensive in early London hours on Wednesday, after failing to sustain gains beyond the 112 handle (missing the underside of H4 supply at 112.50-112.20 by an ant’s hair). Escalating tensions between the US and China (outshined recent Fed movement) placed the market in a phase of risk aversion.
Following the Dow lower, the H4 candles headed for nearby support coming in at 111.50. What’s also interesting is daily resistance at 112.11 was brought into the fold. Continued selling from here could eventually see daily demand at 110.28-110.78 retested. According to weekly structure, however, the next upside target on this scale falls in at the 2018 yearly opening level drawn from 112.65, after firmly rejecting trend line resistance-turned support (taken from the high 123.57) two weeks back.
Areas of consideration:
As of current prices, neither a long nor short seems attractive, particularly on the higher timeframes. Weekly price suggests a push higher may be on the cards, whereas daily price portends further selling.
Intraday, should the market witness a break of 111.50 on the H4 timeframe, the 111 handle will likely be the next base in line for some action, shadowed closely by an interesting area of support marked in green at 110.65/110.81 (comprised of July’s opening level, a support level and a 61.8% Fib support). Also bear in mind the top edge of daily demand mentioned above at 110.78 converges nicely with this zone.
On account of this, H4 shorts below 111.50 (preferably on the retest) is a possible option today.
Today’s data points: US unemployment claims.
USD/CAD:
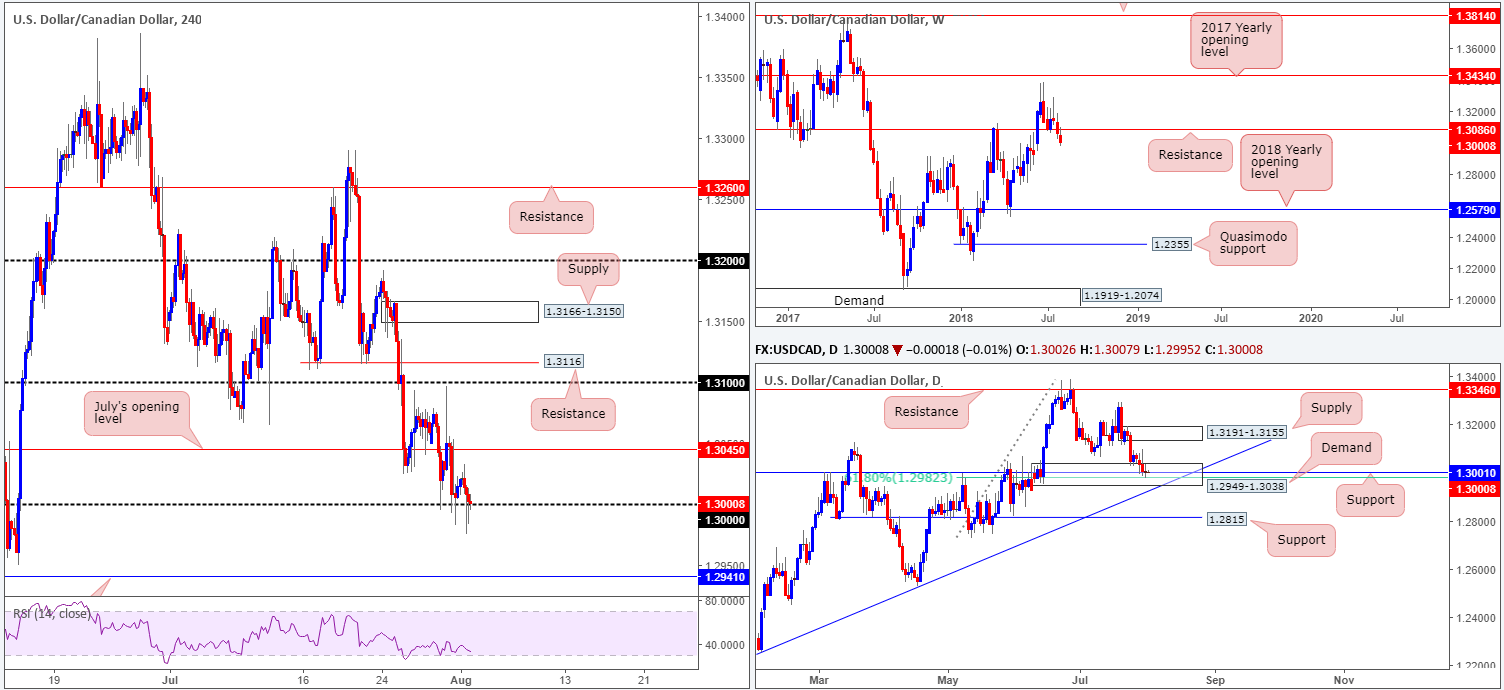
Traders struggled to pin down a firm direction on Wednesday, despite a round of US economic data releases hitting the wires. The key figure 1.30 seen on the H4 timeframe remains a point of focus in this market. Not only because it is a widely watched number, but also due to the fact the level is seen encased within a rather attractive daily demand area visible at 1.2949-1.3038. Also note on the H4 scale the RSI indicator is attempting to rebound from oversold territory, printing mild divergence.
Within the current daily demand zone we also see strong support standing at 1.3001 (history dating back to Sept 2016), followed closely by a 61.8% Fib support value at 1.2982. The next upside objective from this area can be seen around daily supply fixed at 1.3191-1.3155.
While considerable support is seen on H4 and daily timeframes, there’s one drawback: the weekly timeframe. The weekly candles are still seen lurking beneath support coming in at 1.3086 (now acting resistance). In terms of obvious support beneath 1.3086, we do not see a whole lot stopping this market from reaching as far south as 1.2579: the 2018 yearly opening level.
Areas of consideration:
Intraday longs from 1.30 has 1.3045 (H4 July’s opening level) to target as its initial port of call. A move higher from 1.30 is supported by the noted daily supports, though against weekly flow in that one is attempting to buy a market that recently broke weekly support. Technically, this could be the reason behind the lackluster response off 1.30 so far.
As you can see, irrespective of the direction one selects here, opposing structure remains evident. As such, if you’re not willing to accommodate this risk, opting to remain on the sidelines may still be the better option for the time being.
Today’s data points: US unemployment claims.
USD/CHF:
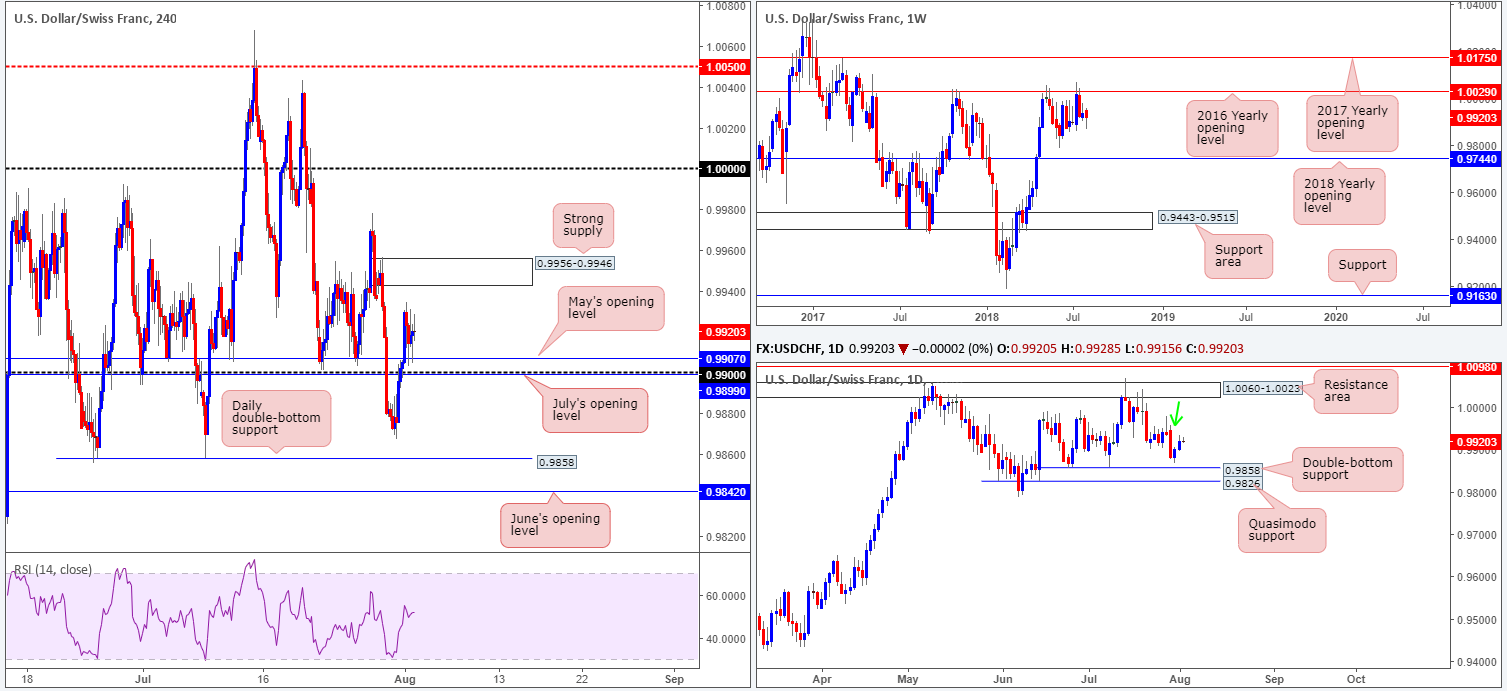
USD/CHF bulls went on the offensive in early Asia on Wednesday, firmly breaking above May’s opening level seen on the H4 timeframe at 0.9907. Things quietened down going into London hours, however, as the unit entered into a phase of consolidation using 0.9907 as support. Assuming this number remains intact, further buying could be seen towards H4 supply located at 0.9956-0.9946. Note this supply boasts strength given its downside momentum printed from its base.
On wider perspective, further downside is still expected on the weekly timeframe. Weekly price remains capped by the 2016 yearly opening level at 1.0029. Holding price lower on two occasions in 2017, and twice already in 2018, this level commands attention! Further selling from current price has the June lows at 0.9788 to target, as well as the 2018 yearly opening level at 0.9744. In terms of daily action, recent movement saw price bottom just north of 0.9858: a double-bottom support, shadowed closely by Quasimodo support at 0.9826. There is mild supply expected around 0.9946 (green arrow), though the overall upside target on this scale falls in around 1.0060-1.0023: a resistance area that encapsulates the 2016 yearly opening level mentioned above on the weekly timeframe at 1.0029.
Areas of consideration:
Intraday, there’s a chance the unit will approach H4 supply at 0.9956-0.9946 today. Getting past this area, however, knowing the lower edge of the zone is also supported by mild supply on the daily timeframe, will likely be a challenge. Therefore, any readers currently long off 0.9907, do bear this in mind.
With 0.9956-0.9946 being a logical upside target in this market, selling from this base is also something to consider, targeting the 0.99 neighborhood. To help avoid having your stop-loss order tripped, consider waiting and seeing if H4 price can form a full or near-full-bodied bear candle before pulling the trigger.
Today’s data points: US unemployment claims.
Dow Jones Industrial Average:
Despite beginning the day on a strong footing, the index hit the brakes and reversed course on Wednesday. Reports of the Trump administration planning to announce 25% tariffs on $200 billion worth of Chinese goods instead of the originally planned 10%, placed the market in a state of risk aversion. Falling crude oil prices also continued to weigh on the energy sector.
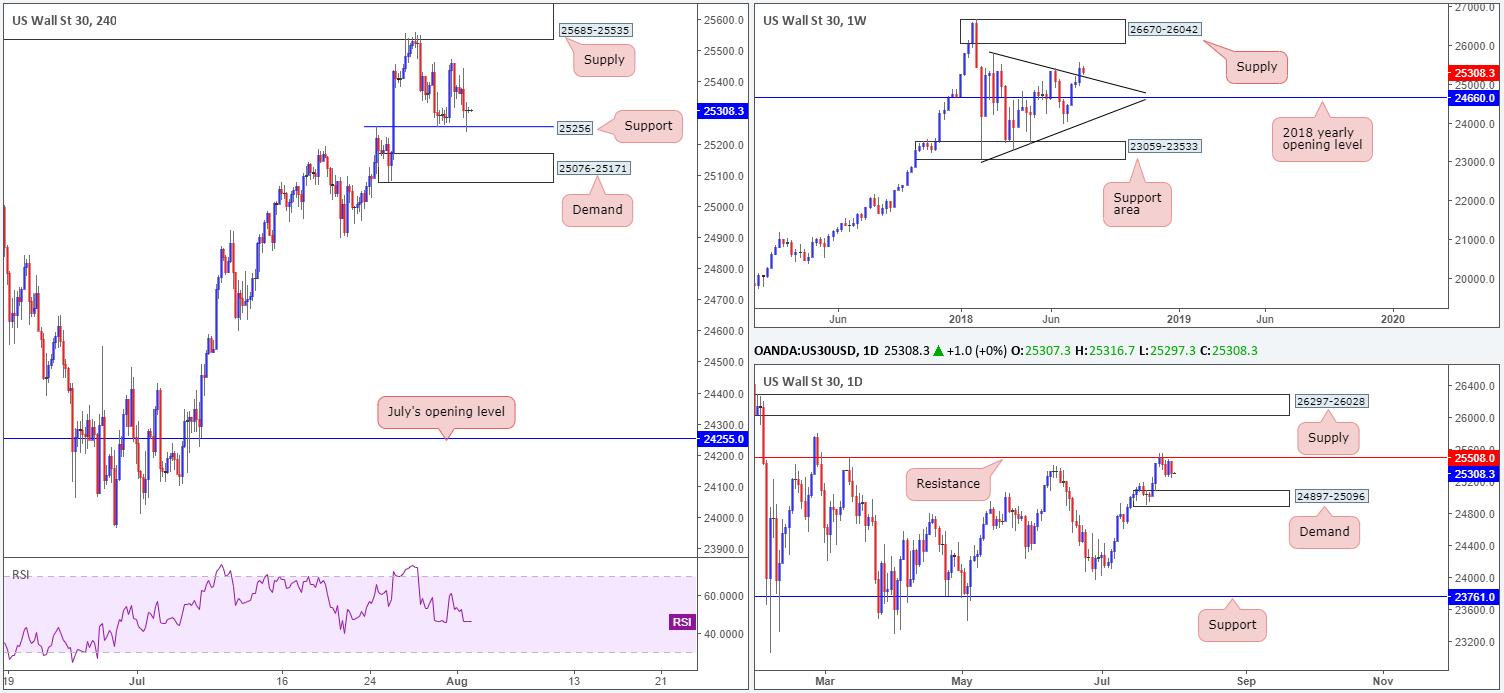
H4 support (previously engulfed high) at 25256, as you can see, managed to hold ground in the shape of a reasonably attractive H4 bullish pin-bar candle formation on Wednesday. Although a round of selling came about in recent trade, H4 supply seen overhead at 25685-25535 remains an area of interest. Traders may have also noticed daily resistance at 25508 is seen plotted just south of this zone. Another key area to keep eyes on is the H4 demand base located at 25076-25171, which happens to be glued to the top edge of daily demand at 24897-25096.
As highlighted in yesterday’s briefing, weekly traders need to remain prepared for the possibility of a retest of the recently broken trend line resistance-turned support (etched from the high 25807). From this point, we could be looking at a run up to supply coming in at 26670-26042.
Areas of consideration:
As the current H4 support lacks higher-timeframe confluence, our outlook in terms of tradable areas remains unchanged:
Seeing as how both daily and H4 demand areas are located nearby the weekly trend line support, a buy from the current H4 demand base is an option today. Conservative traders, nevertheless, may opt to wait and see if daily price probes lower into the noted daily demand area (implies a fakeout of the H4 demand), before pulling the trigger. That way, one has a relatively safe position to site stops: the underside of daily demand at 24897.
Today’s data points: US unemployment claims.
XAU/USD (Gold):
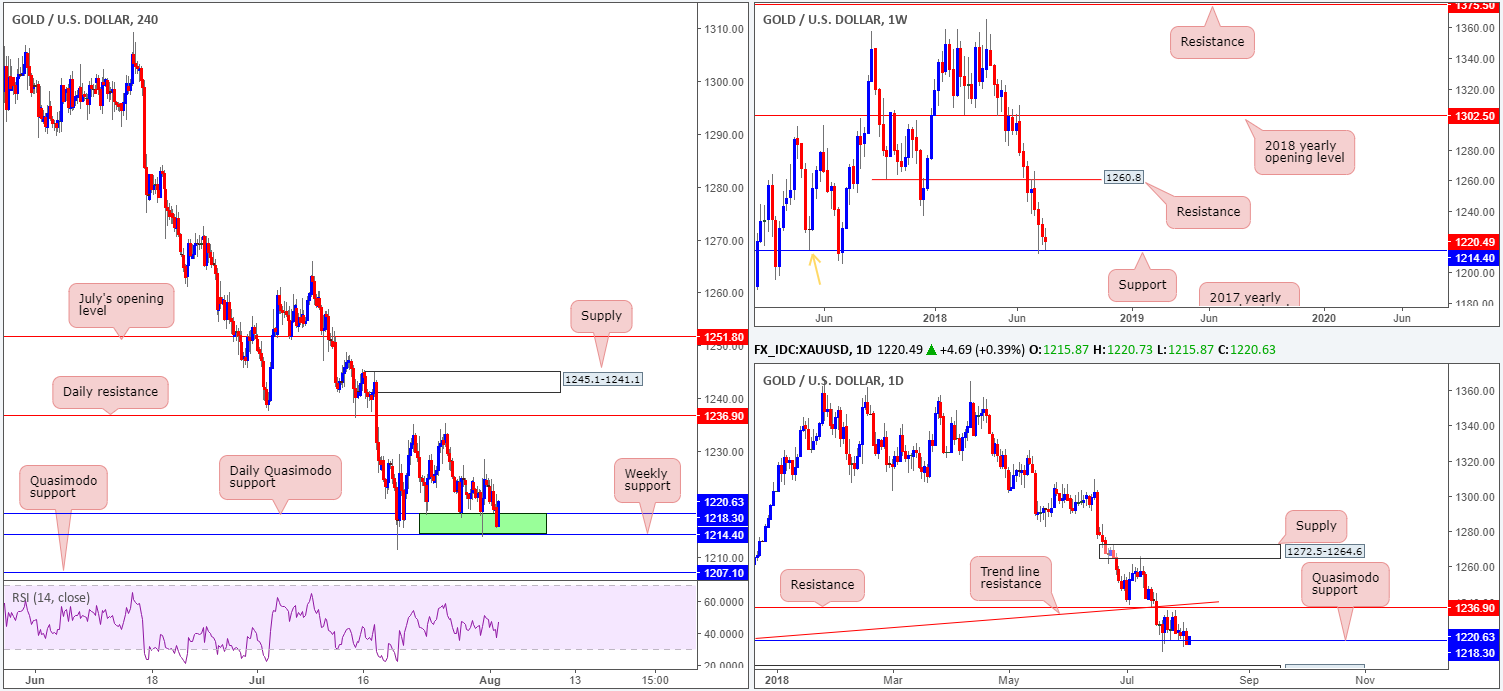
While the price of gold finished Wednesday’s sessions marginally lower against the US dollar, overall structure in this market remains unchanged, and therefore much of the following report will mimic Wednesday’s analysis.
On the weekly timeframe this morning, the market’s radar continues to point in the direction of support at 1214.4. Note this level also happens to represent a Quasimodo support taken from the left shoulder marked with an orange arrow. Meanwhile, the daily candles continue to respect a Quasimodo support located at 1218.3, despite probing below this level in yesterday’s trade. Overall, though, the bulls appear weak from this angle as over the past week or so price has attempted to probe higher, though failed ahead of nearby resistance at 1236.9, which, as you can see, converges with a trend line support-turned resistance (carved from the low 1195.1). The next base to be aware of, should we see the yellow metal push south that is, comes in at 1195.1-1204.1: a demand area not seen on the screen.
In spite of a bearish overtone in this market, given the current trend (see higher timeframes), readers may recall the team has been banging the drum about a H4 zone marked in green at 1214.4/1218 (weekly and daily supports – see above). As you can see, this zone remains firm for the time being, despite a number of attempts to push lower.
Areas of consideration:
Though little development is being seen off higher-timeframe supports at the moment, we believe buyers will continue bidding the price of gold higher from 1214.4-1218.3 on the H4 scale until reaching daily resistance at 1236.9. It is here we feel strong sellers reside.
How one goes about pinning down an entry to take advantage of this move is the challenge! One option could be simply waiting for a H4 bullish candlestick formation to form: a bullish engulfing formation or a bullish pin-bar setup.
The use of the site is agreement that the site is for informational and educational purposes only and does not constitute advice in any form in the furtherance of any trade or trading decisions.
The accuracy, completeness and timeliness of the information contained on this site cannot be guaranteed. IC Markets does not warranty, guarantee or make any representations, or assume any liability with regard to financial results based on the use of the information in the site.
News, views, opinions, recommendations and other information obtained from sources outside of www.icmarkets.com.au, used in this site are believed to be reliable, but we cannot guarantee their accuracy or completeness. All such information is subject to change at any time without notice. IC Markets assumes no responsibility for the content of any linked site. The fact that such links may exist does not indicate approval or endorsement of any material contained on any linked site.
IC Markets is not liable for any harm caused by the transmission, through accessing the services or information on this site, of a computer virus, or other computer code or programming device that might be used to access, delete, damage, disable, disrupt or otherwise impede in any manner, the operation of the site or of any user’s software, hardware, data or property.


