
Key risk events today:
Canada Trade Balance; US Unemployment Claims.
(Previous analysis as well as outside sources – italics).
EUR/USD:
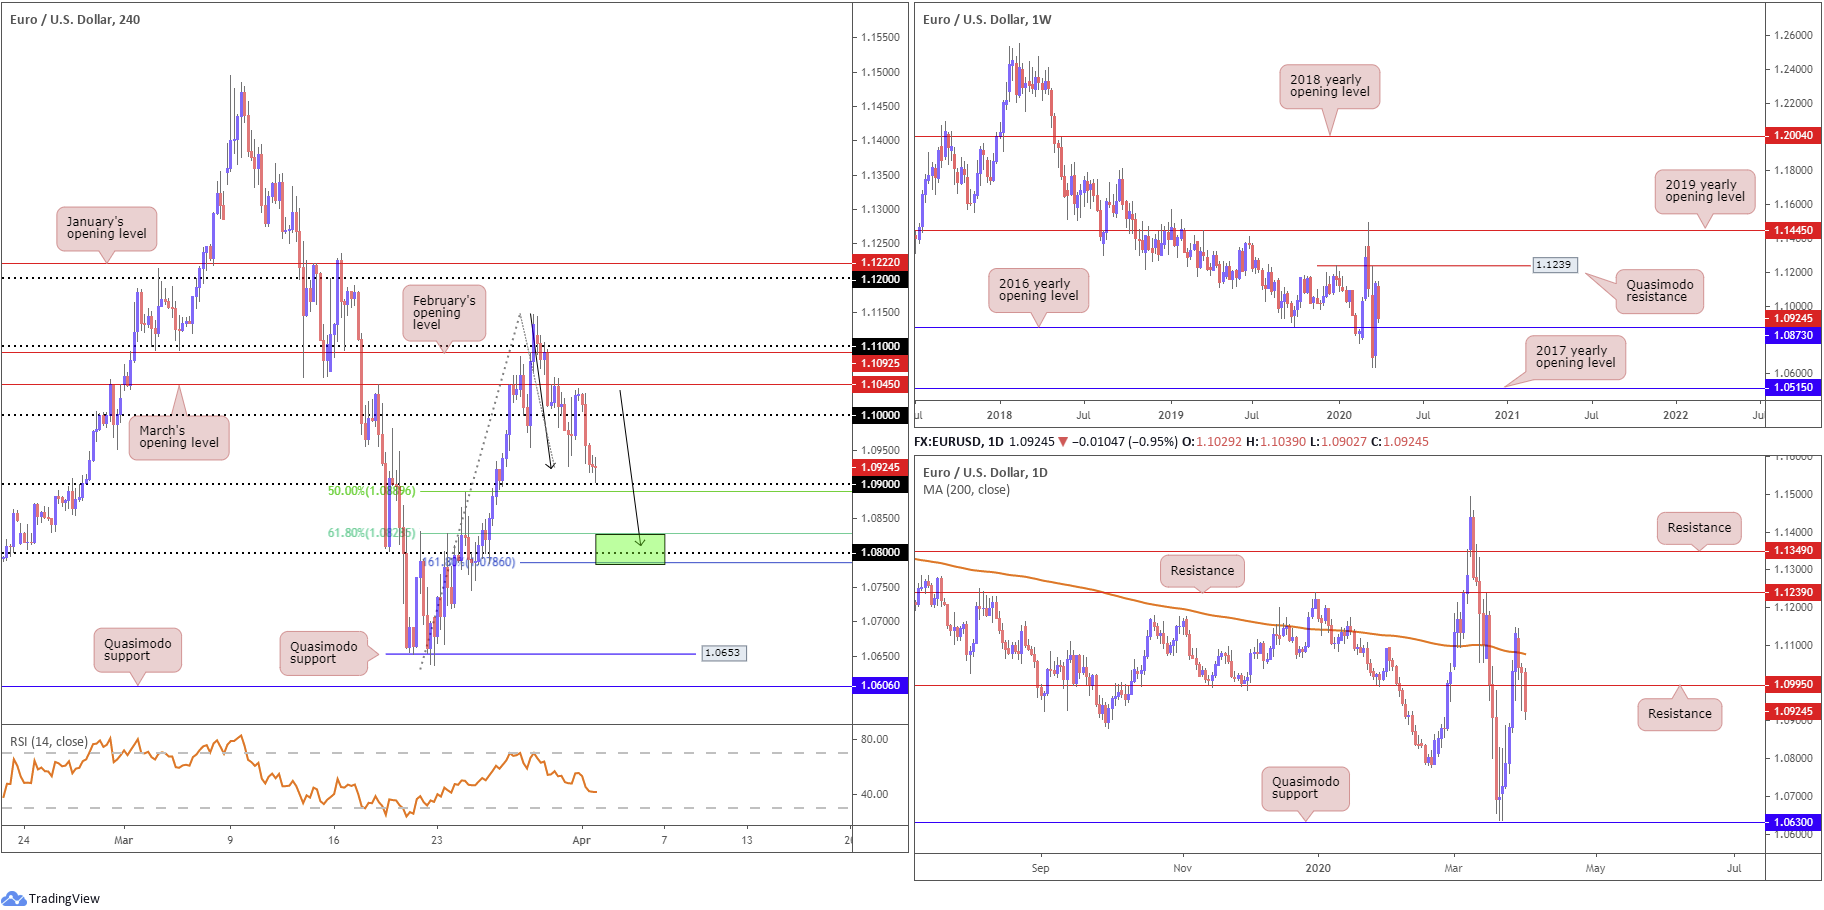
The US dollar index is on track to net a solid start to Q2, though is currently trading off best levels ahead of 100.00 in wake of the final Markit manufacturing PMI for March and ISM surveys. Wednesday had the EUR/USD swarm the widely watched figure 1.10 on the H4, potentially forming the D-leg of an AB=CD bullish pattern (black arrows) at 1.0808. As evident from the chart, we are a few points off 1.09, closely shadowed by a 50.0% retracement ratio coming in at 1.0889. South of this region, traders’ crosshairs are likely fixed on an interesting area of support (green), comprised of a 161.8% Fibonacci extension point at 1.0786, the round number 1.08, a 61.8% Fibonacci retracement at 1.0827 and the underlined AB=CD configuration.
Further afield, weekly flow continues to meander between Quasimodo resistance at 1.1239 and the 2016 yearly opening level at 1.0873, though price is seen nearing the latter. A likely test of 1.0873 was further confirmed by a violation of daily support drawn from 1.0995 (now a serving resistance). On the daily scale, the recent break lower potentially lays the foundation for a run back to Quasimodo support at 1.0630, though this entails engulfing the weekly level at 1.0873.
Areas of consideration:
Having noted weekly and daily price exhibiting space to explore lower ground, 1.09 is unlikely to deliver much upside.
Sub 1.09, weekly support exists at 1.0873, followed by the H4 support area highlighted above at 1.0786/1.0827. Testing the H4 support area involves a minor whipsaw through weekly support (minor on the weekly timeframe). A rebound from 1.0786/1.0827, nevertheless, is considered high probability among price-action traders, with the possibility of revisiting the underside of 1.09.
GBP/USD:
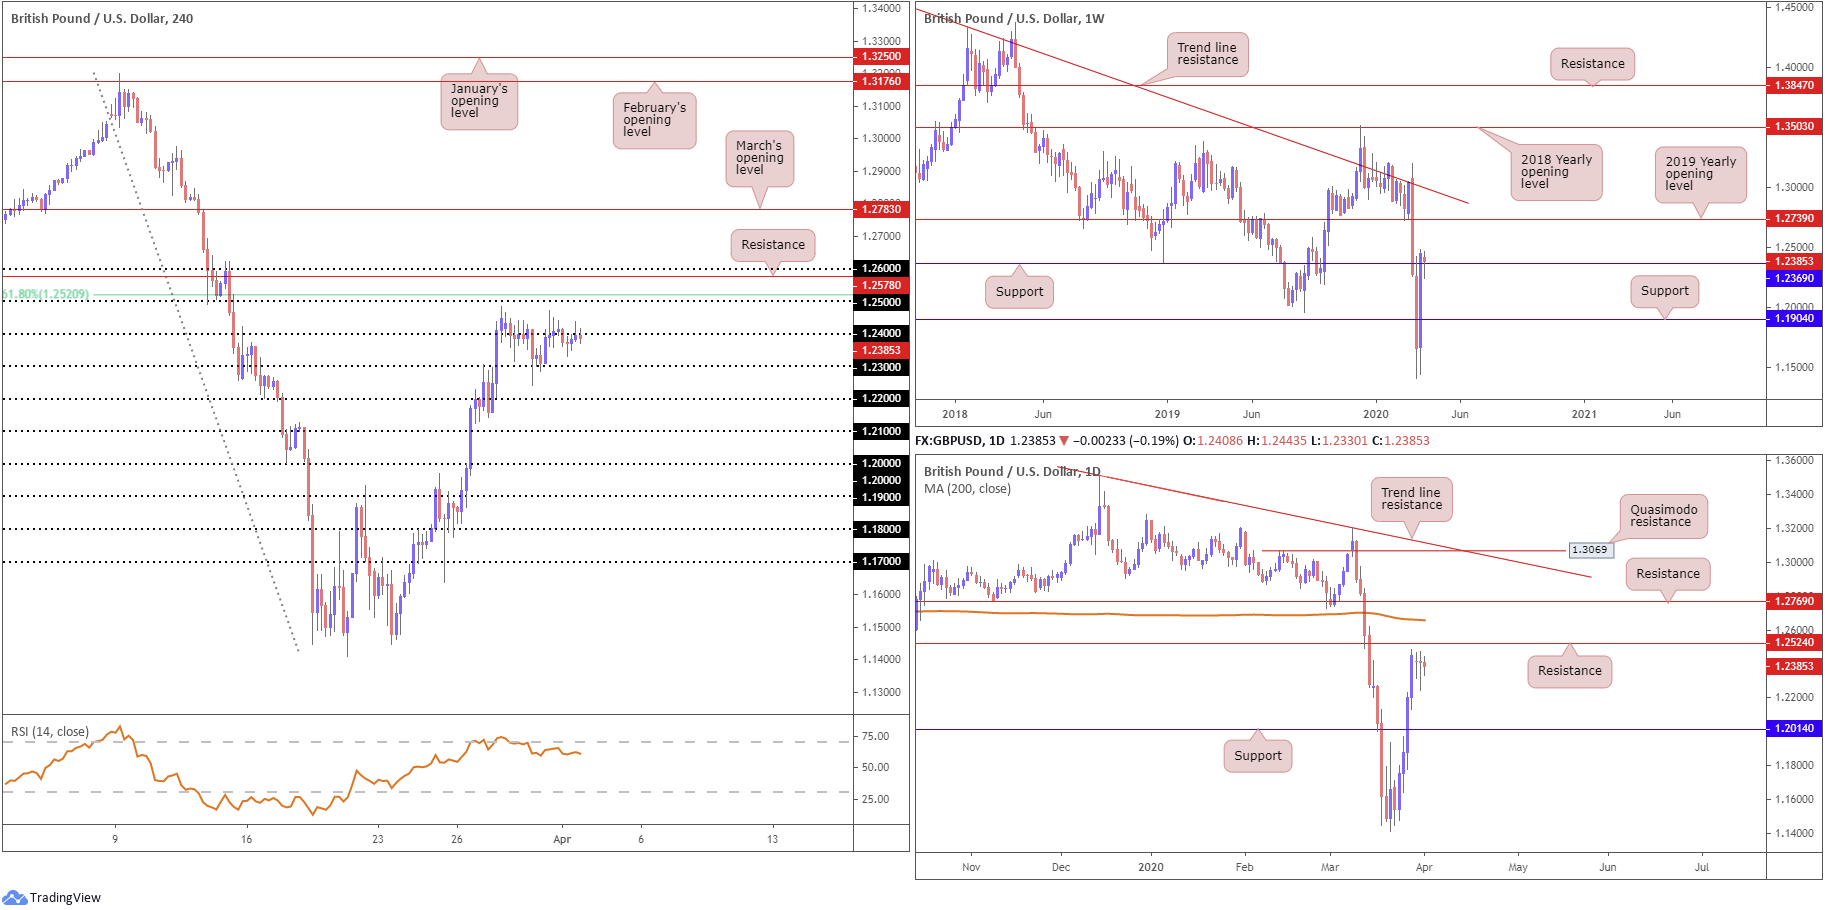
Little moved by UK manufacturing PMI data and resurgent USD demand, GBP/USD concluded Wednesday within Tuesday’s range between 1.2472/1.2241, clutching 1.24. As a result of yesterday’s lacklustre performance, much of the following piece resembles Wednesday’s technical briefing.
Should 1.24 echo a supportive tone today, traders are urged to key in the 1.25 handle and 61.8% Fibonacci retracement ratio at 1.2520. A violation of this region may also persuade further gains to resistance at 1.2578, taken from July 2019, and the round number 1.26.
Nothing standout is seen in terms of movement on the bigger picture so far this week. Last week’s vigorous climb firmed above weekly resistance at 1.1904 and 1.2369, with the latter currently being retested as support. The next upside target falls in around the 2019 yearly opening level at 1.2739, with a break exposing long-term weekly trend line resistance, taken from the high 1.5930.
After crossing daily resistance at 1.2014 (now a serving support), resistance lies in wait around the 1.2524 neighbourhood, trailed closely by the 200-day SMA (orange – 1.2658). Traders will also note Wednesday’s action printed its third consecutive indecision candle, albeit sporting a larger body than previous sessions.
Areas of consideration:
Higher-timeframe projections on the weekly timeframe forecasts additional gains until shaking hands with 1.2739. Daily resistance at 1.2524 may throw a spanner in the works, however.
There’s not much (technical) evidence to suggest we’re heading beneath 1.24. 1.25 is the more likely destination, owing to its surrounding confluence from a 61.8% H4 Fibonacci ratio at 1.2520 and daily resistance at 1.2524. Therefore, this zone could be an area countertrend traders look to fade, targeting 1.24.
The next port of resistance falls in around the 1.26 handle on the H4 timeframe (another area countertrend traders may lean towards), enhanced by a H4 resistance level plotted at 1.2578, with the possibility of a fakeout seen to the 200-day SMA at 1.2658.
AUD/USD:
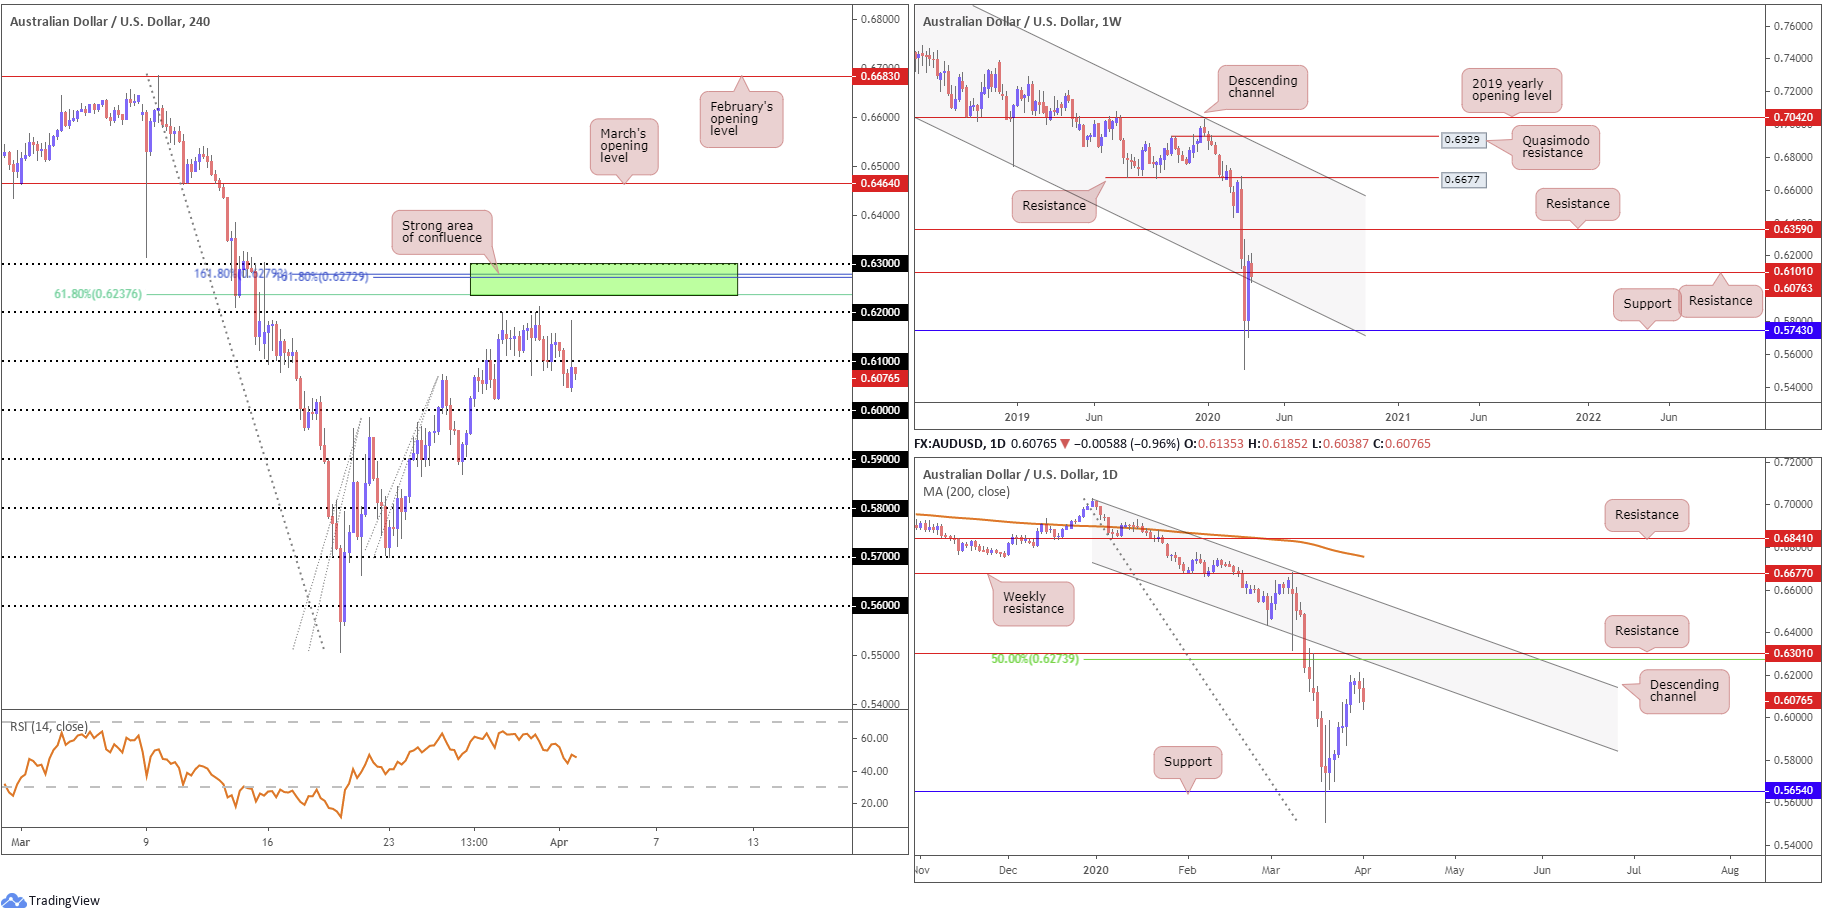
The Australian dollar ceded ground against the buck for a second successive session Wednesday, erasing more than 55 points and extending south of two-week tops at 0.6213. Fears amid the coronavirus outbreak and its effect on the global economy boosted the USD’s safe-haven status, consequently exerting downside pressure on AUD/USD.
In recent hours a sizeable spike materialised through 0.61 to 0.6185 on the H4, devastating buy stops north of the base and producing a notable selling wick. The close beneath 0.61 is likely considered a bearish indicator on this scale, shining the limelight on the key figure 0.60 as feasible support today.
What’s also notable from a technical perspective on the H4 is 0.63/0.6237, as a potential resistance zone. Joining this region is the 0.63 handle, two 161.8% Fibonacci extensions at 0.6279 and 0.6272, a 61.8% Fibonacci retracement at 0.6237 and daily resistance at 0.6301 (green). In addition, buy stops above 0.62 will likely provide liquidity to sell into from 0.63/0.6237.
The relative strength index (RSI), for those who follow momentum-based indicators, recently crossed beneath 50.00, emphasising a bearish tone.
Focus on the daily timeframe remains at resistance from 0.6301, despite activity extending losses. Joined closely with a 50.0% retracement ratio carved in at 0.6273 and a channel support-turned resistance, extended from the low 0.6433, this area could be an issue for buyers, in the event we attempt higher ground. Continued downside, on the other hand, has support at 0.5654.
With respect to the weekly timeframe, traders are watching price action shake hands with resistance at 0.6101, which happens to align with a channel support-turned resistance, coming in from the low 0.6744.
Areas of consideration:
The widely watched 0.60 level may offer support today; buyers, however, may be concerned by the fact the round number, although it is a strong base by and of itself, houses limited confluence. Conservative traders will likely seek additional confirmation from this neighbourhood, owing to the possibility of a whipsaw through 0.60 – common viewing around psychological numbers.
0.63/0.6237 remains an upside target for any long positions above 0.61.
Further to this, 0.63/0.6237 represents a potential spot to consider bearish setups, in view of supporting structure.
USD/JPY:
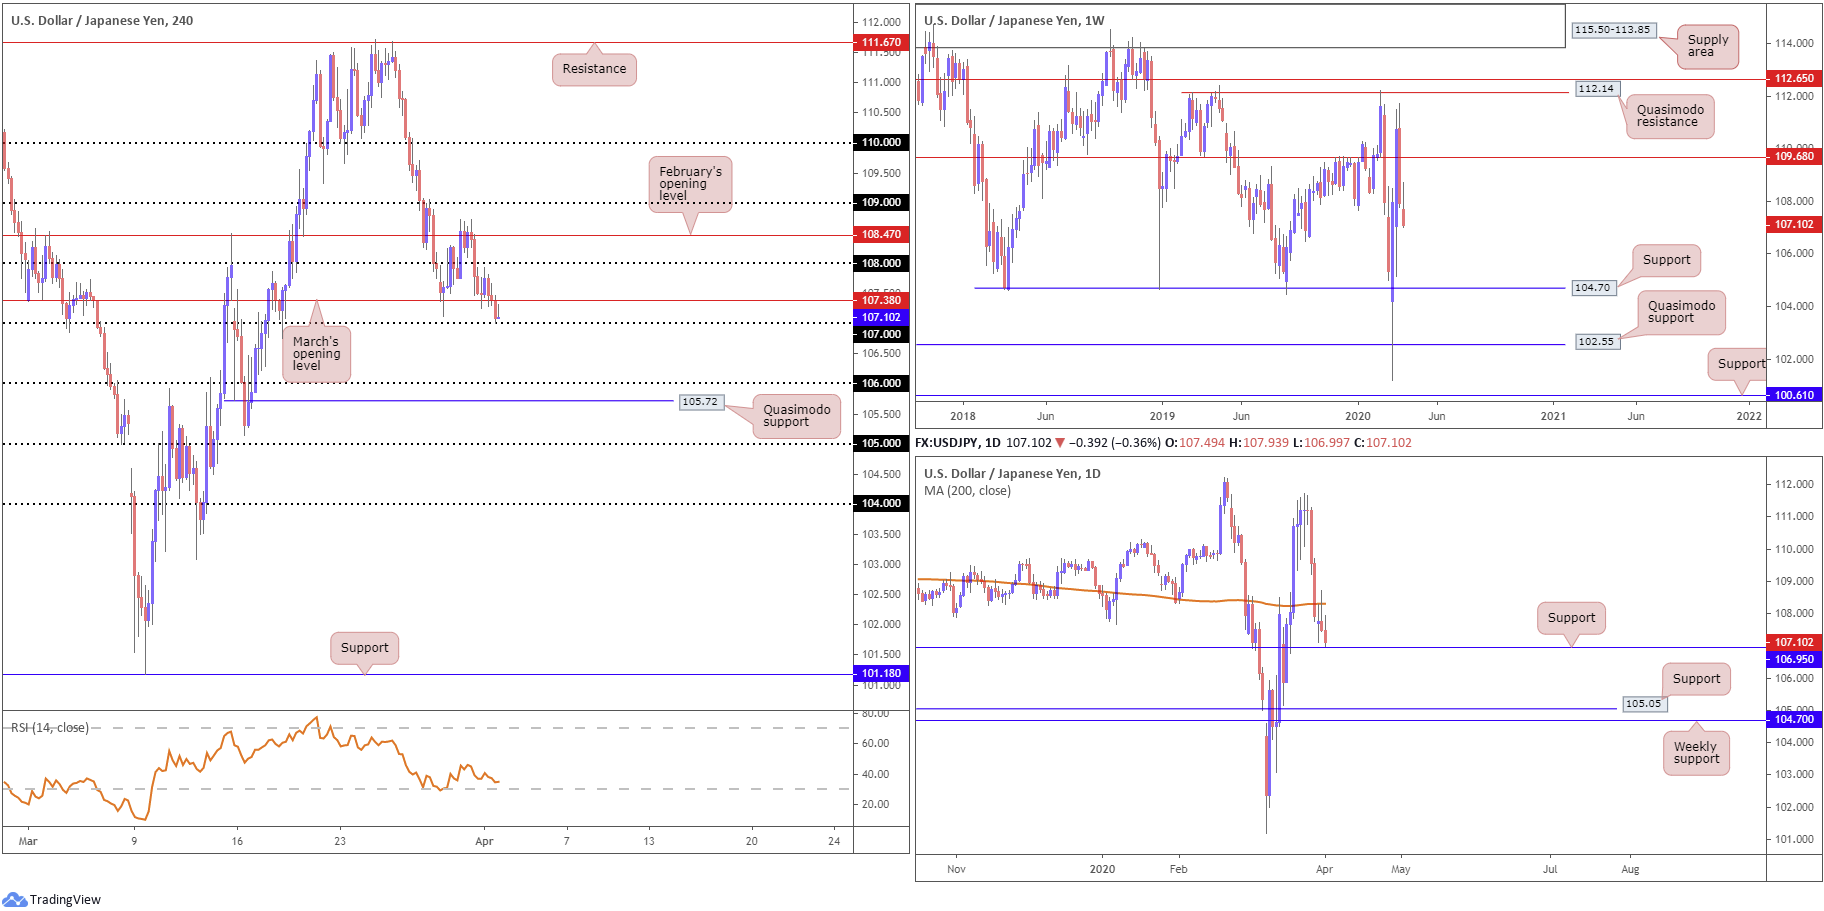
Following Tuesday’s clear-cut shooting star candlestick pattern on the daily timeframe off the 200-day SMA (orange – 108.30), USD/JPY navigated lower levels Wednesday, with March’s opening level at 107.38 giving way and 107 welcoming an approach on the H4.
The safe-haven Japanese yen gathered traction in light of the clear risk-off tone emphasised yesterday, with major US benchmarks and US Treasury yields registering losses. A break of 107 on the H4 scale potentially paves the way south to 106, closely shadowed by Quasimodo support at 105.72. The relative strength index (RSI) is seen holding oversold terrain, currently circulating levels just south of the 40.00ish region.
Technical action on the weekly timeframe left Quasimodo resistance at 112.14 unopposed, and pared a large portion of the prior-week’s gains last week, wiping off more than 280 points. Sustained downside on this timeframe is free to navigate lower until touching gloves with a familiar area of support coming in at 104.70. It might also interest some traders to note 104.70 denotes the lower boundary of a multi-month range between Quasimodo resistance mentioned above at 112.14.
Areas of consideration:
Having noted room to explore lower levels on the weekly timeframe, a break of 107 is a possibility today. The problem, however, arises on the daily timeframe with support resting a touch beneath 107 at 106.95.
A H4 close south of 106.95, therefore, would likely be viewed as a bearish indicator, with sellers likely to strengthen their grip towards 106. A retest at 107ish, following a H4 close beneath 106.95, is likely to be considered a reasonably high-probability selling opportunity, particularly if formed by way of a H4 bearish candlestick variation.
USD/CAD:
Reversing Tuesday’s losses, USD/CAD witnessed a resurgence of bidding Wednesday, adding more than 150 points, or 1.10%. The US dollar index also gained traction, though is currently trading off best levels ahead of 100.00 in wake of the final Markit manufacturing PMI for March and ISM surveys. WTI prices pencilled in modest gains off $19.94/bbl, but failed to overthrow the prior day’s high at $21.87/bbl.
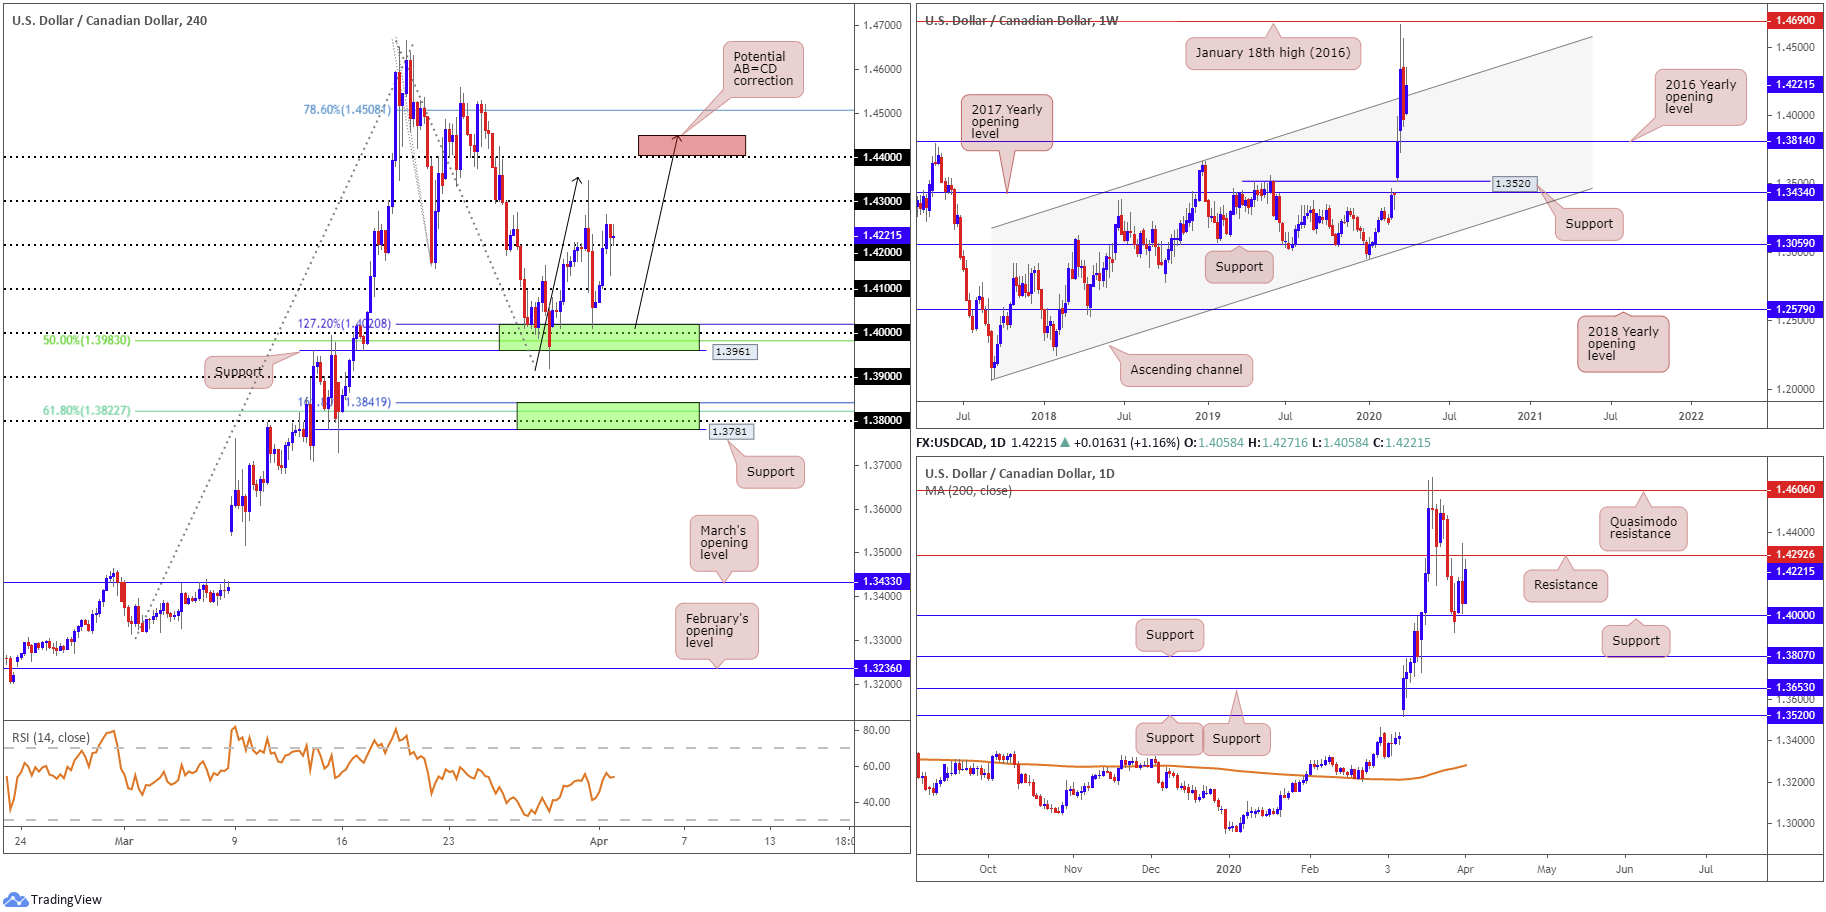
From the weekly timeframe, the unit is seen attempting to secure ground above channel resistance, extended from the high 1.3661, despite a sizeable move to the downside in recent trading. Further buying from this point has January 18th high at 1.4690 (2016) to target, whereas moves lower could draw in support at the 2016 yearly opening level from 1.3814.
A closer reading of price action on the daily timeframe reveals the candles remain confined between resistance at 1.4292 and support coming in at 1.4000. Support is seen at 1.3807, in the event we push lower, while moves to the upside has crosshairs fixed on Quasimodo resistance at 1.4606.
Across the page on the H4 timeframe, 1.3961/1.4020 (upper green), made up of a 127.2% Fibonacci extension base at 1.4020, the round number 1.40, a 50.0% retracement at 1.3983 and support coming in at 1.3961, entered the fold late Tuesday, and saw price action extend recovery gains Wednesday. 1.41 and 1.42 caved in, with the recently closed H4 candle retesting 1.42 in the shape of a hammer candlestick pattern, suggesting we may be headed for 1.43.
Areas of consideration:
Traders considering longs based off the retest at 1.42 are urged to pencil in the possibility of resistance forming at 1.43; this level merges closely with daily resistance at 1.4292. This is not to say longs from 1.42 are invalid, quite the contrary. It just means 1.43 is a possible reversal zone, therefore reducing risk to breakeven around this neighbourhood could be a consideration.
In the event of a break above 1.43, we’re then likely headed for 1.44 and a completion of a H4 AB=CD bearish pattern around 1.4450. A fakeout through 1.44, tripping buy-stop liquidity, into 1.4450 (red zone), therefore, could be a scenario worthy of the watchlist, particularly if H4 price action closes in the form of a bearish candlestick signal.
USD/CHF:
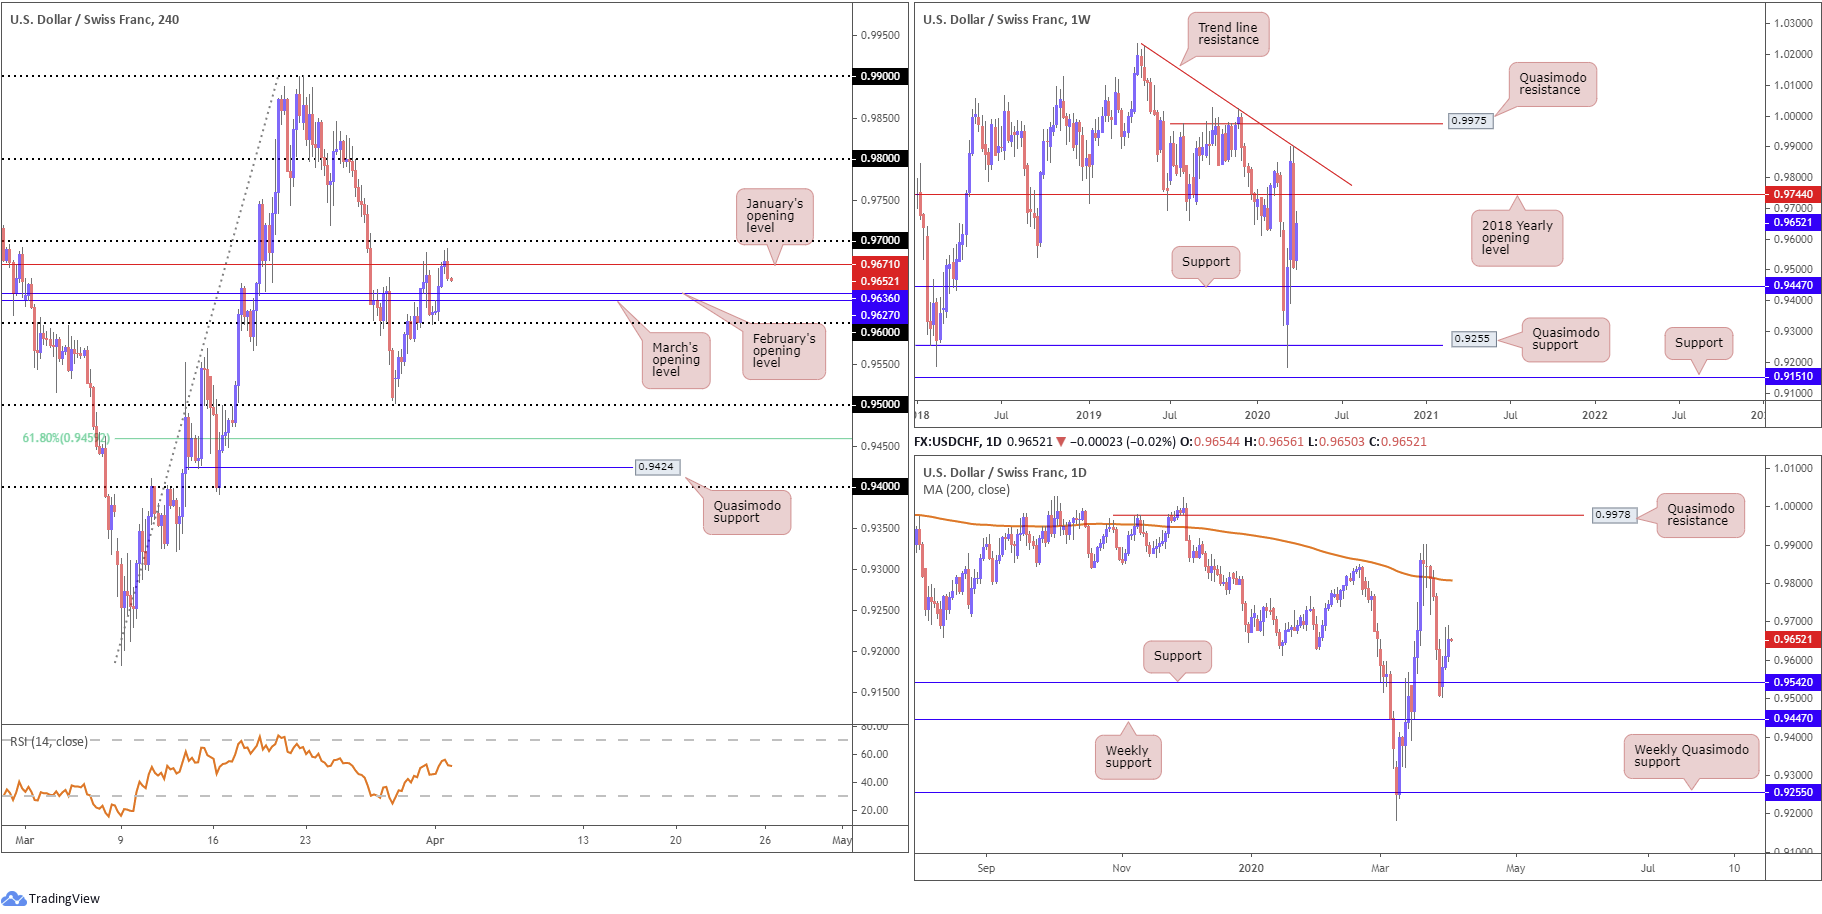
Following a late to-the-point retest at 0.96 Tuesday, USD/CHF, aligned with broad-based USD bidding, latched on to a healthy bid Wednesday. February and March’s opening levels at 0.9636 and 0.9627 came under fire on the H4 timeframe; January’s opening level at 0.9671 entered the fold shortly after with price forming a bearish outside pattern.
Technical development from the weekly timeframe has the unit trading beneath the 2018 yearly opening level at 0.9744, after fading trend line resistance, etched from the high 1.0236, last week. The outlook on the weekly timeframe appears prepped for additional loss (though a retest at 0.9744 is not out of the question) to support at 0.9447, with a break exposing Quasimodo support at 0.9255.
Support on the daily timeframe at 0.9542 remains in motion, with USD/CHF chalking up its third consecutive daily gain yesterday. Price action appears to be faltering, however, in view of the candle wicks, therefore retesting the 200-day SMA (orange – 0.9808) may be a challenge. A constructive development on the daily timeframe worth noting, though, is the said 200-day SMA rests above the 2018 yearly opening level at 0.9744 on the weekly timeframe.
Areas of consideration:
The combination of the 2018 yearly opening level at 0.9744 on the weekly timeframe and the 200-day SMA marks a potential reversal zone north of 0.97 on the H4 timeframe to be aware of. As such, breakout buying above 0.97 could face opposition early on.
The H4 bearish outside candle pattern, although likely appealing to candlestick enthusiasts, faces nearby support at February and March’s opening levels at 0.9636 and 0.9627.
Dow Jones Industrial Average:
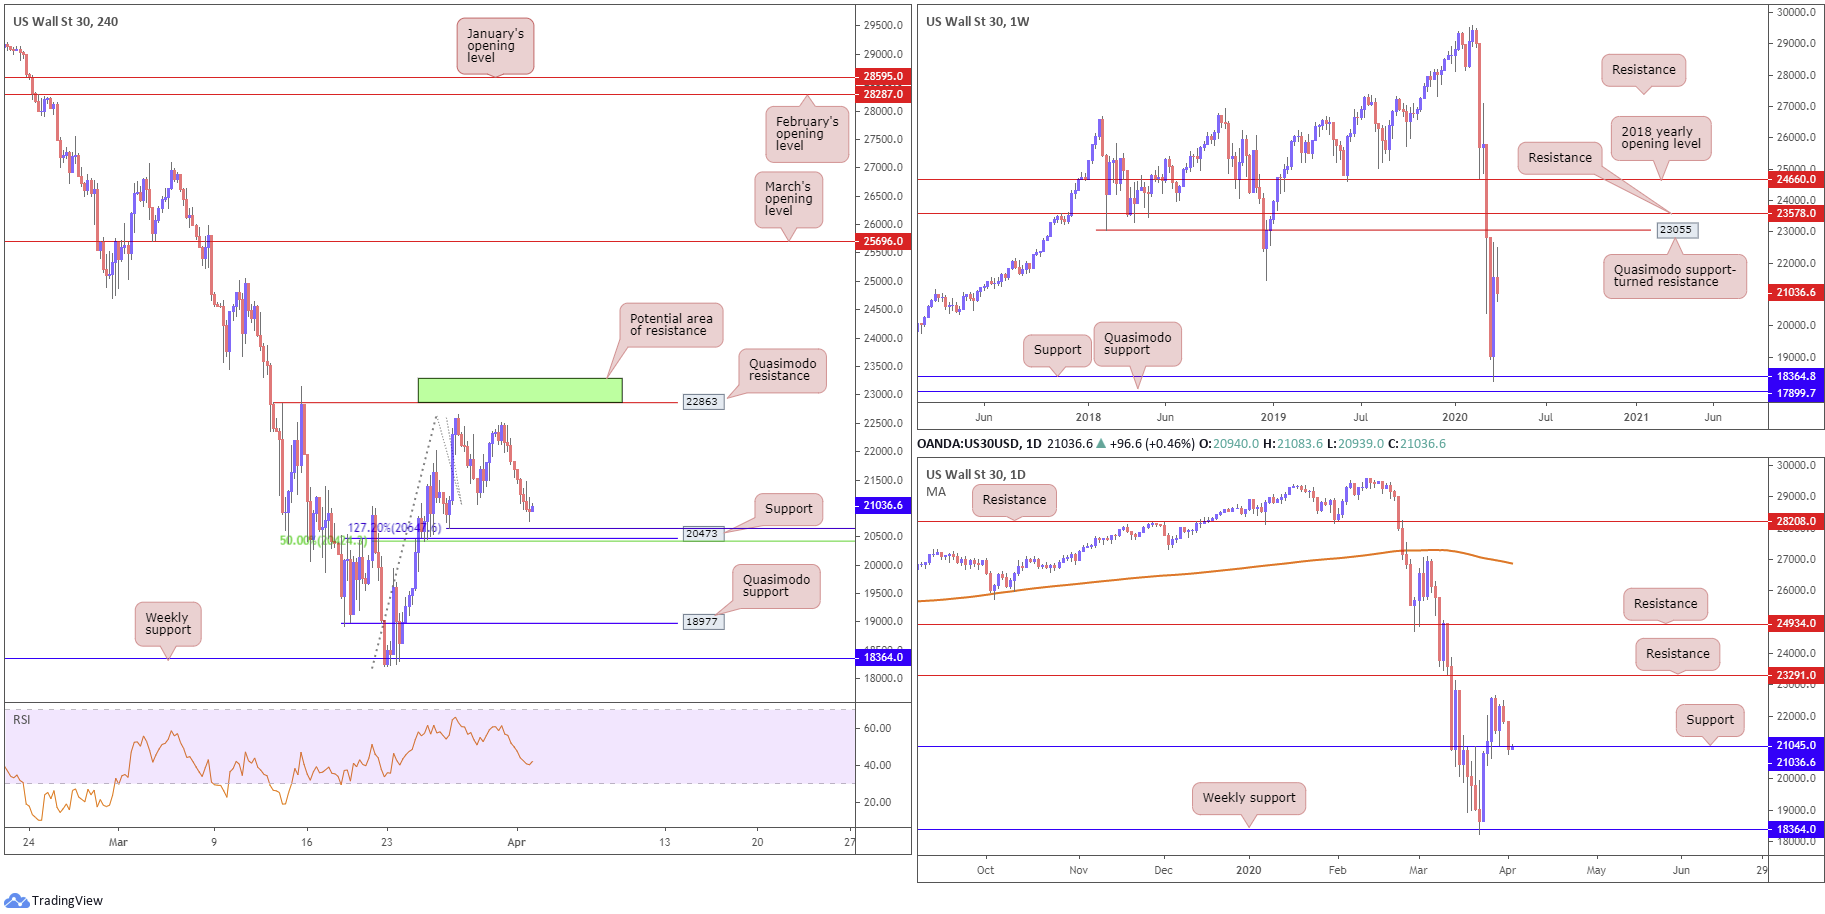
Global equity markets plunged in the first trading session of the new quarter as traders digested forecasts concerning the coronavirus pandemic. The Dow Jones Industrial Average declined 973.65 points, or 4.44%; the S&P 500 also erased 114.09 points, or 4.41%, and the tech-heavy Nasdaq 100 concluded lower by 327.21 points, or 4.19%.
From a technical perspective, H4 movement transitioned to waters just north of support coming in at 20473, which comes with additional support in the form of a 50.0% retracement at 20433 and a 127.2% Fibonacci extension at 20647.
Further out on the weekly timeframe, weekly price continues to languish beneath Quasimodo support-turned resistance at 23055, following last week’s enthusiastic recovery off support at 18364. Daily price, on the other hand, is revisiting support at 21045, threatening the possibility of a breach, in view of Wednesday’s near-full-bodied bearish candle, targeting weekly support mentioned above at 18364.
Areas of consideration:
A test of H4 support at 20473 is likely on the radar for many short-term traders today. Regrettably, there’s limited confluence, aside from local structure, reinforcing 20473. As a result, although a rebound is likely in store, its enthusiasm is likely to be questionable. Strict trade management is recommended should you engage, reducing risk to breakeven as soon as logically possible.
A break beneath the said H4 support, however, may unlock the door for bearish scenarios to H4 Quasimodo support at 18977, followed by weekly support at 18364.
XAU/USD (GOLD):
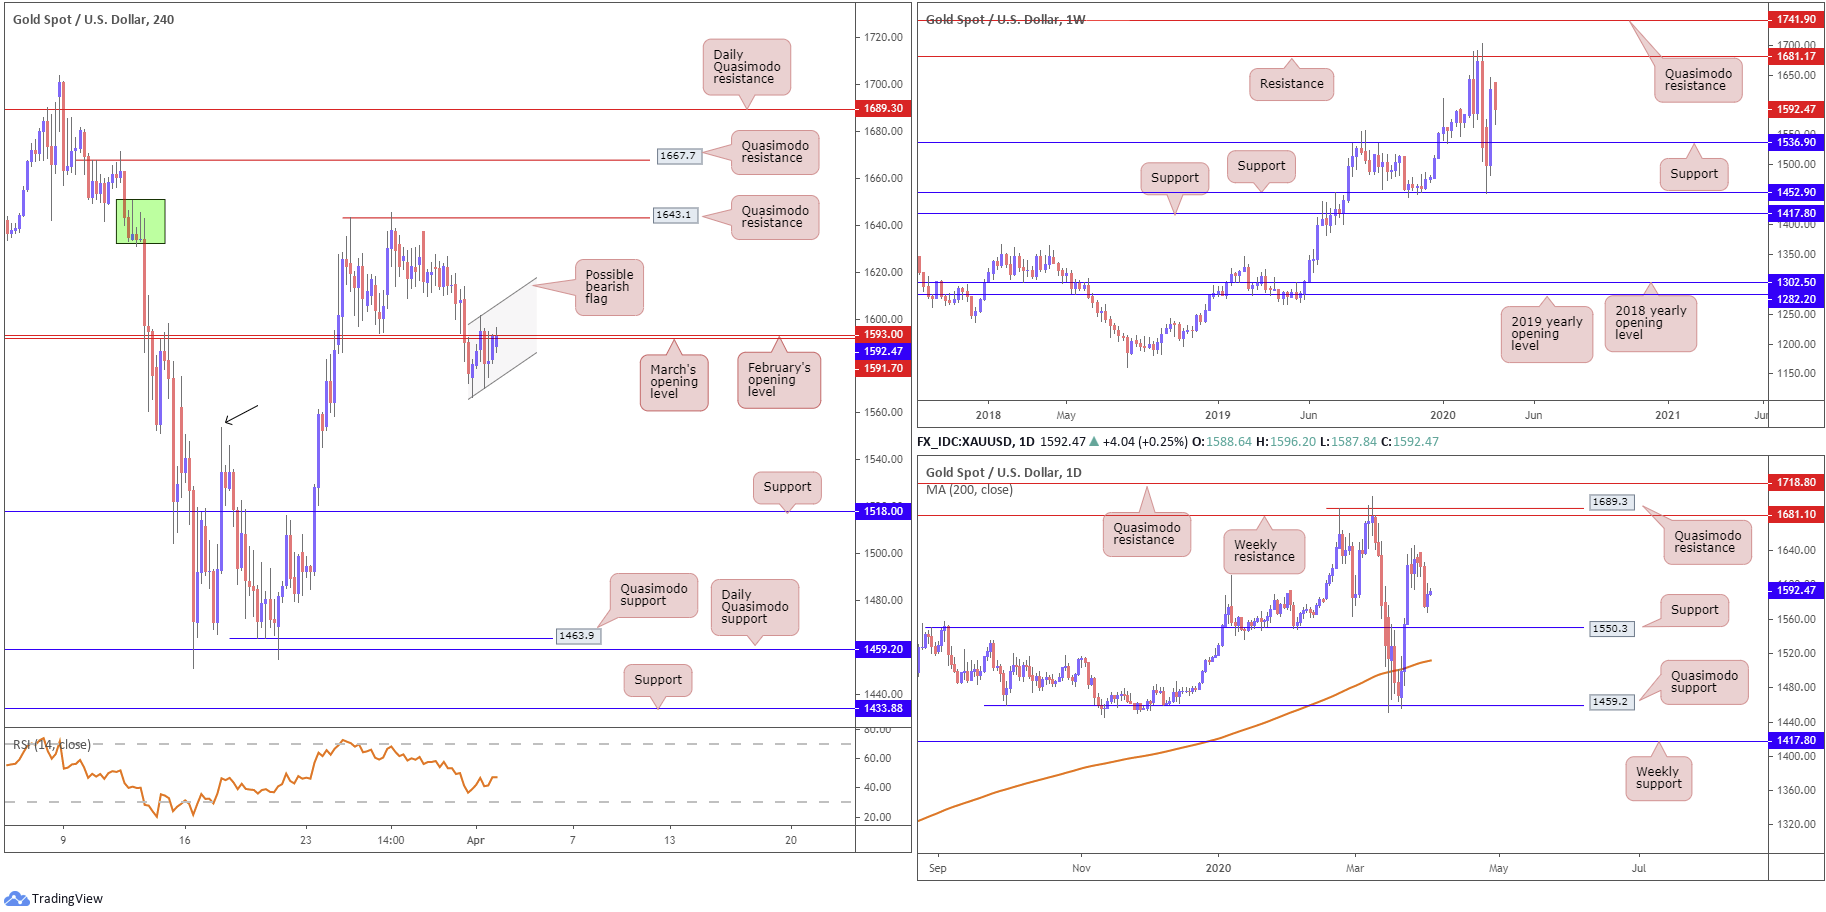
Bullion was reasonably contained Wednesday, in spite of enthusiastic USD bidding.
March and February’s opening levels at 1591.7/1593.0 currently cap upside, with the H4 candles threatening the possibility of a bearish flag formation between 1566.5/1601.7. A breakout to the downside on the H4 scale may lay the foundation for a drive towards support priced in at 1518.0, though possible support could emerge off the March 17 high at 1554.0 (black arrow). In the event we push higher, a shallow Quasimodo resistance resides at 1643.1, followed by another layer of Quasimodo resistance at 1667.7.
Weekly price appears poised to approach support at 1536.9, fading last week’s highs off 1645.5. Before we shake hands with 1536.9, though, daily support at 1550.3 must make an appearance.
Areas of consideration:
A breakout beneath the lower boundary of the current H4 bearish flag would be interesting, given take-profit targets associated with this formation tends to generate favourable risk/reward. However, traders should expect a floor to form off 1550.3: the daily support level.
A decisive H4 close above 1591.7/1593.0, one that disfigures the current H4 bearish flag pattern, will likely entice a wave of breakout buying to H4 Quasimodo resistance at 1643.1 as an initial target.
The accuracy, completeness and timeliness of the information contained on this site cannot be guaranteed. IC Markets does not warranty, guarantee or make any representations, or assume any liability regarding financial results based on the use of the information in the site.
News, views, opinions, recommendations and other information obtained from sources outside of www.icmarkets.com.au, used in this site are believed to be reliable, but we cannot guarantee their accuracy or completeness. All such information is subject to change at any time without notice. IC Markets assumes no responsibility for the content of any linked site.
The fact that such links may exist does not indicate approval or endorsement of any material contained on any linked site. IC Markets is not liable for any harm caused by the transmission, through accessing the services or information on this site, of a computer virus, or other computer code or programming device that might be used to access, delete, damage, disable, disrupt or otherwise impede in any manner, the operation of the site or of any user’s software, hardware, data or property.


