
EUR/USD:
The US dollar closed in the green for a second consecutive day on Wednesday, climbing above 90.00 and now eyeing the 90.50 level which marks the top-end of its recent range. US Q4 GDP growth also came in above expectations (2.9% vs. 2.7%) while Pending Home Sales rebounded 3.1%.
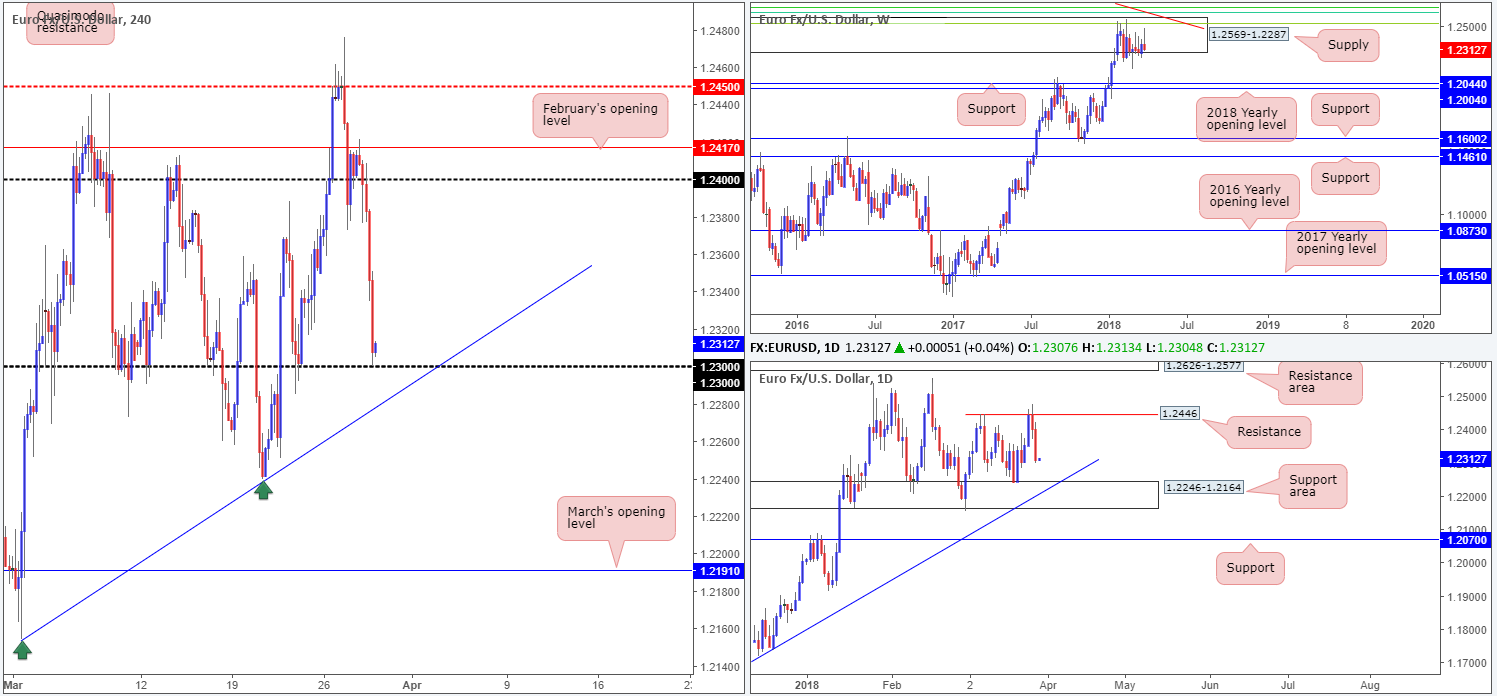
Once the euro closed below 1.24 the piece, as you can see, literally fell off of a cliff, nose-diving to the 1.23 region. This was a noted move to watch for in Wednesday’s technical report. Well done to any of our readers if you managed to jump aboard here!
Moving forward, we can see that a violation of 1.23 today could lead to a move being seen down to a nearby H4 trendline support etched from the low 1.2154.
In the shape of a near-full-bodied daily bearish candle, daily movement currently looks primed and ready to cross swords with a daily support area plotted at 1.2246-1.2164.
Meanwhile, up on the weekly timeframe the unit remains consolidating within the walls of a weekly supply zone at 1.2569-1.2287. Downside targets from this angle remain at 1.2044: a weekly support, followed closely by the 2018 yearly opening level at 1.2004.
Potential trading zones:
As both weekly and daily structures portend further selling, buying from 1.23 may be a chancy play despite H4 price mildly defending the line, as we write. The most we see from here is an intraday bounce (short covering) back up to 1.2340ish.
The main interest here, though, falls on a possible break of 1.23, followed by a downside move to the top edge of the aforementioned daily support area. Only problem with this, however, is the H4 trendline support! Realistically, this is not a line most traders would consider shorting into, no matter what the higher-timeframe structure indicates. As such, remaining flat until more conducive price action presents itself may be a path to consider.
Data points to consider today: German prelim CPI m/m; US core PCE price index m/m; Chicago PMI and Revised UoM consumer sentiment.
Areas worthy of attention:
Supports: 1.23; H4 trendline support; 1.2246-1.2164; 1.2044; 1.2004.
Resistances: 1.24; 1.2569-1.2287.
GBP/USD:
The British pound mirrored euro action on Wednesday, sliding aggressively lower on the back of a buoyant USD.
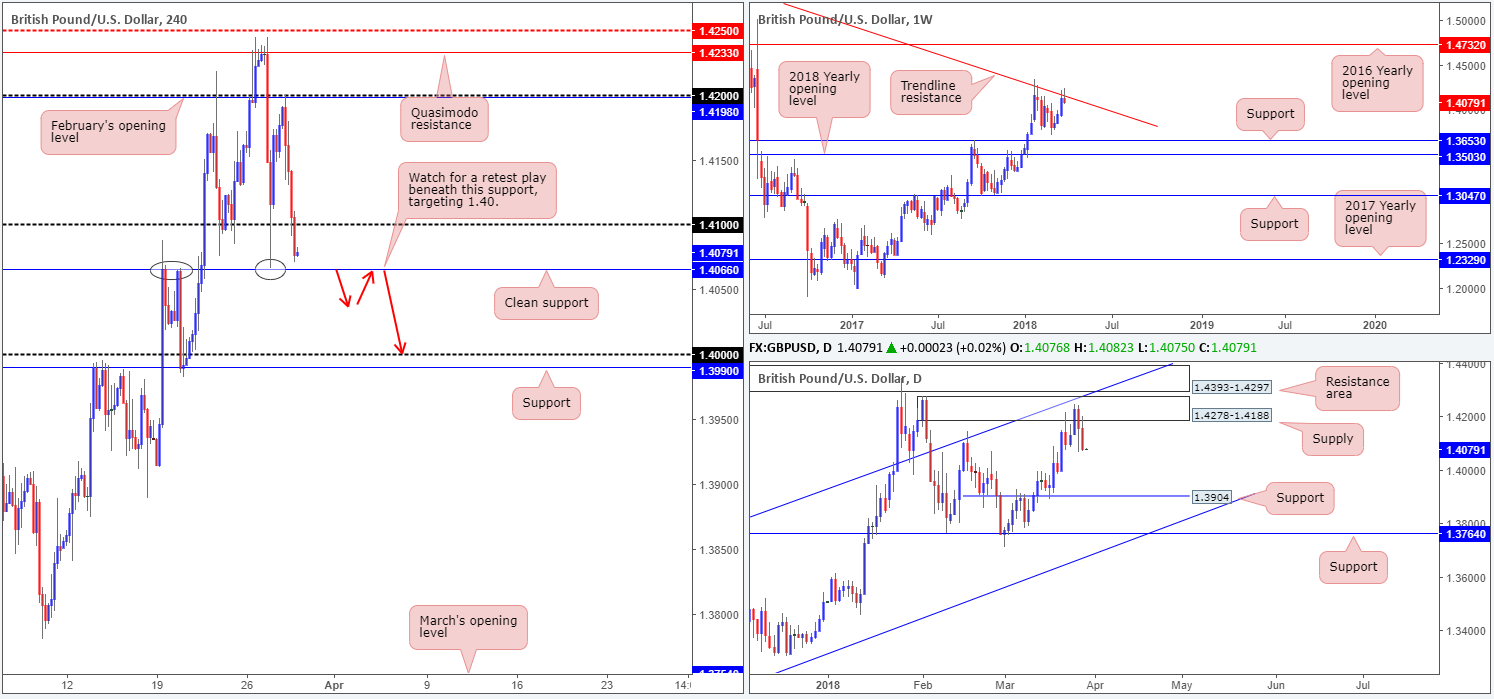
As is evident from the H4 timeframe this morning, the pair concluded trade closing beneath the 1.41 figure in strong fashion and is now on track to retest H4 support plotted at 1.4066. Price is likely to find some support from this level with it having been a strong barrier of support and resistance this month (see black circles) and also during February.
Over on the bigger picture, daily price extended its downside move from daily supply at 1.4278-1.4188 yesterday. Continued selling from this point could eventually see the daily support level at 1.3904 come into play. On the other side of the field, weekly movement can be seen interacting with a long-term weekly trendline resistance (taken from the high 1.5930), which is currently on track to close in the shape of nice-looking weekly bearish pin bar.
Potential trading zones:
Given that downside is favored on the higher timeframes, we do not anticipate much more than an intraday bounce from the H4 support mentioned above at 1.4066. The most we see is a retest of 1.41. For this reason, the team has noted to keep a watchful eye on a possible break of 1.4066. This – coupled with a strong retest in the shape of a full or near-full-bodied H4 bearish candle – would likely be enough evidence to suggest a move down to the key figure 1.40 (see red arrows).
Data points to consider today: UK current account, Final GDP q/q and Net lending to individuals m/m; US core PCE price index m/m; Chicago PMI and Revised UoM consumer sentiment.
Areas worthy of attention:
Supports: 1.4066; 1.40; 1.3904.
Resistances: 1.41; 1.4278-1.4188; weekly trendline resistance.
AUD/USD:
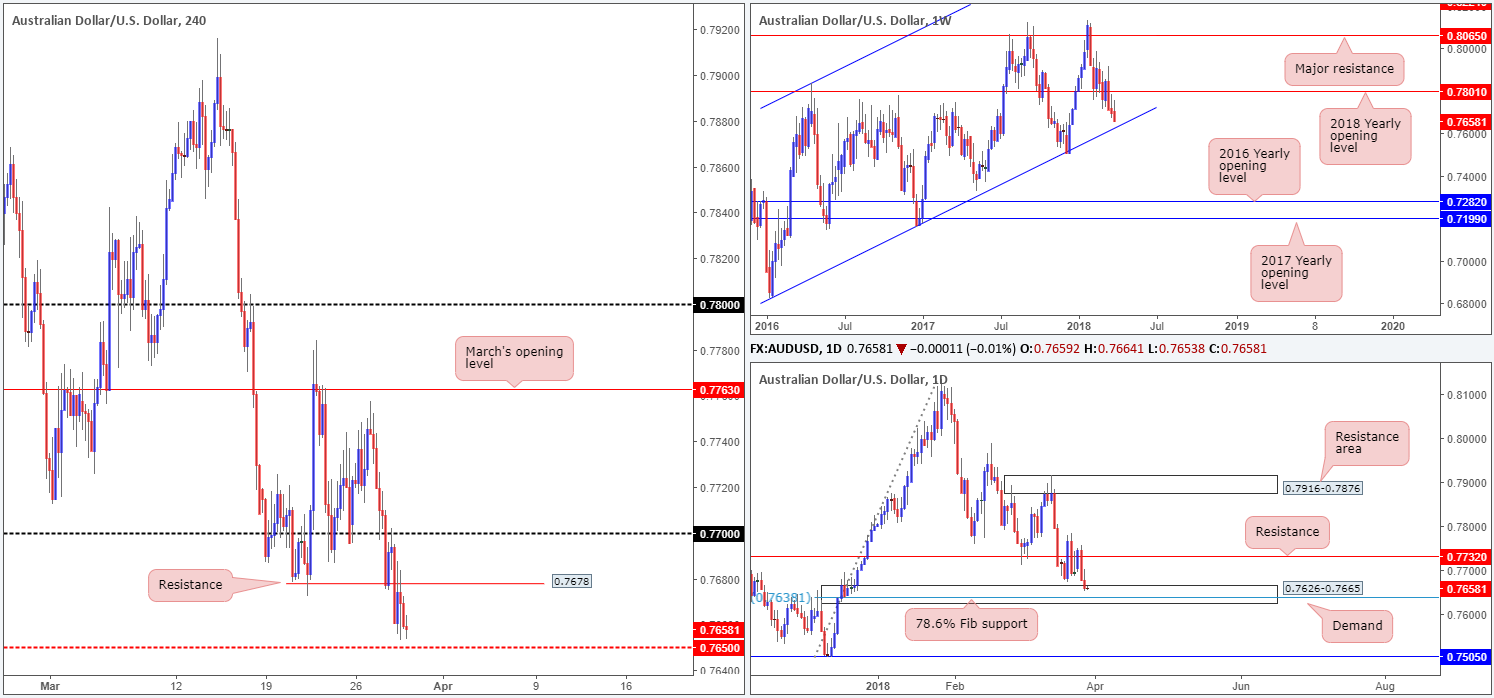
Going into the early hours of trade on Wednesday, the H4 candles attempted to push beyond 0.77 following a modest recovery from a H4 Quasimodo support at 0.7678. As you can see, the commodity currency failed to sustain gains outside of 0.77 and fell sharply lower as we moved into European hours. The move sliced through the noted Quasimodo (now acting resistance) and ended the day bottoming just north of a H4 mid-level support planted at 0.7650.
Also in our sights this morning is a daily demand base coming in at 0.7626-0.7665, which happens to house a 78.6% daily Fib support at 0.7638. In addition to this, there’s an attractive long-term weekly channel support extended from the low 0.6827 that intersects with the bottom edge of the aforementioned daily demand, more specifically, the daily 78.6% Fib support.
Potential trading zones:
The team has noted the 78.6% daily Fib support at 0.7638 (seen within the current daily demand) as a potential buy zone, given it is positioned within a daily demand and intersects with the weekly channel support mentioned above.
This could prove to be a reasonably big move seeing as we’re utilizing higher-timeframe areas. Therefore, stop-loss orders would be best placed 5-10 pips beyond the current daily demand with the initial upside target falling in at a daily resistance drawn from 0.7732.
Data points to consider today: US core PCE price index m/m; Chicago PMI and Revised UoM consumer sentiment.
Areas worthy of attention:
Supports: 0.7650; 0.7626-0.7665; 0.7638; weekly channel support.
Resistances: 0.77; 0.7678.
USD/JPY:
The US dollar is said to be bolstered by month/quarter-end flows along with a more constructive tone regarding trade wars.
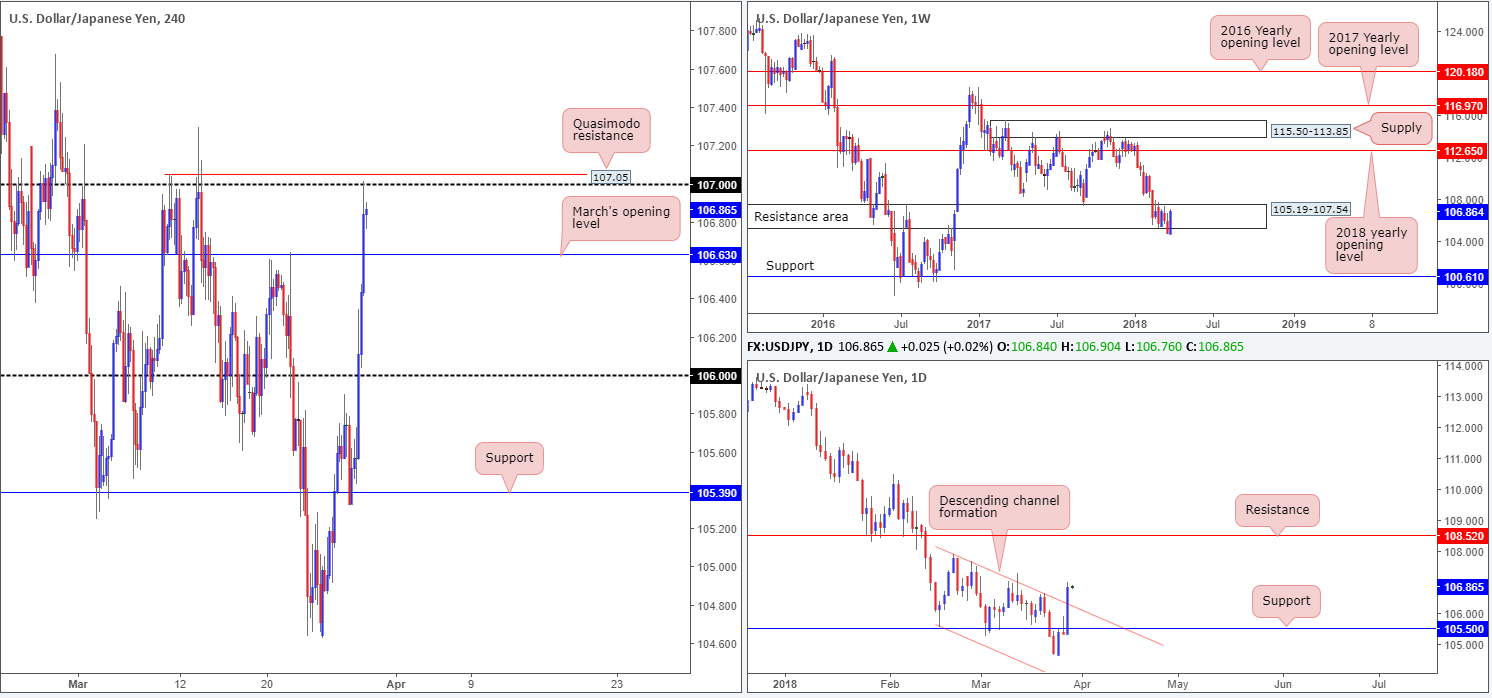
This sent the USD/JPY north on Wednesday, consequently picking apart multiple H4 tech resistances along the way. It’s only recently have we seen price attempt to stabilize after connecting with the 107 handle (positioned just ahead of a H4 Quasimodo resistance at 107.05).
In addition to the above movement, daily price smashed through a daily resistance level at 105.50 (now acting support) and a daily channel resistance (taken from the high 107.90). What’s also interesting is weekly price is seen driving high into 105.19-107.54. We initially thought this zone may act as a resistance area, but after yesterday’s strong push to the upside, we’re not so sure. The downside break of 105.19-107.54 two weeks back may very well have just been a fakeout (stop run) to push higher!
Potential trading zones:
In a nutshell we have the following noted:
- Weekly price could potentially push much higher.
- Daily price shows room to press as far north as a daily resistance coming in at 108.52.
- H4 action currently capped by 107/H4 Quasimodo resistance at 107.05.
Selling 107ish is not a move we have much faith in, largely because of the higher-timeframe picture, but also because of a nearby H4 support in the form of March’s opening level at 106.63. Should the unit print a H4 close above these levels (preferably followed by a retest); we believe longs will be favored up to as far as the 108 vicinity.
Data points to consider today: US core PCE price index m/m; Chicago PMI and Revised UoM consumer sentiment.
Areas worthy of attention:
Supports: 106.63; 105.50.
Resistances: 107; 107.05; 108.52.
USD/CAD:
As can be seen from the daily timeframe this morning, daily price extended its bounce from daily demand at 1.2803-1.2845 in recent movement. According to the technicals, this has firmly placed the daily resistance at 1.3001 on the radar. Weekly price, however, continues to hold its bearish stance after rejecting the weekly resistance area at 1.3006-1.3115.
Across on the H4 timeframe, we can see price took out 1.29 amid the later hours of US trade on Wednesday and is now on course to shake hands with a nearby H4 resistance area penciled in at 1.2946-1.2964. The other key thing to note on this scale is the key figure 1.30 lurking just above the current H4 resistance zone. This may act as a magnet to price and pull the unit north today. Remember 1.30 is not only a key psychological level; it is also a daily resistance as well!
Potential trading zones:
Irrespective of the direction one selects today, you’ll face potential opposition from either weekly or daily flow. Also, upside is incredibly limited on the H4 scale, given the nearby H4 resistance area and 1.30 handle. Similarly, an intraday sell has its downside limited by the recently broken 1.29 handle which is likely to act as support. Therefore, remaining on the sidelines may be the better path to take today.
Data points to consider today: US core PCE price index m/m; Chicago PMI and Revised UoM consumer sentiment; CAD GDP m/m.
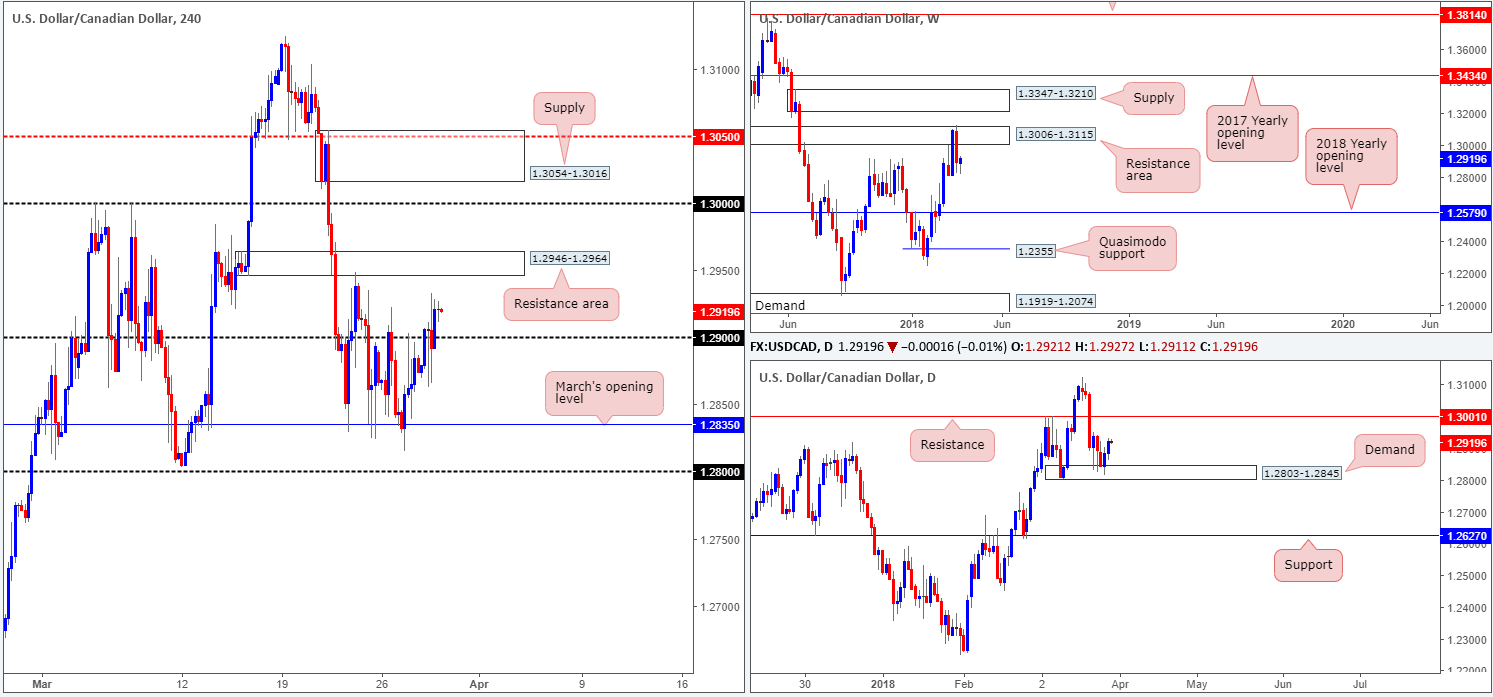
Areas worthy of attention:
Supports: 1.29; 1.2803-1.2845.
Resistances: 1.30; 1.3001; 1.2946-1.2964; 1.3006-1.3115.
USD/CHF:
Kicking things off from the weekly timeframe this morning, we can see that the Swissie is currently using the 0.9443-0.9515 area as a support base. Continued bidding from this point may eventually see price bump heads with the 2018 yearly opening level at 0.9744. Before we all go and slam those buy buttons, however, daily price is seen trading within a few pips of a robust supply zone coming in at 0.9666-0.9589.
Bolstered by an upbeat USD across the board, the H4 candles firmly crossed above the H4 mid-level resistance base at 0.9550 and the 20/03 high 0.9569, placing the 0.96 handle in sight. Most intraday traders will consider this a bullish cue.
Potential trading zones:
As the lower edge of daily supply is seen positioned at 0.9589, entering into a long position is not a trade we would label high probability. Even a retest play of 0.9550 is a chancy move given how closely located we are to the daily supply zone. Unfortunately, though, shorting this market is also a challenge knowing that weekly price is trading from an area of support right now (0.9443-0.9515).
Data points to consider today: US core PCE price index m/m; Chicago PMI and Revised UoM consumer sentiment; CHF KOF economic barometer.
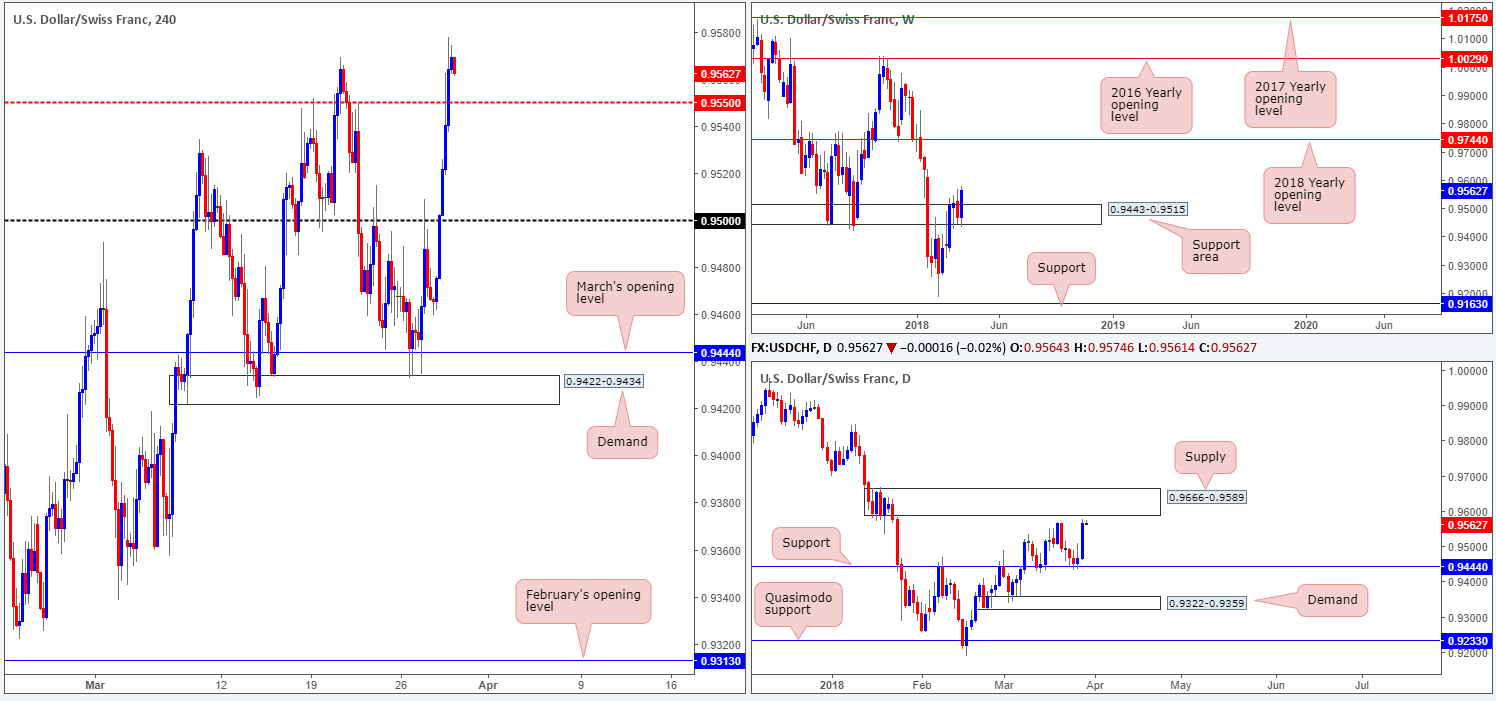
Areas worthy of attention:
Supports: 0.9550; 0.9443-0.9515.
Resistances: 0.96; 0.9744; 0.9666-0.9589.
DOW 30:
US equities are effectively unchanged this morning, down only 0.04% in recent trade. With that being the case, much of the following report will echo thoughts put forward in Wednesday’s analysis.
On the H4 scale, upside faces resistance from a 61.8% Fib resistance level at 24426, whereas to the downside, we can see a small demand base coming in at 23356-23452.
Weekly price is seen trading from a demand area drawn from 23242-23494. Note that this area houses both the aforementioned H4 demand area and also a 161.8% daily Fib ext. point at 23256.
Potential trading zones:
In light of recent trade, we are still expecting a follow-through move to the downside. Buying opportunities exist from the small H4 demand mentioned above at 23356-23452. To be on the safe side, though, we would strongly recommend placing stops beyond the weekly demand area noted above at 23242-23494.
Data points to consider today: US core PCE price index m/m; Chicago PMI and Revised UoM consumer sentiment.
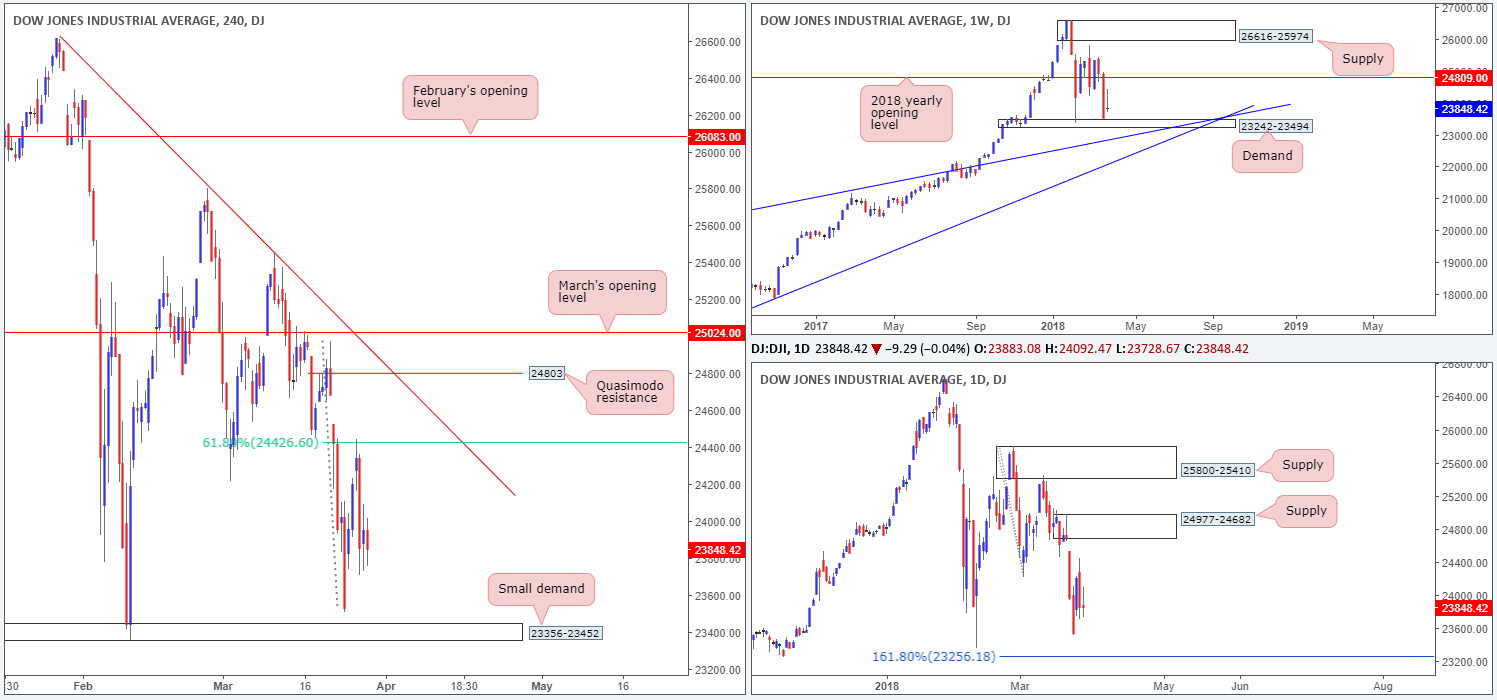
Areas worthy of attention:
Supports: 23242-23494; 23256; 23356-23452.
Resistances: 24426.
GOLD:
Having seen the USD elbow its way to higher prices on Wednesday, it was no surprise to see that bullion declined in value. As we hope is demonstrated clearly on the H4 timeframe this morning, the H4 candles bottomed amid later US hours after marginally breaching the lower edge of a H4 demand base coming in at 1324.7-1328.0. The current bout of recovery we’re seeing is likely the result of short covering using the stops tripped beneath the aforementioned H4 demand.
Despite H4 price showing signs of recovery, both the weekly and daily charts suggest lower prices could be on the cards. Weekly movement could potentially drop as far south as the 2018 yearly opening level at 1302.5, which happens to fuse with a long-term weekly channel support taken from the low 1122.8. A little lower on the curve, we can see that the daily bearish harmonic Gartley pattern that terminates (78.6% Fib retracement) around 1349.6 (and is closely positioned to a daily channel resistance extended from the high 1366.0) has been respected. The next port of call beneath here can be seen in the form of a daily support level plotted at 1308.4.
Potential trading zones:
As things stand, buying from the partially breached H4 demand area at 1324.7-1328.0 is not a trade that exhibits high potential, in our humble view. This is largely because of where we’re positioned on the bigger picture right now (see above). That being the case, the team is now eyeing lower prices.
A decisive H4 close beneath the current H4 demand that’s followed up with a successful retest as resistance would, as far as we can see, be enough to validate a short trade, targeting March’s opening level seen on the H4 timeframe at 1317.2, followed then by the daily support level located at 1308.4.
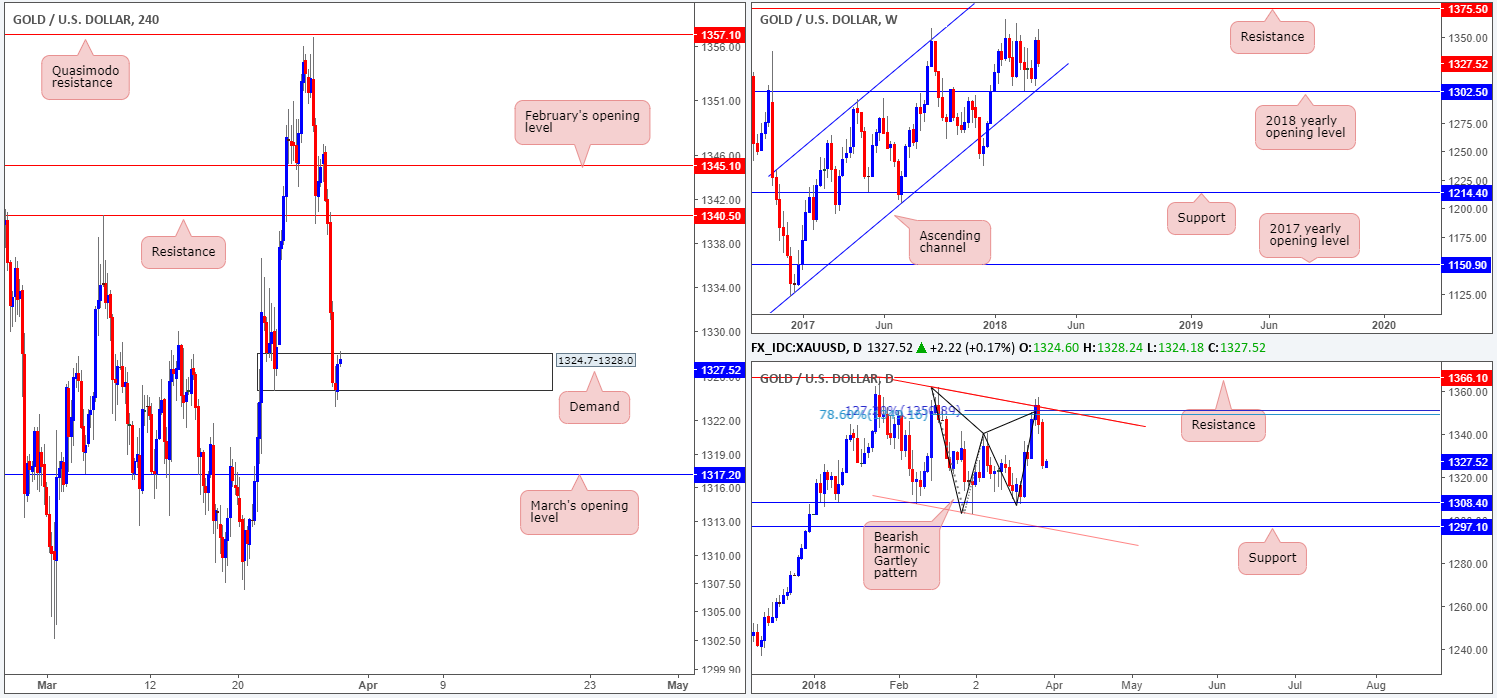
Areas worthy of attention:
Supports: 1324.7-1328.0; 1317.2; 1308.4; 1302.5.
Resistances: 1349.6; daily channel resistance.
This site has been designed for informational and educational purposes only and does not constitute an offer to sell nor a solicitation of an offer to buy any products which may be referenced upon the site. The services and information provided through this site are for personal, non-commercial, educational use and display. IC Markets does not provide personal trading advice through this site and does not represent that the products or services discussed are suitable for any trader. Traders are advised not to rely on any information contained in the site in the process of making a fully informed decision.
This site may include market analysis. All ideas, opinions, and/or forecasts, expressed or implied herein, information, charts or examples contained in the lessons, are for informational and educational purposes only and should not be construed as a recommendation to invest, trade, and/or speculate in the markets. Any trades, and/or speculations made in light of the ideas, opinions, and/or forecasts, expressed or implied herein, are committed at your own risk, financial or otherwise.
The use of the site is agreement that the site is for informational and educational purposes only and does not constitute advice in any form in the furtherance of any trade or trading decisions.
The accuracy, completeness and timeliness of the information contained on this site cannot be guaranteed. IC Markets does not warranty, guarantee or make any representations, or assume any liability with regard to financial results based on the use of the information in the site.
News, views, opinions, recommendations and other information obtained from sources outside of www.icmarkets.com.au, used in this site are believed to be reliable, but we cannot guarantee their accuracy or completeness. All such information is subject to change at any time without notice. IC Markets assumes no responsibility for the content of any linked site. The fact that such links may exist does not indicate approval or endorsement of any material contained on any linked site.
IC Markets is not liable for any harm caused by the transmission, through accessing the services or information on this site, of a computer virus, or other computer code or programming device that might be used to access, delete, damage, disable, disrupt or otherwise impede in any manner, the operation of the site or of any user’s software, hardware, data or property.


