
DXY:
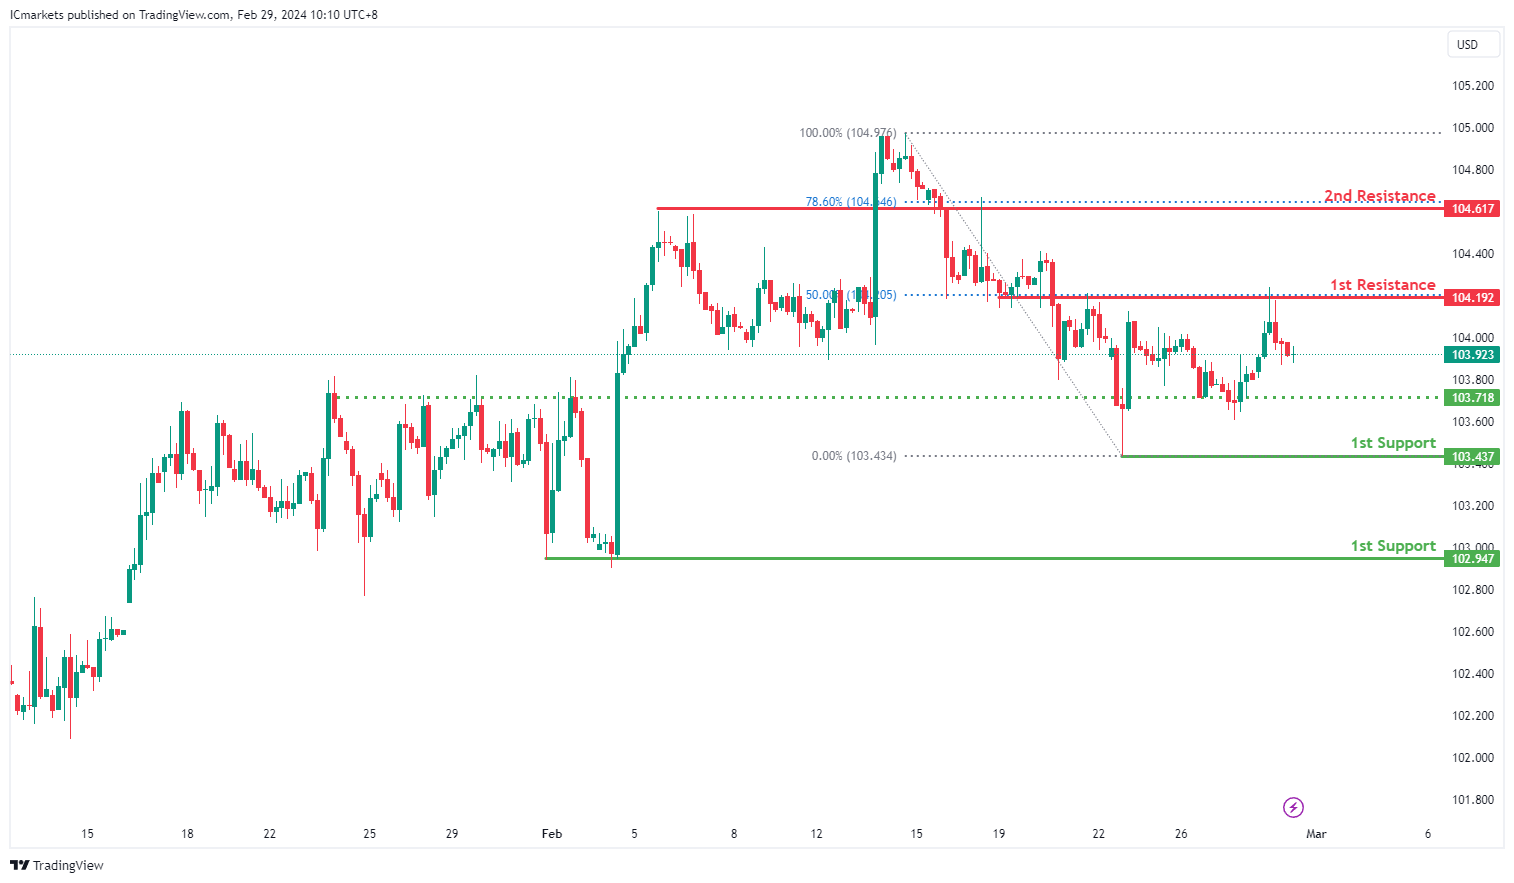
The DXY (Dollar Index) chart currently indicates a bearish momentum, suggesting a potential continuation towards the 1st support level.
The 1st support at 103.43 is identified as a swing low support, indicating its significance as a level where buying interest may emerge to support the price. This level aligns with previous price action, reinforcing its potential as a support area.
Additionally, the 2nd support at 102.94 is characterized as a multi-swing low support, further strengthening its importance as a level where buyers have historically intervened to prevent further decline. This level provides additional confirmation of potential support.
On the resistance side, the 1st resistance level at 104.19 is noted for its presence as an overlap resistance and aligns with the 50% Fibonacci Retracement level. This suggests its historical significance as a barrier where selling pressure may increase, potentially limiting upward movement.
Moreover, the 2nd resistance at 104.61 is highlighted for its presence as an overlap resistance and coincides with the 78.60% Fibonacci Retracement level. This reinforces its potential as a significant resistance area, where selling interest may intensify.
Additionally, the intermediate support at 103.71 is identified as an overlap support, providing further reinforcement to the potential support area.
EUR/USD:
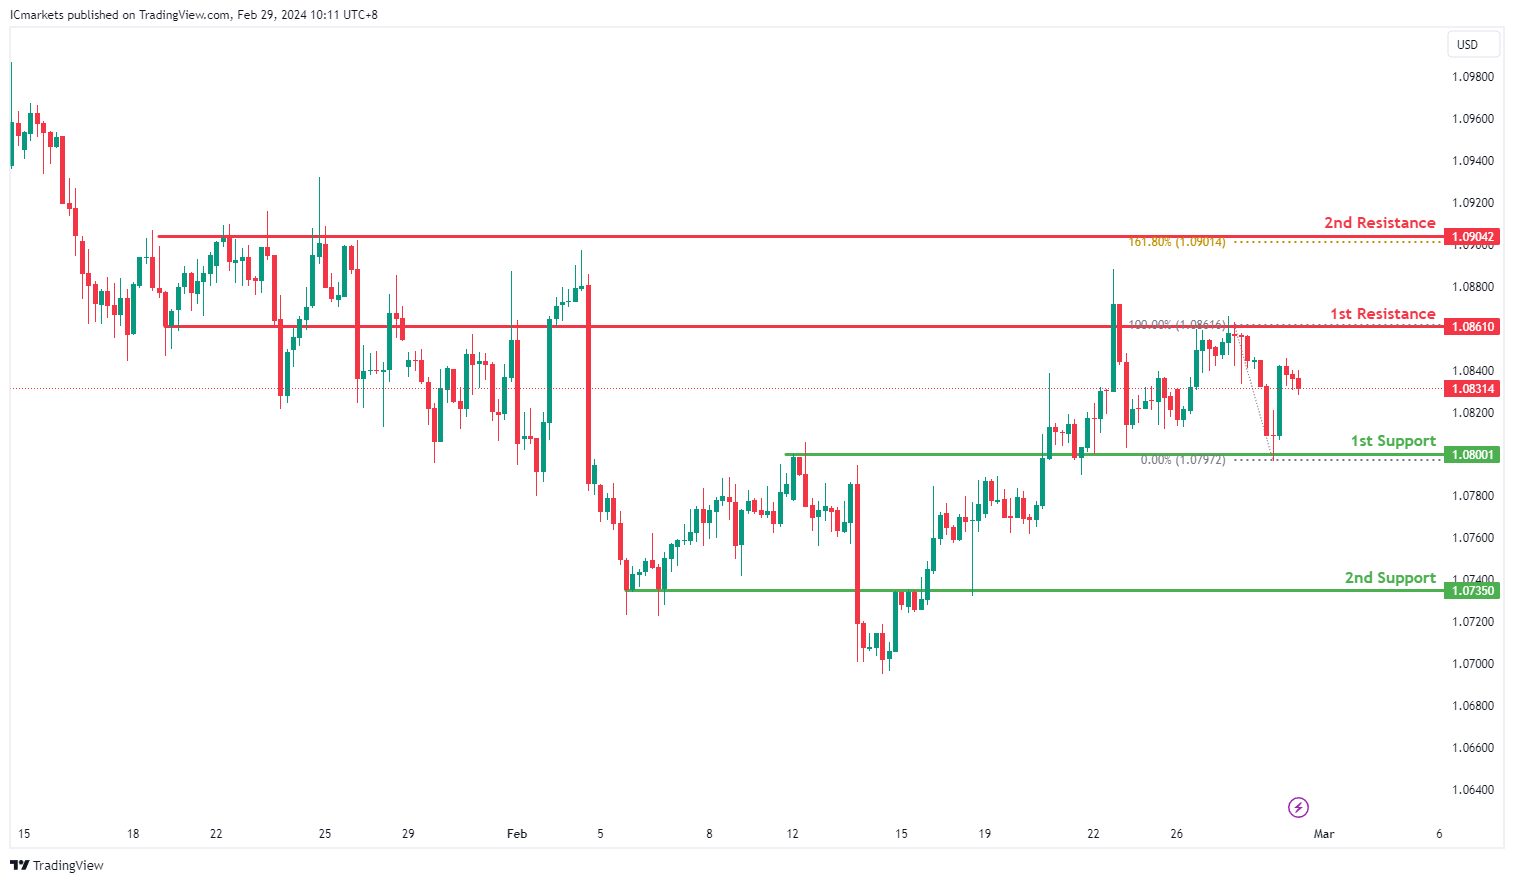
The EUR/USD chart currently exhibits bullish momentum, although short-term price action suggests a potential drop to the 1st support before rebounding towards the 1st resistance.
The 1st support level at 1.0800 is identified as an overlap support, indicating its historical significance as a level where buying interest has previously emerged to support the price. Traders may look to this level as a potential area for price to find support in the short term.
Furthermore, the 2nd support at 1.0735 is also characterized as an overlap support, reinforcing its importance as a level where buyers have historically intervened to prevent further decline. This level provides additional confirmation of potential support.
On the resistance side, the 1st resistance level at 1.0861 is identified as an overlap resistance, suggesting its historical significance as a barrier where selling pressure may increase, potentially limiting upward movement in the short term.
Additionally, the 2nd resistance at 1.0904 is noted for its presence as a multi-swing high resistance, further reinforcing its importance as a level where selling interest may intensify, potentially capping the upward movement of prices.
EUR/JPY:
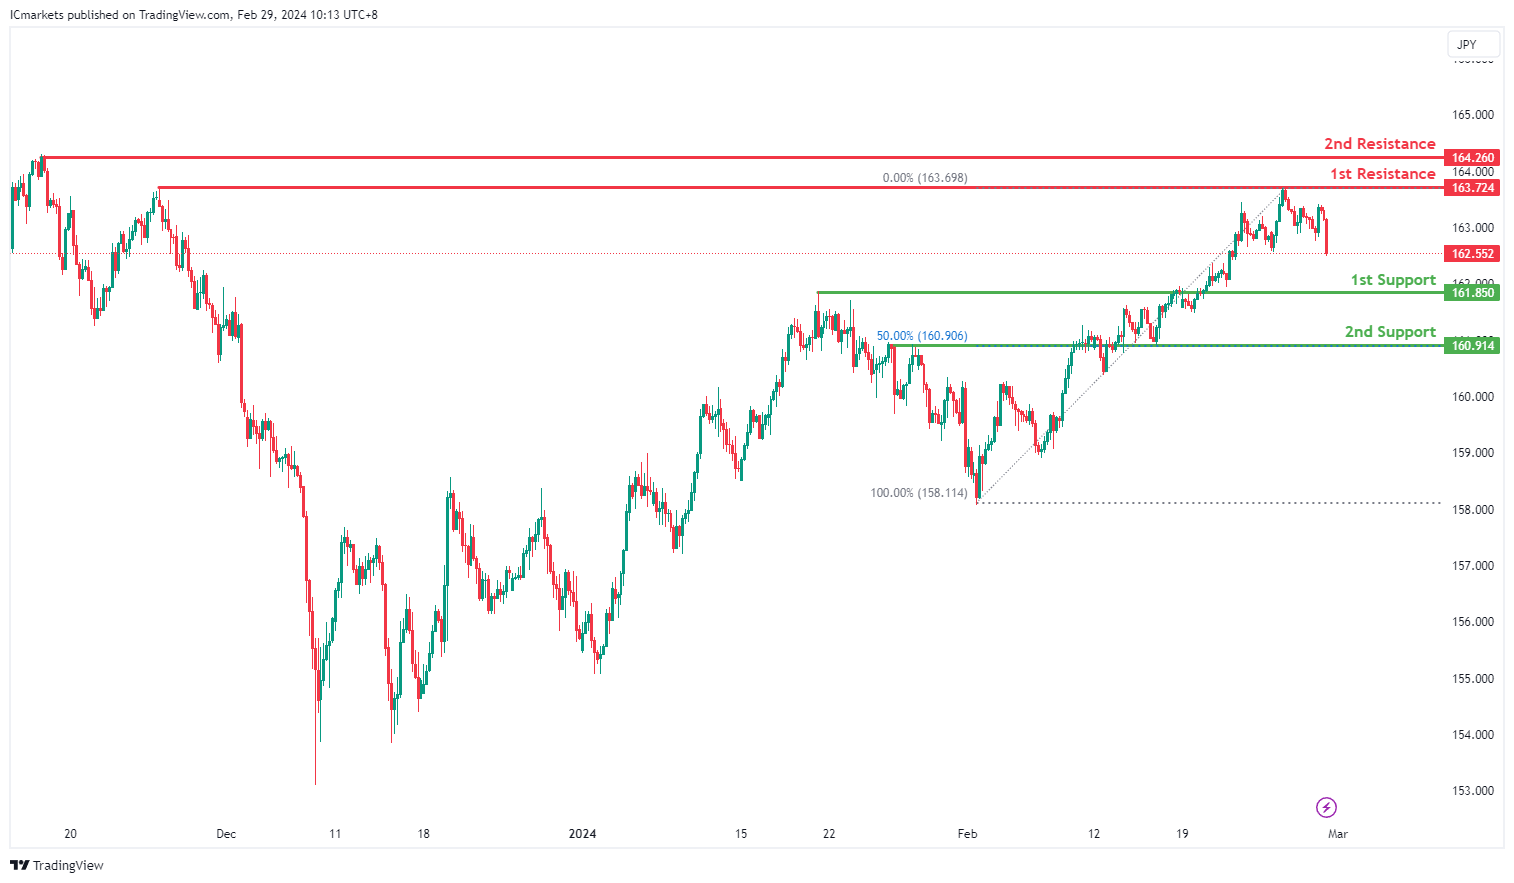
The EUR/JPY chart indicates a bearish momentum, suggesting a potential continuation towards the 1st support level.
At 161.85, the 1st support level presents an overlap support, indicating historical significance as a level where buying interest has emerged, potentially providing support for the price.
Further reinforcing potential support, the 2nd support at 160.91 aligns with an overlap support and the 50% Fibonacci Retracement level, strengthening its significance as a level where buyers may intervene to prevent further decline.
On the resistance side, the 1st resistance at 163.72 signifies a multi-swing high resistance, suggesting a notable barrier to upward movement. Traders may observe increased selling pressure around this level.
Additionally, the 2nd resistance at 164.26 is characterized by a swing high resistance, further validating its importance as a level where selling interest may intensify.
EUR/GBP:
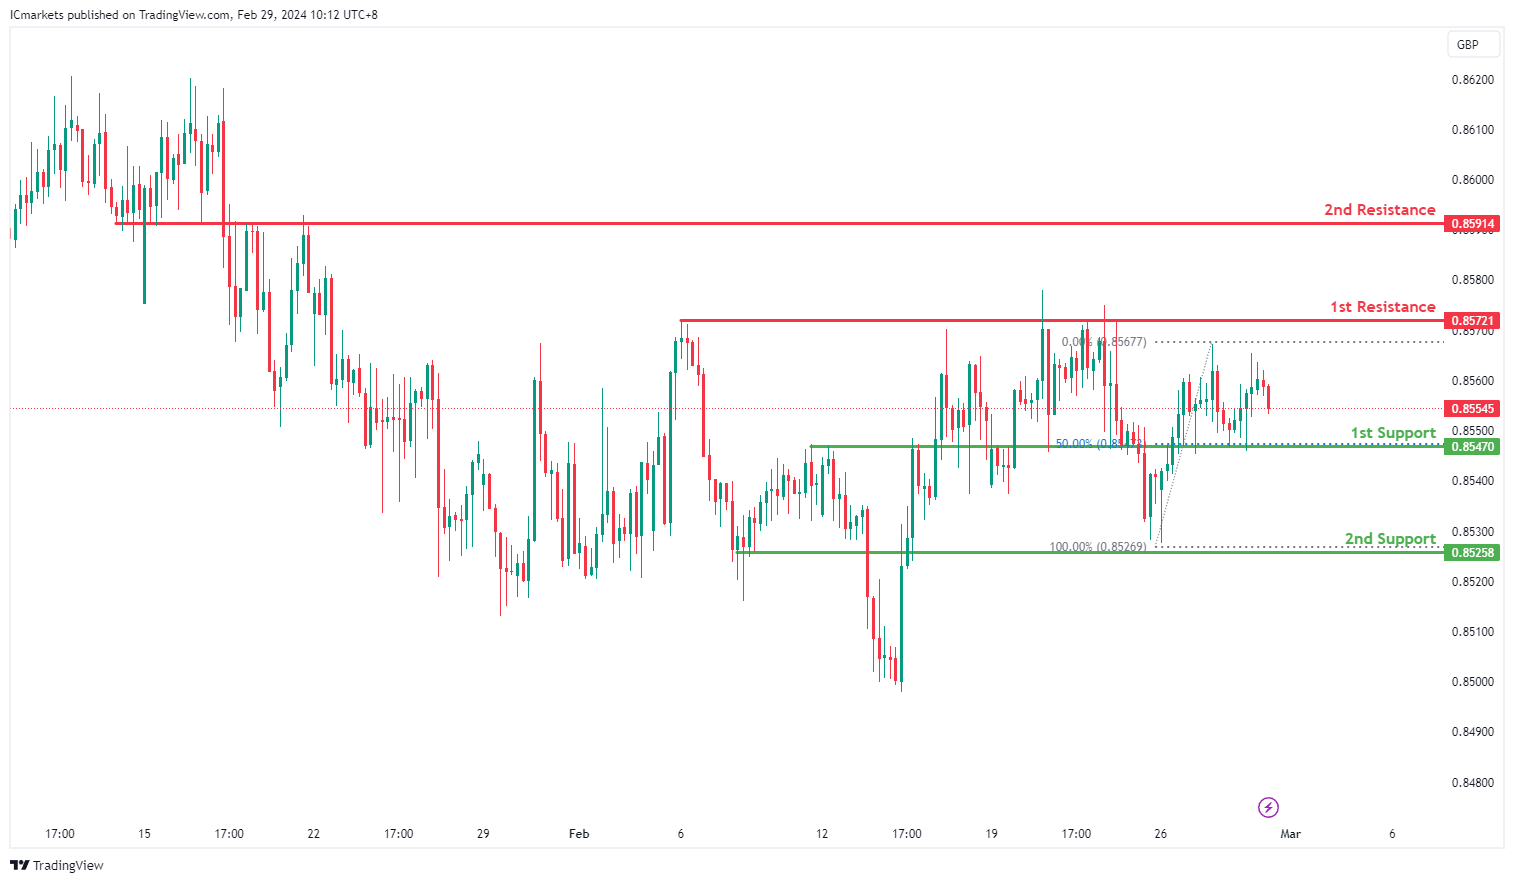
The EUR/GBP chart currently reflects neutral momentum, suggesting a potential fluctuation between the 1st resistance and 1st support levels.
The 1st support at 0.8547 is notable as it aligns with an overlap support and the 50% Fibonacci Retracement level, indicating its historical significance as a level where buying interest has emerged and providing potential support for the price.
Further reinforcing potential support, the 2nd support at 0.8525 represents an overlap support, adding to its significance as a level where buyers may intervene to prevent further decline.
On the resistance side, the 1st resistance at 0.8572 signifies a multi-swing high resistance, suggesting a significant barrier to upward movement. Traders may observe increased selling pressure around this level.
Additionally, the 2nd resistance at 0.8591 is characterized by an overlap resistance, further validating its importance as a level where selling interest may intensify.
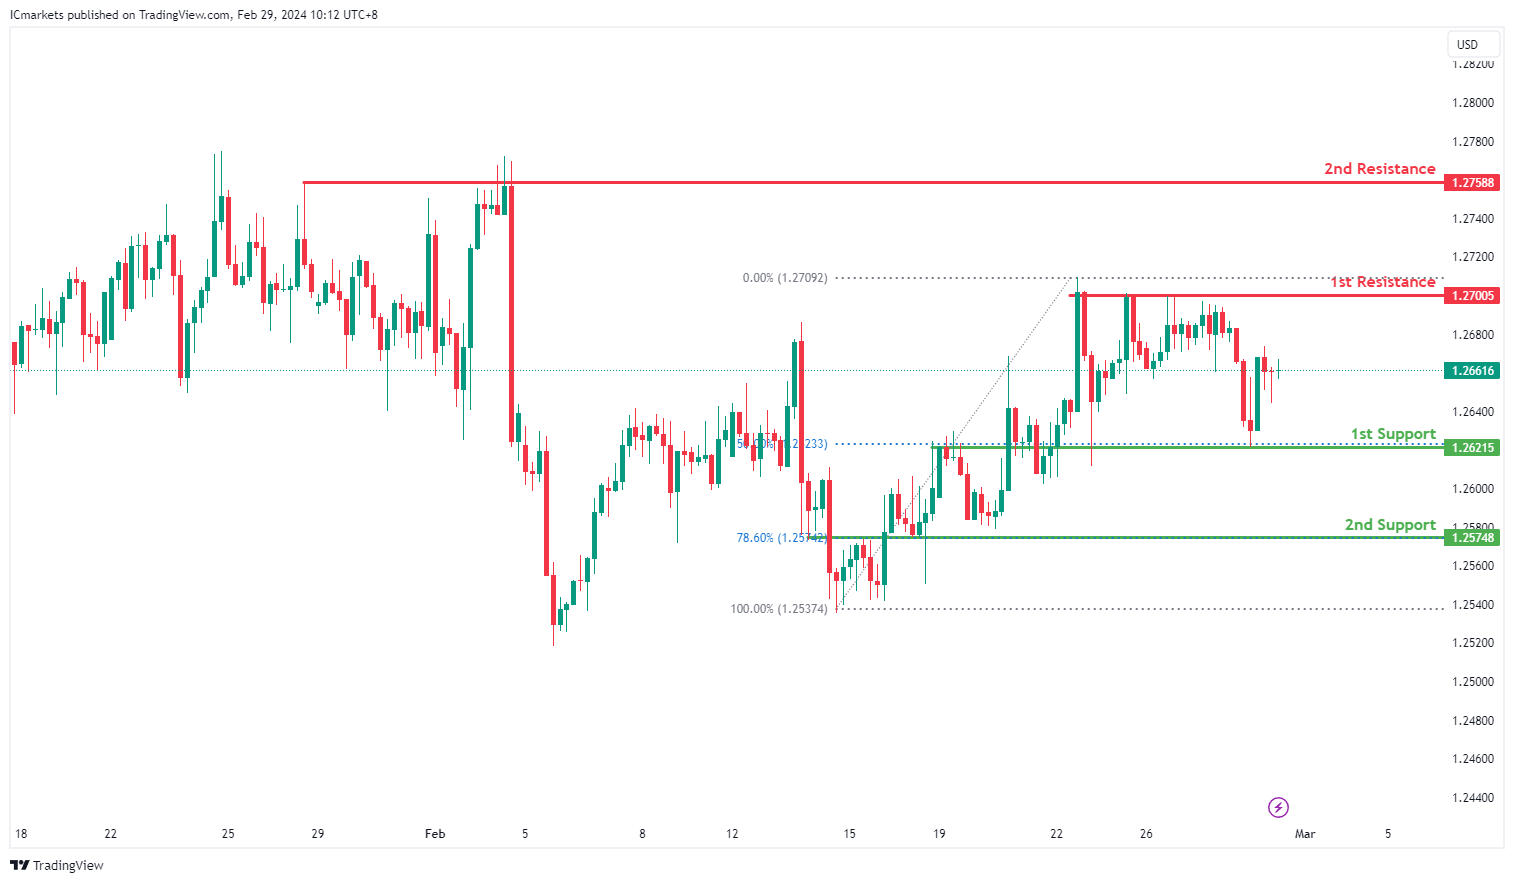
GBP/USD:
The GBP/USD chart indicates a bullish trend, although there’s a possibility of a short-term decline towards the 1st support before rebounding towards the 1st resistance.
The 1st support level at 1.2621 is significant as it aligns with an overlap support, suggesting historical buying interest at this level, particularly marked by the 50% Fibonacci Retracement.
Further reinforcing potential support, the 2nd support at 1.2574 also corresponds to an overlap support, accentuated by the presence of the 78.60% Fibonacci Retracement, indicating a historically strong area where buyers intervened.
On the resistance side, the 1st resistance at 1.2700 represents a multi-swing high resistance, historically acting as a barrier to upward movement due to increased selling pressure.
Likewise, the 2nd resistance at 1.2758 also serves as a multi-swing high resistance, signaling another significant level where selling interest may intensify, potentially hindering further upward momentum.
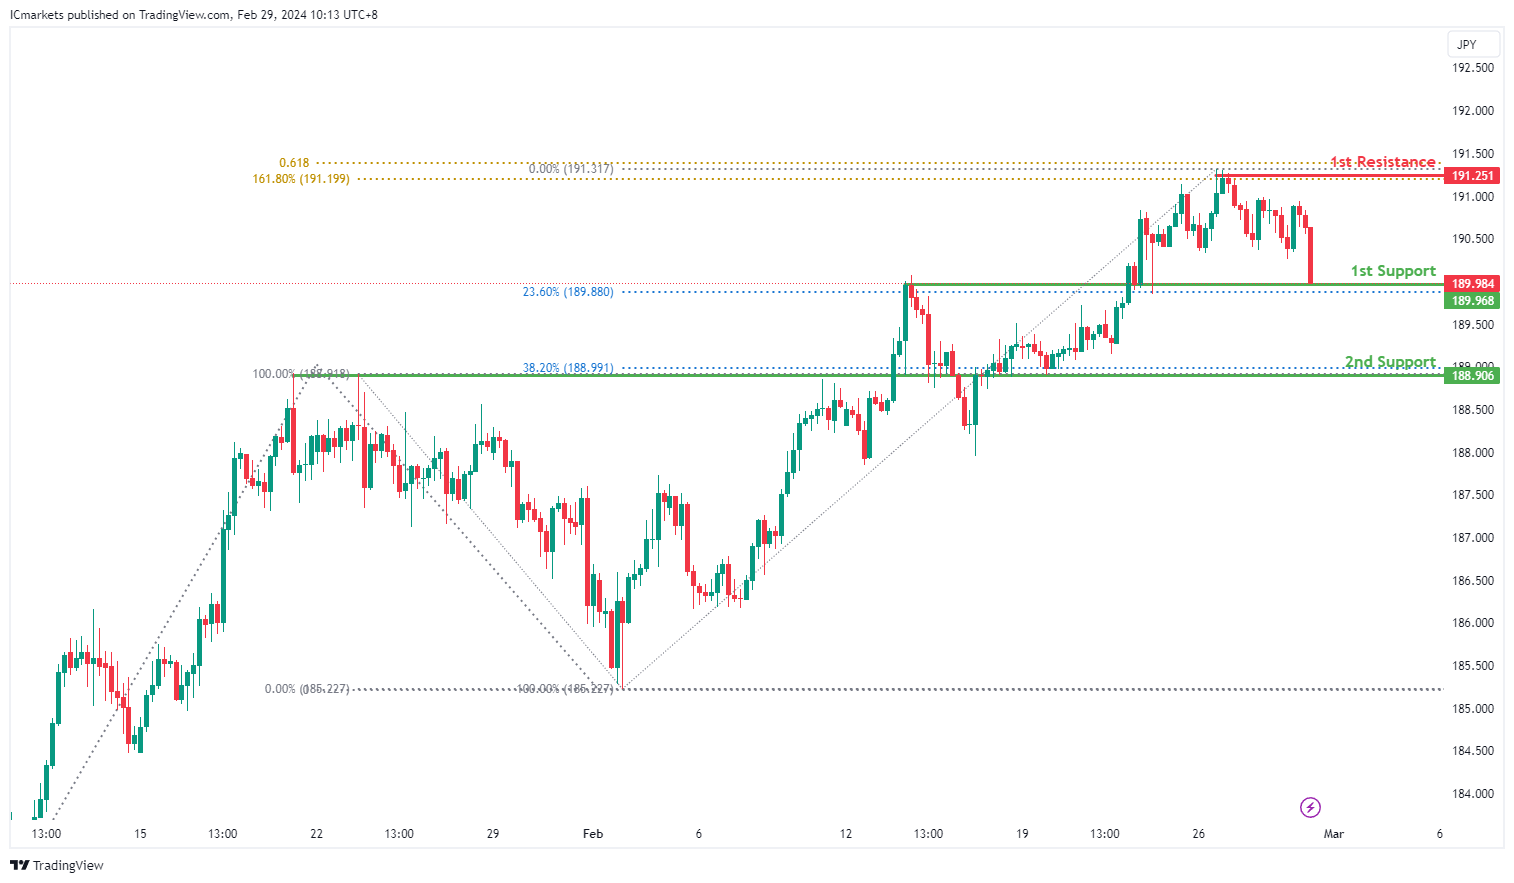
GBP/JPY:
The GBP/JPY chart currently exhibits bearish momentum, suggesting a potential bearish break off the 1st support level and a subsequent drop towards the 2nd support.
The 1st support at 189.96 is significant as it aligns with an overlap support and the 23.60% Fibonacci Retracement level, indicating historical buying interest and potential support for the price.
Further reinforcing potential support, the 2nd support at 188.90 coincides with an overlap support and the 38.20% Fibonacci Retracement level, adding to its significance as a level where buyers may intervene to prevent further decline.
On the resistance side, the 1st resistance at 191.25 represents a multi-swing high resistance, indicating a significant barrier to upward movement. This level is further validated by the presence of the 61.80% Fibonacci Projection and the 161.80% Fibonacci Extension, suggesting Fibonacci confluence and reinforcing its importance as a resistance level.
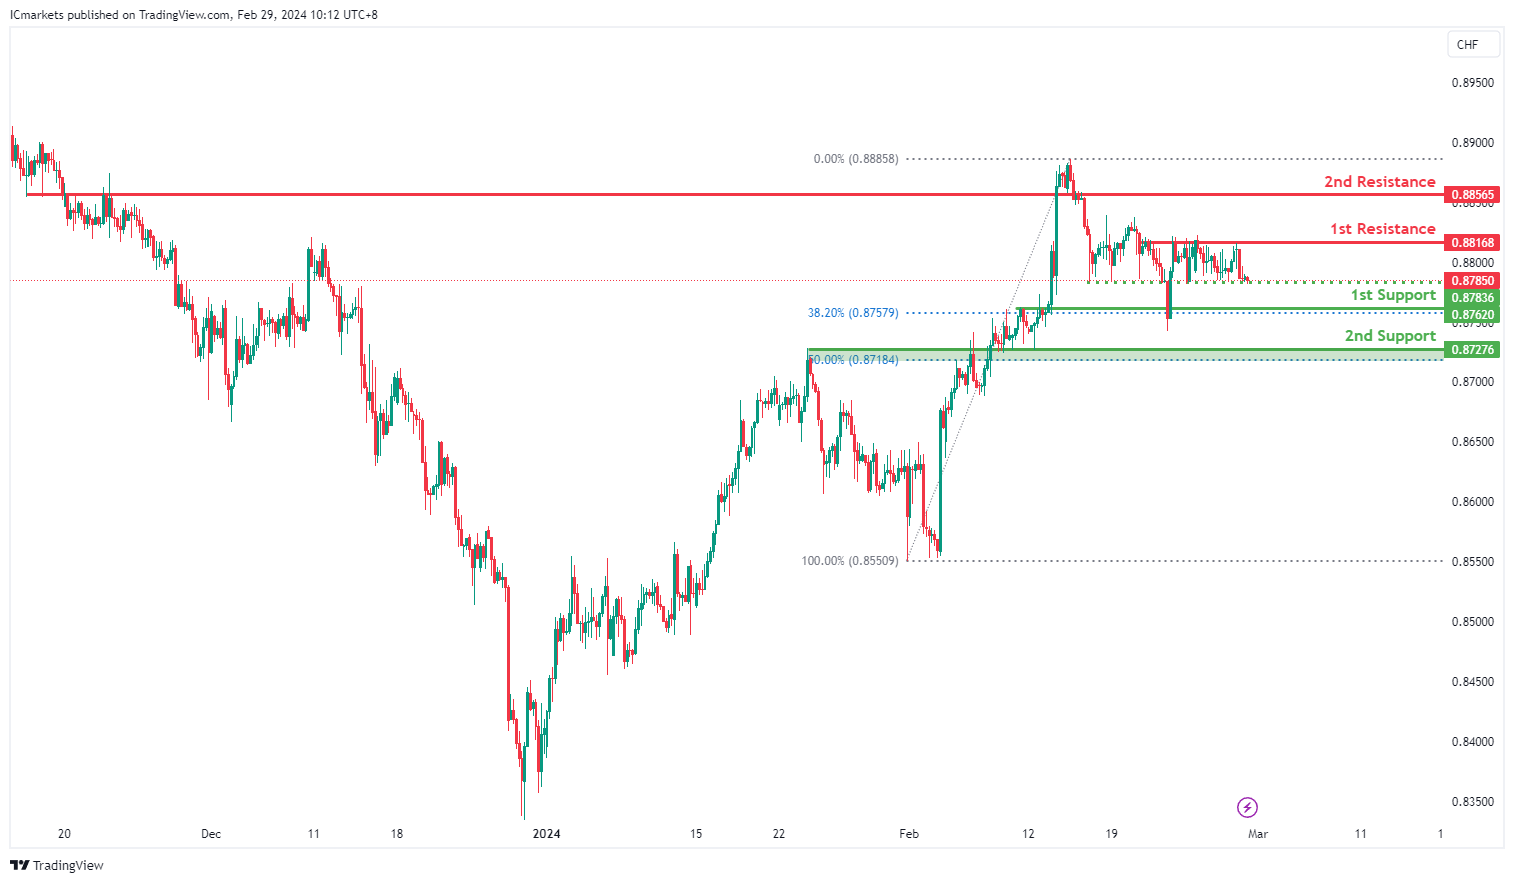
USD/CHF:
The USD/CHF chart is displaying bearish momentum, suggesting a potential continuation towards the 1st support.
The 1st support level at 0.8783 is notable as it aligns with an overlap support, indicating historical significance as a level where buying interest has emerged in the past.
Further reinforcing potential support, the 2nd support at 0.8727 corresponds to an overlap support and is also marked by the 50% Fibonacci Retracement, adding to its significance as a level where buyers may intervene.
On the resistance side, the 1st resistance at 0.8816 represents a multi-swing high resistance, historically impeding upward movement due to increased selling pressure.
Additionally, the 2nd resistance at 0.8856 acts as an overlap resistance, signaling another significant level where selling interest may intensify, potentially limiting further upward momentum.
The intermediate support at 0.8783 provides additional confirmation as an overlap support, potentially strengthening its role as a level where buying interest could reemerge.
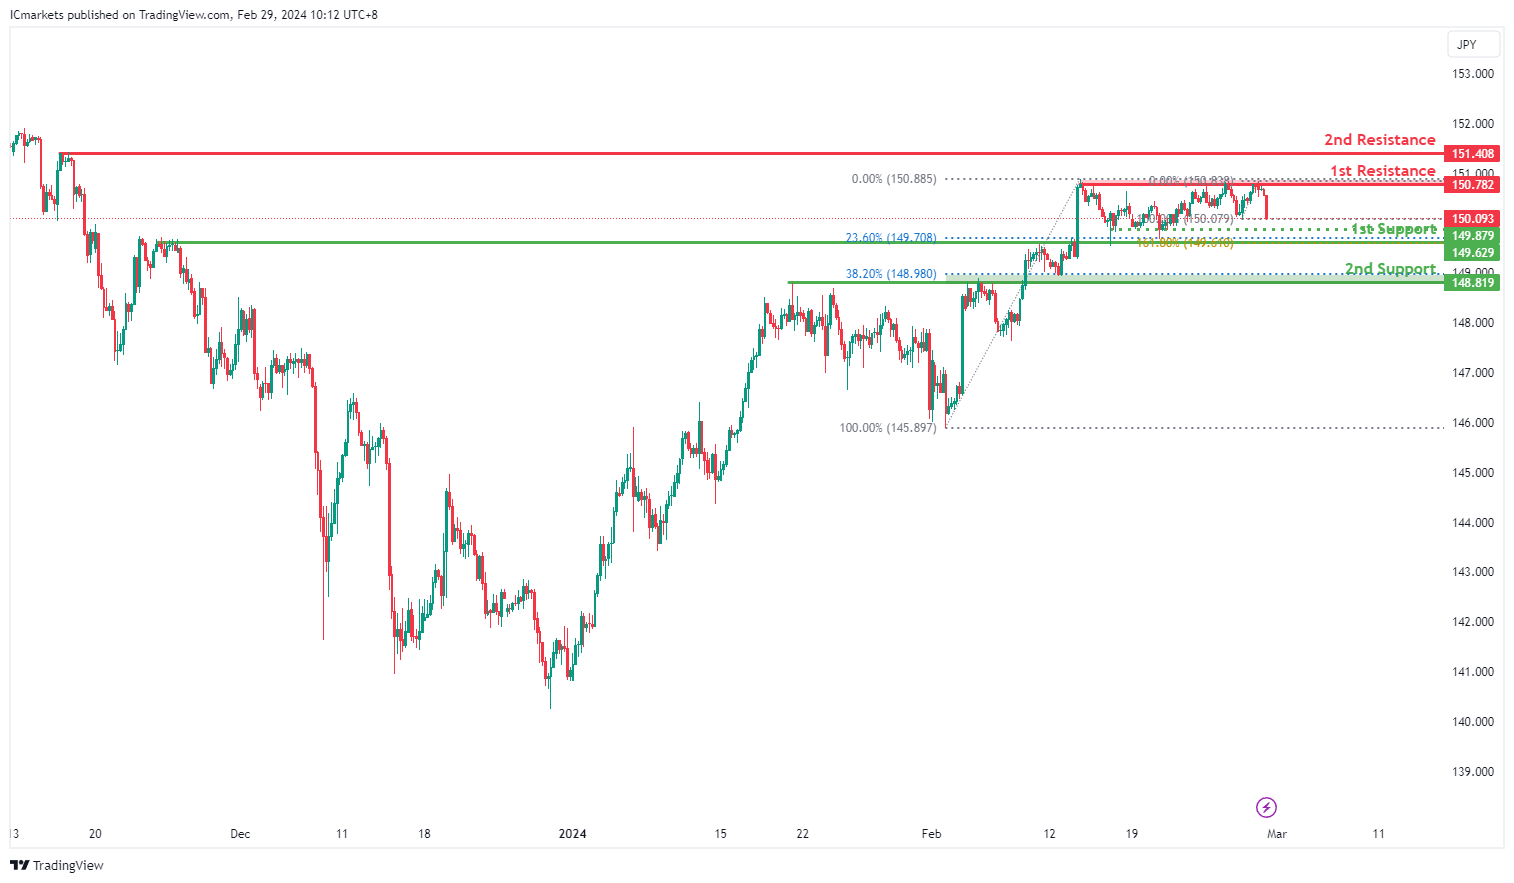
USD/JPY:
The USD/JPY chart currently indicates bearish momentum, suggesting a potential continuation towards the 1st support level.
The 1st support at 147.62 is notable for its alignment with an overlap support and the 23.60% Fibonacci Retracement, indicating its historical significance as a level where buying interest has emerged and providing potential support for the price.
Further reinforcing potential support, the 2nd support at 148.81 corresponds to an overlap support and the 38.20% Fibonacci Retracement, adding to its significance as a level where buyers may intervene to support the price.
On the resistance side, the 1st resistance at 150.78 represents a multi-swing high resistance, historically impeding upward movement due to increased selling pressure.
Additionally, the 2nd resistance at 151.40 acts as a swing high resistance, suggesting another significant level where selling interest may intensify, potentially limiting further upward momentum.
The intermediate support at 149.87 further strengthens potential support, aligning with a multi-swing low support, indicating a level where buying interest could reemerge to support the price.
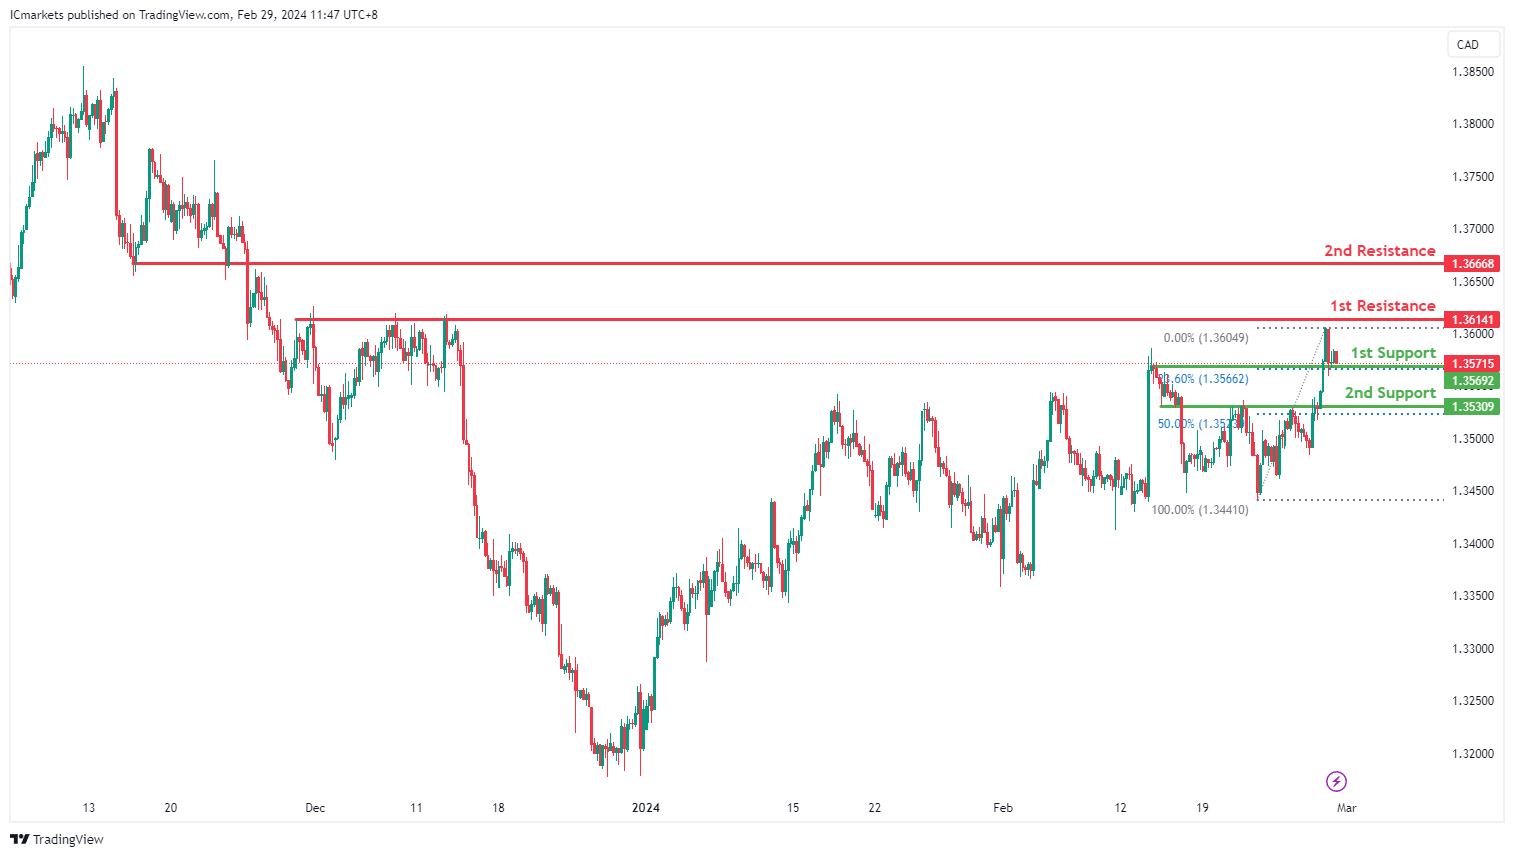
USD/CAD:
The USD/CAD chart currently exhibits an overall bullish momentum. In this context, there is a potential scenario for price to fall towards the 1st support before resuming the uptrend.
The 1st support level at 1.3569 is identified as an overlap support that aligns with the 23.60% Fibonacci retracement level. Further below, the 2nd support level at 1.3530 is also marked as an overlap support that aligns close to the 50.00% Fibonacci retracement level, reinforcing its significance as a key support level.
To the upside, the 1st resistance level at 1.3614 is identified as a pullback resistance. Higher up, the 2nd resistance level at 1.3666 is also marked as a pullback resistance, further highlighting its importance as a potential resistance zone.
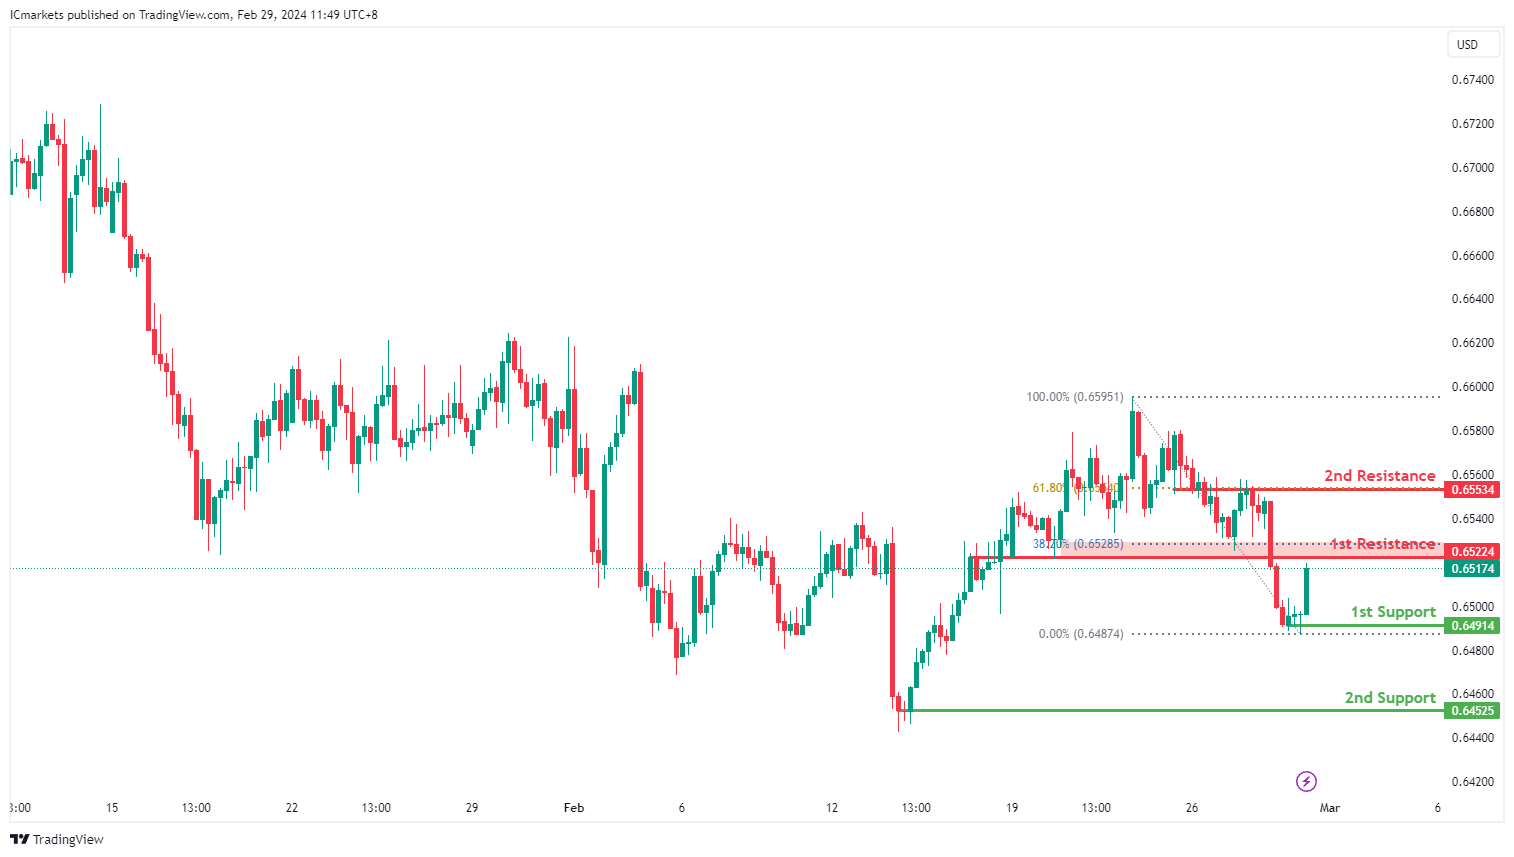
AUD/USD:
The AUD/USD chart currently exhibits an overall bearish momentum. However, there is a potential scenario for price to rise towards the 1st resistance before resuming the downtrend.
The 1st resistance level at 0.6522 is identified as an overlap resistance that aligns close to the 38.20% Fibonacci Retracement level. Higher up, the 2nd resistance level at 0.6553 is also noted as an overlap resistance that aligns with the 61.80% Fibonacci Retracement level, further highlighting its importance as a potential resistance zone.
To the downside, the 1st support level at 0.6491 is identified as a pullback support. Further below, the 2nd support level at 0.6452 is also marked as a pullback support, further emphasizing its importance as a potential support zone.
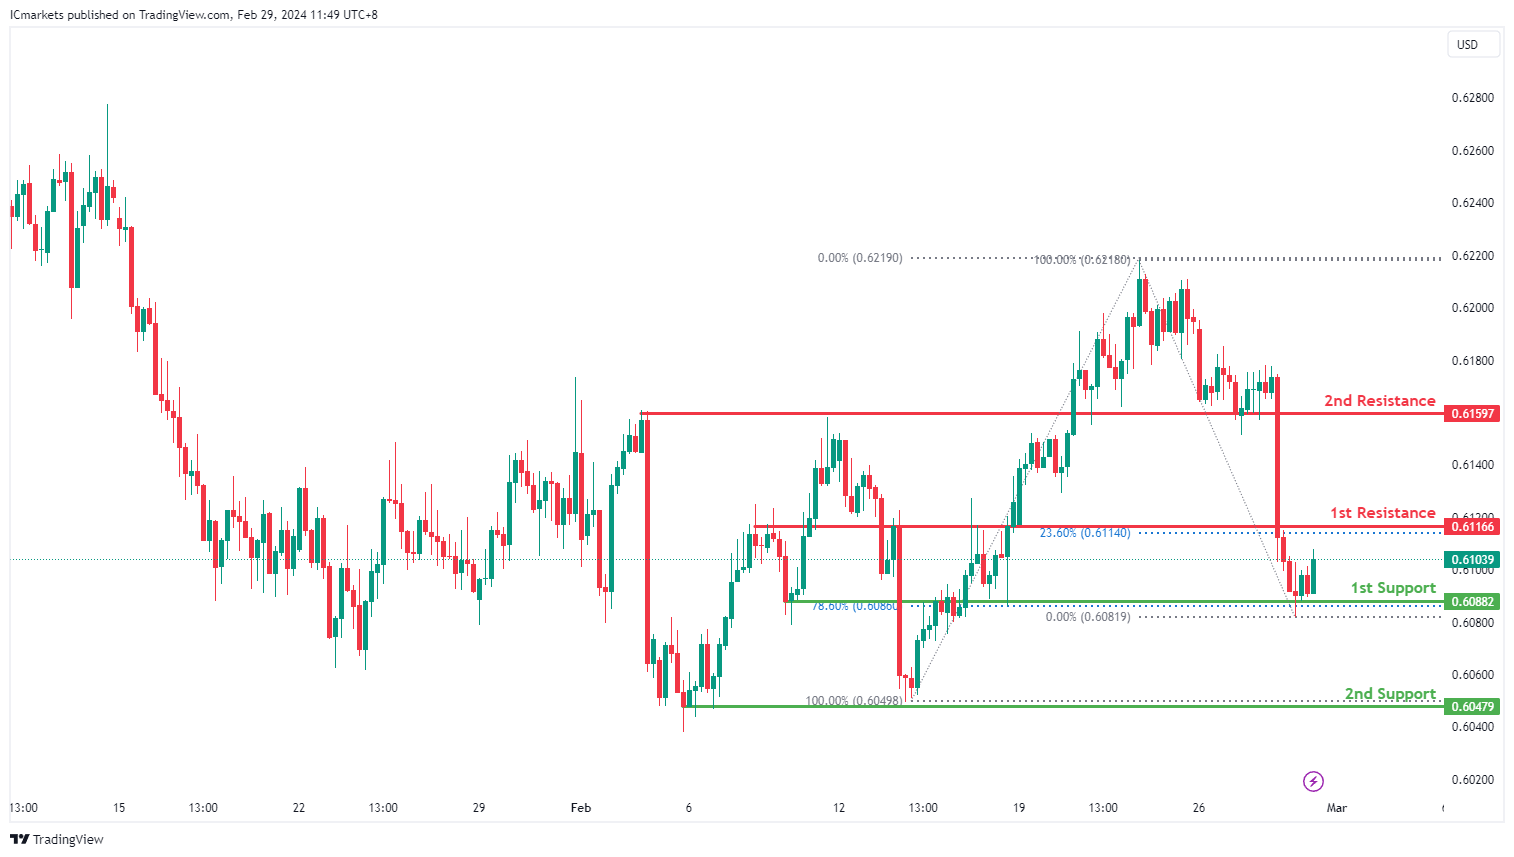
NZD/USD
The NZD/USD chart currently exhibits an overall bearish momentum. However, there is a potential scenario for price to rise towards the 1st resistance before resuming the downtrend.
The 1st resistance level at 0.6116 is identified as an overlap resistance that aligns with the 23.60% Fibonacci Retracement level. Higher up, the 2nd resistance level at 0.6159 is also noted as an overlap resistance, further highlighting its importance as a potential resistance zone.
To the downside, the 1st support level at 0.6088 is identified as an overlap support that aligns with the 78.60% Fibonacci Retracement level. Further below, the 2nd support level at 0.6047 is marked as a pullback support, further emphasizing its importance as a potential support zone.
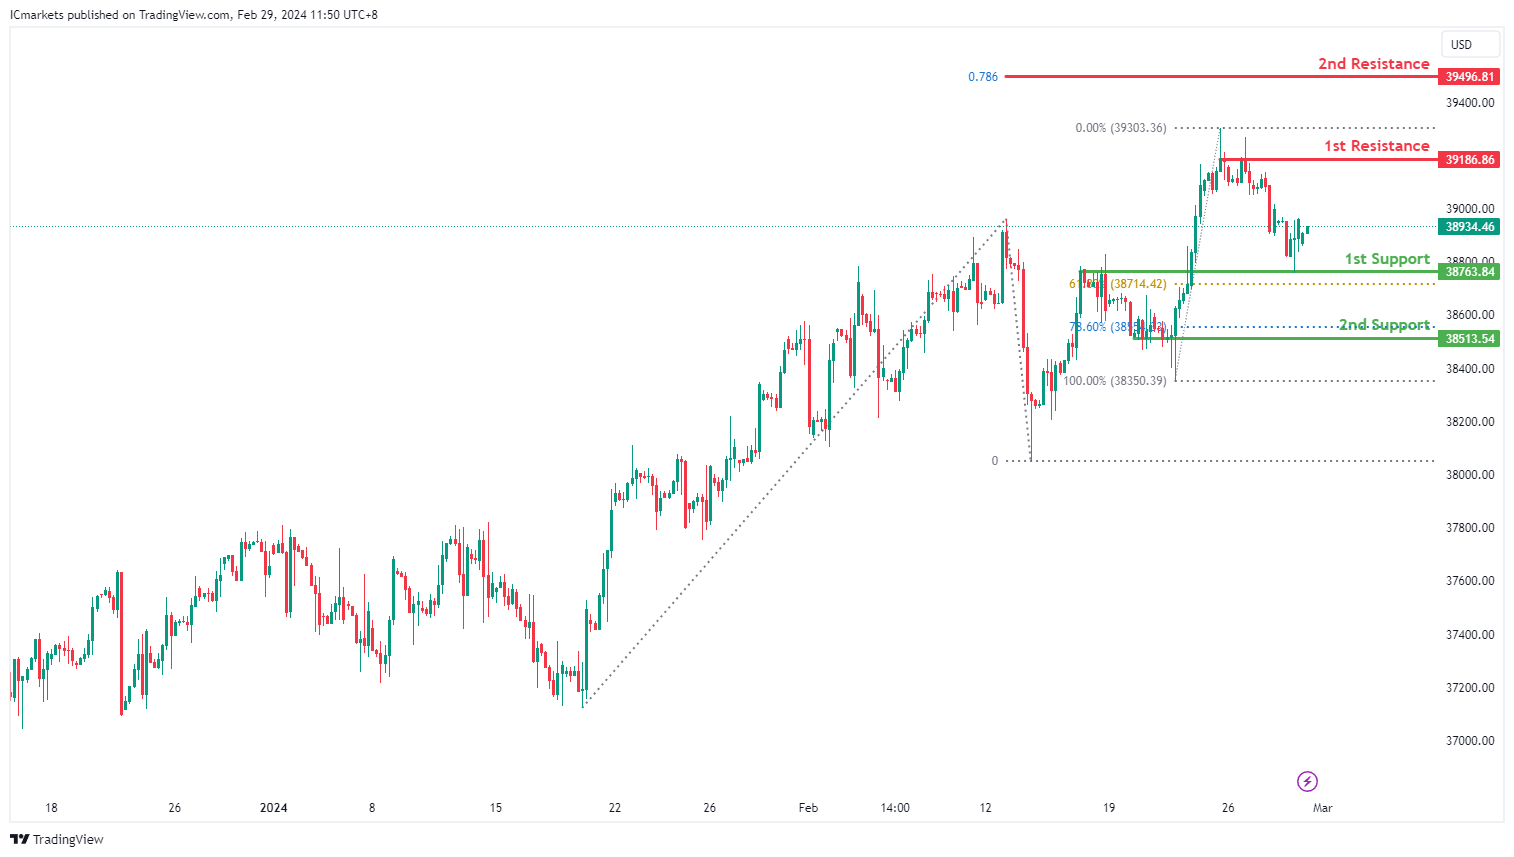
DJ30:
The DJ30 chart currently exhibits an overall bullish momentum. In this context, there is a potential scenario for price to make a bullish continuation towards the 1st resistance.
The 1st resistance level at 39,186.86 is identified as a pullback resistance. Higher up, the 2nd resistance level at 39,496.81 is noted as a resistance that aligns with the 78.60% Fibonacci Projection level, adding to its significance as a potential barrier to further bullish movement.
On the support side, the 1st support level at 38,763.84 is identified as an overlap support that aligns close to the 61.80% Fibonacci Retracement level. Further below, the 2nd support at 38,513.54 is marked as a pullback support that aligns close to the 78.60% Fibonacci Retracement level, further reinforcing its significance as a potential level of support.
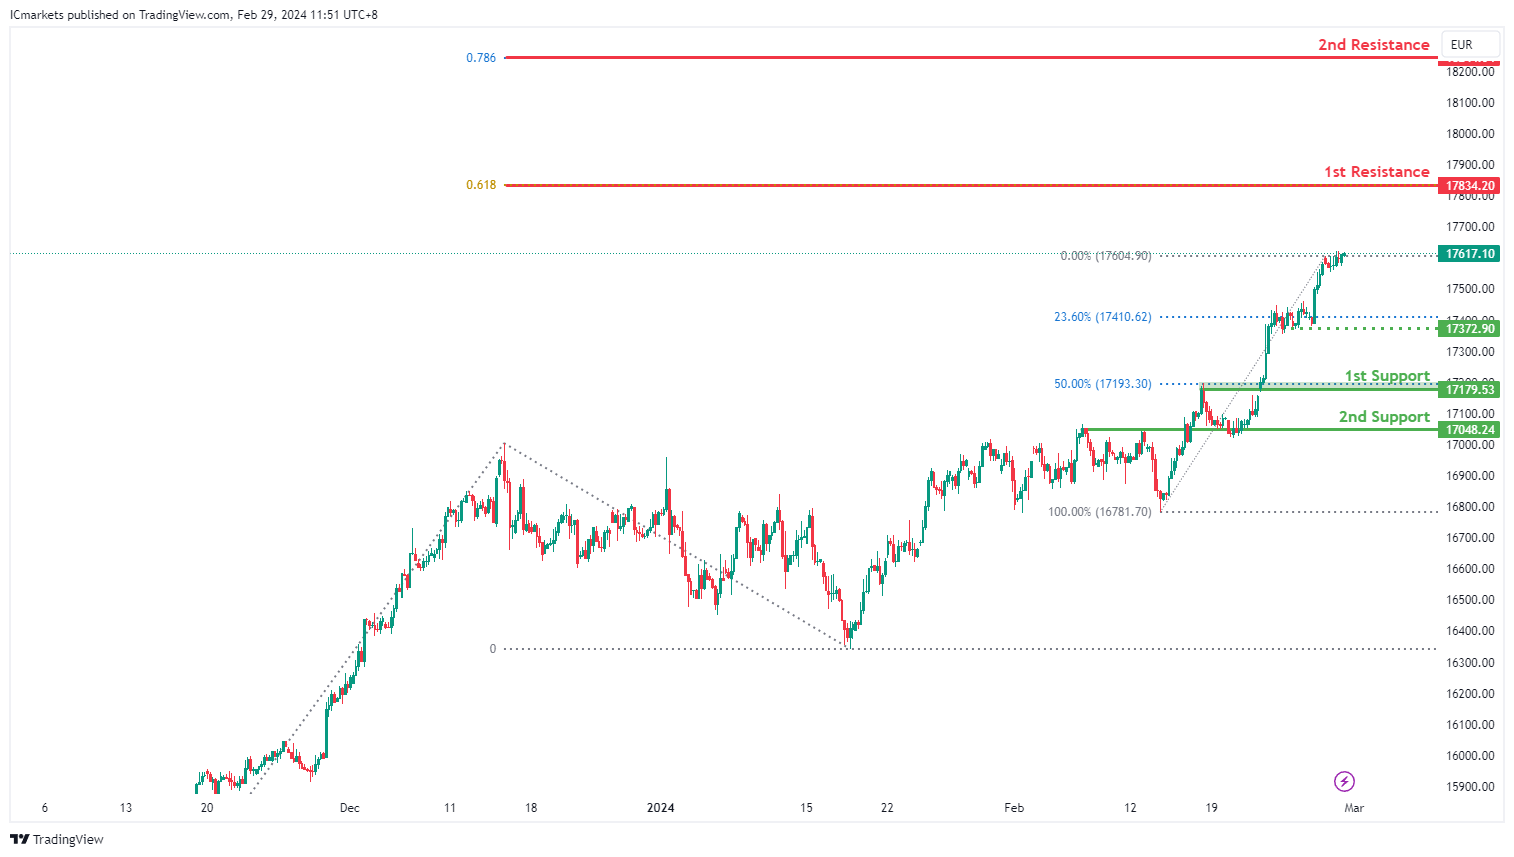
GER40:
The GER40 chart currently demonstrates an overall bullish momentum, suggesting a potential continuation of the upward trend towards the 1st resistance.
The 1st resistance level at 17,834.20 is identified as a resistance that aligns with the 61.80% Fibonacci Projection level. Higher up, the 2nd resistance level at 18,244.54 is marked as a resistance that aligns with the 78.60% Fibonacci Projection level, adding to its significance as a potential barrier to further bullish movement.
On the support side, the intermediate support level at 17,372.90 is identified as a pullback support that aligns with the 23.60% Fibonacci Retracement level while the 1st support level at 17,179.53 is also marked as a pullback support that aligns with the 50.00% Fibonacci Retracement level. Additionally, the 2nd support level at 17,048.24 is noted as an overlap support, further reinforcing its importance as a potential area of support.
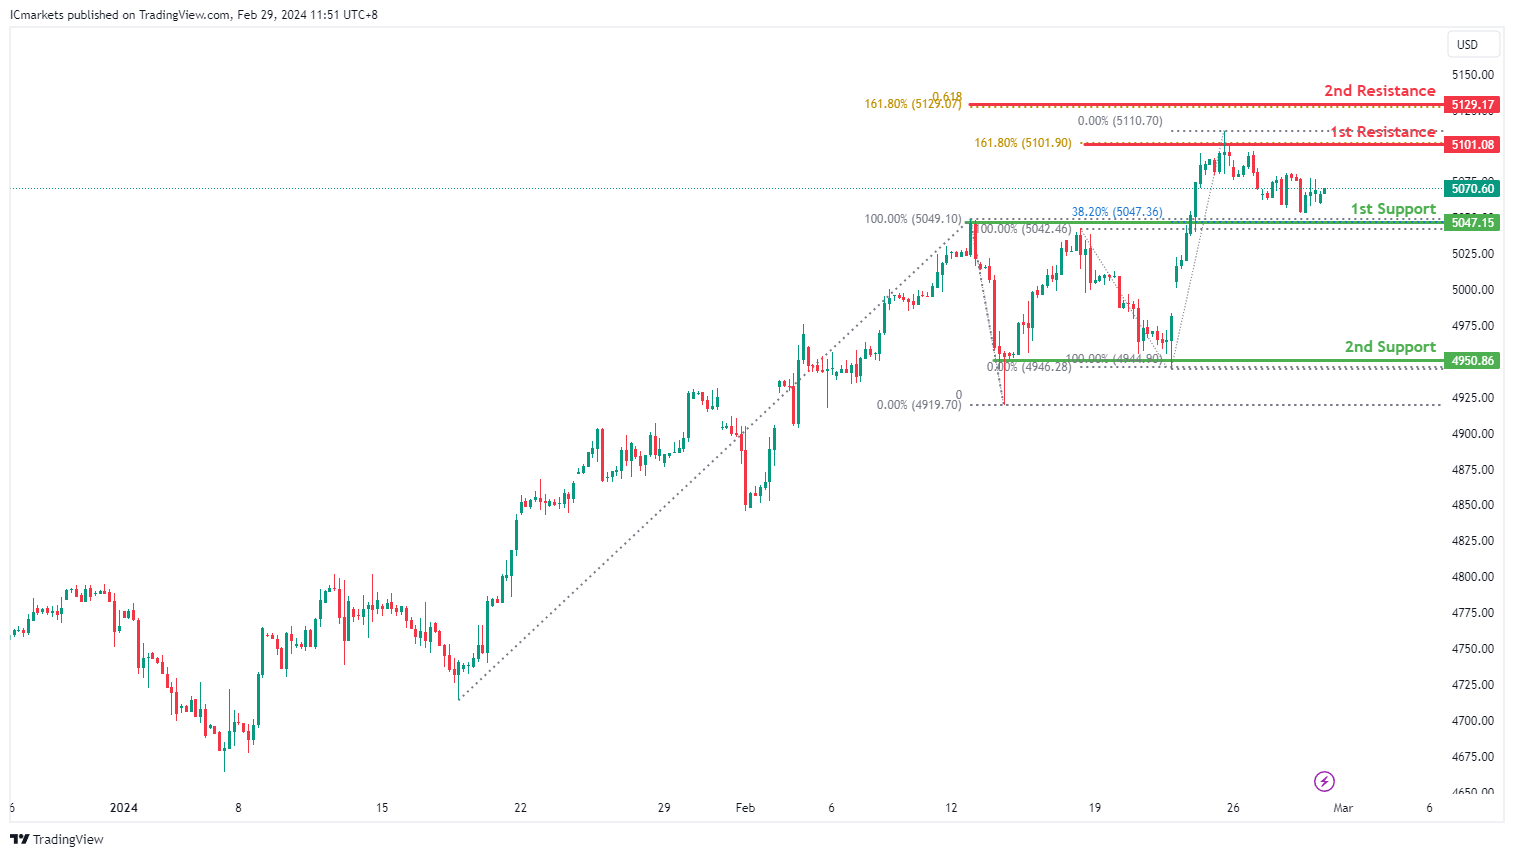
US500:
The US500 chart currently demonstrates an overall bullish momentum, suggesting a potential continuation of the upward trend towards the 1st resistance.
The 1st resistance level at 5,101.08 is identified as a pullback resistance that aligns with the 161.80% Fibonacci Extension level. Higher up, the 2nd resistance level at 5,129.17 is noted as a resistance that aligns with a confluence of Fibonacci levels i.e. the 61.80% Projection and the 161.80% Extension, adding to its significance as a potential barrier to further bullish movement.
On the support side, the 1st support level at 5,047.15 is identified as a pullback support that aligns with the 38.20% Fibonacci Retracement level. Further below, the 2nd support level at 4,950.86 is also marked as a pullback support, further reinforcing its significance as a potential area of support.
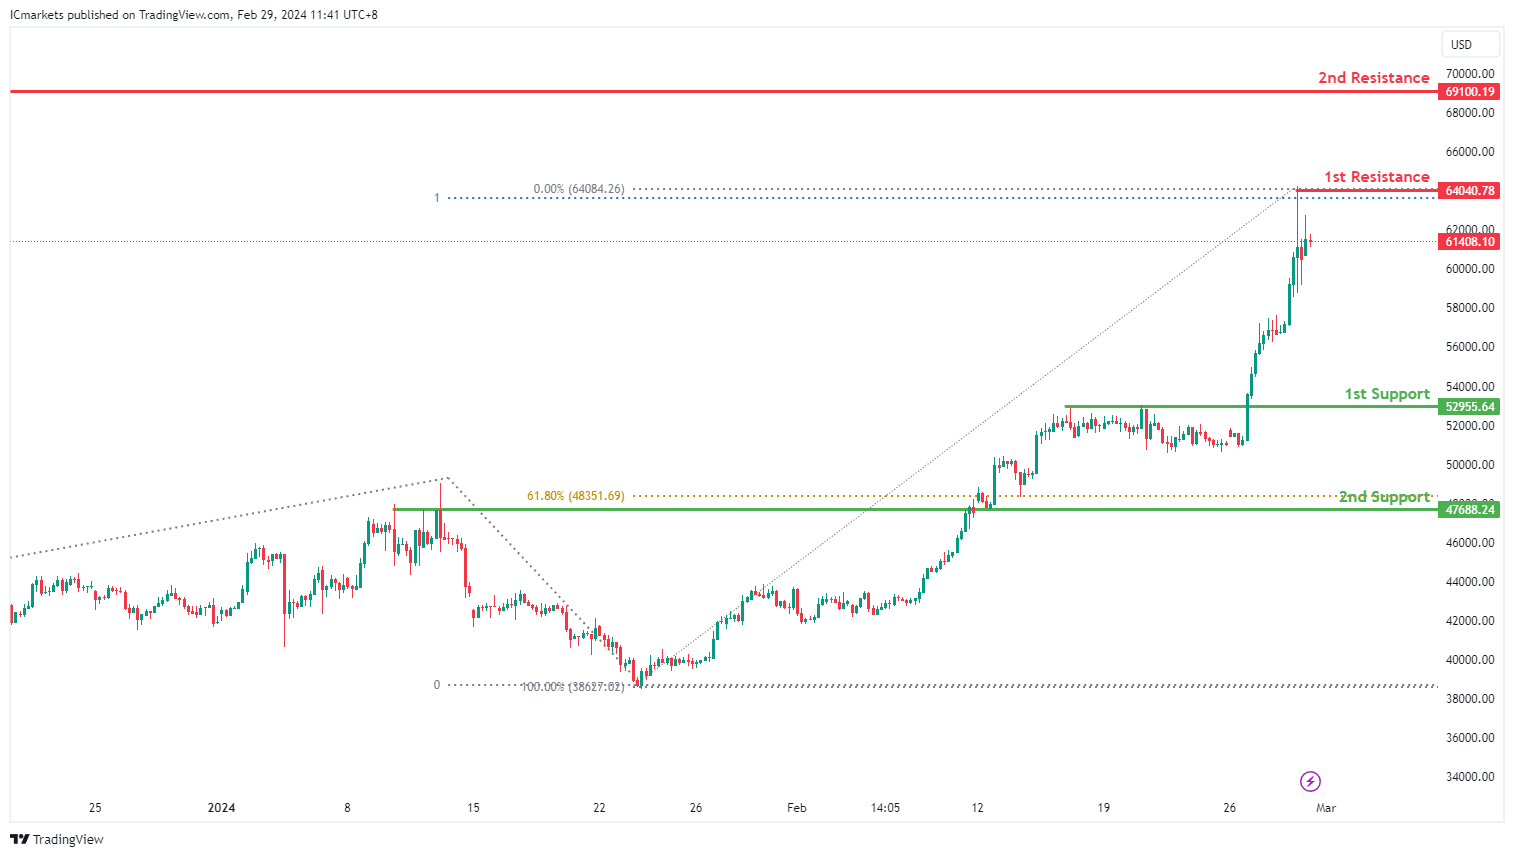
BTC/USD:
The BTC/USD chart currently demonstrates an overall bullish momentum, suggesting a potential continuation of the upward trend towards the 1st resistance.
The 1st resistance level at 64,040.78 is identified as a pullback resistance that aligns with the 100.00% Fibonacci Projection level. Higher up, the 2nd resistance level at 69,100.19 is noted as a swing-high resistance at the all-time high, adding to its significance as a potential barrier to further bullish movement.
On the support side, the 1st support level at 52,955.64 is identified as a pullback support. Further below, the 2nd support level at 47,688.24 is marked as an overlap support that aligns with the 61.80% Fibonacci Retracement level, further reinforcing its significance as a potential area of support.
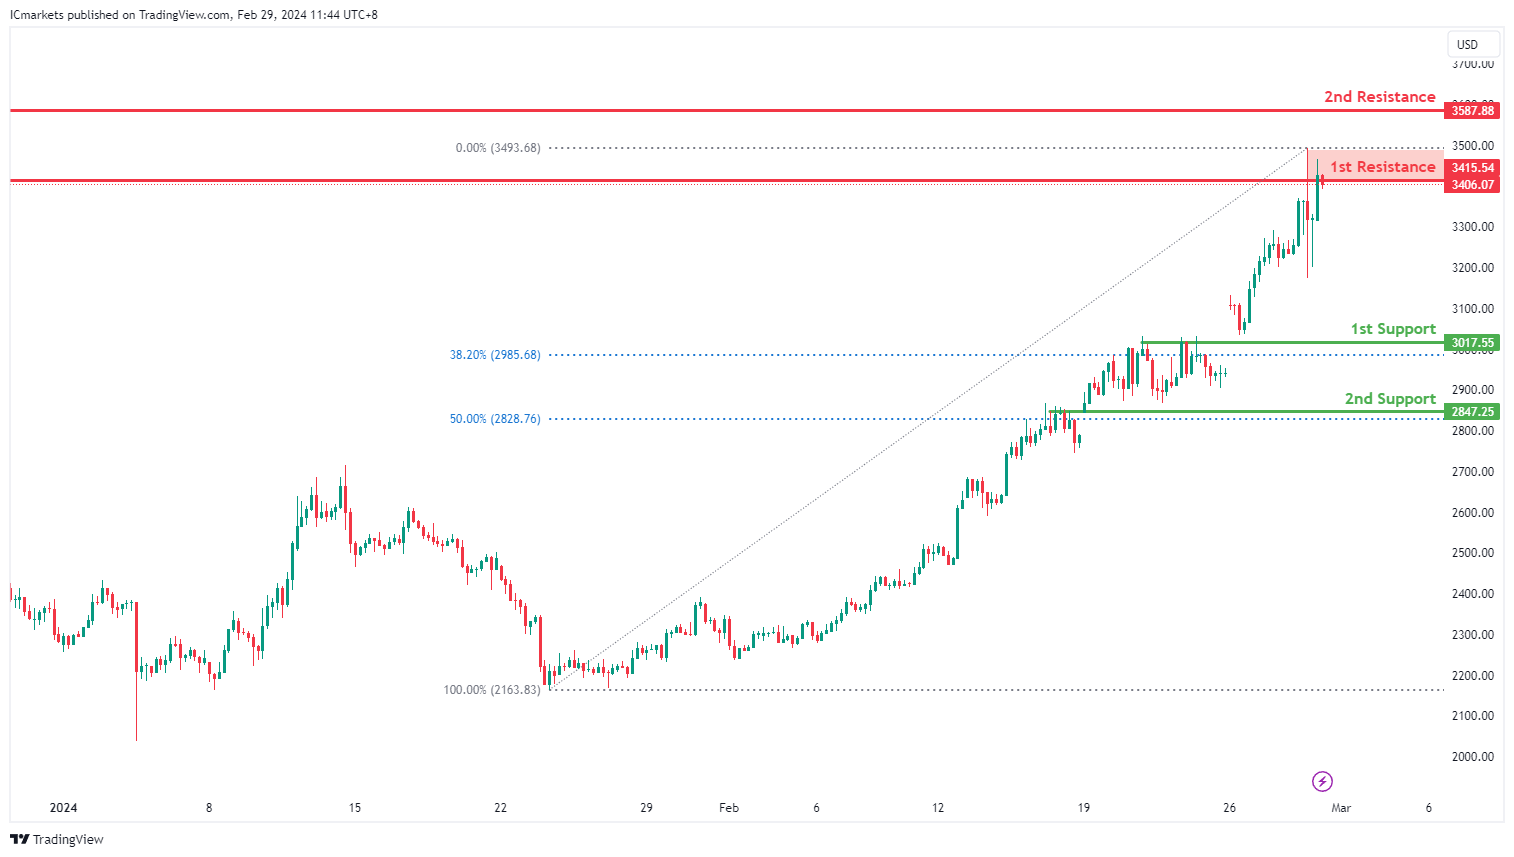
ETH/USD:
The ETH/USD chart currently demonstrates an overall bullish momentum. However, there is a potential scenario for price to make a bearish reaction off the 1st resistance.
The 1st resistance level at 3,415.54 is identified as an overlap resistance. Higher up, the 2nd resistance level at 3,587.88 is also noted as an overlap resistance, adding to its significance as a potential barrier to further bullish movement.
On the support side, the 1st support level at 3,017.55 is identified as an overlap support that aligns with the 38.20% Fibonacci Retracement level. Further below, the 2nd support level at 2,847.25 is also marked as an overlap support that aligns with the 50.00% Fibonacci Retracement level, further reinforcing its significance as a potential area of support.
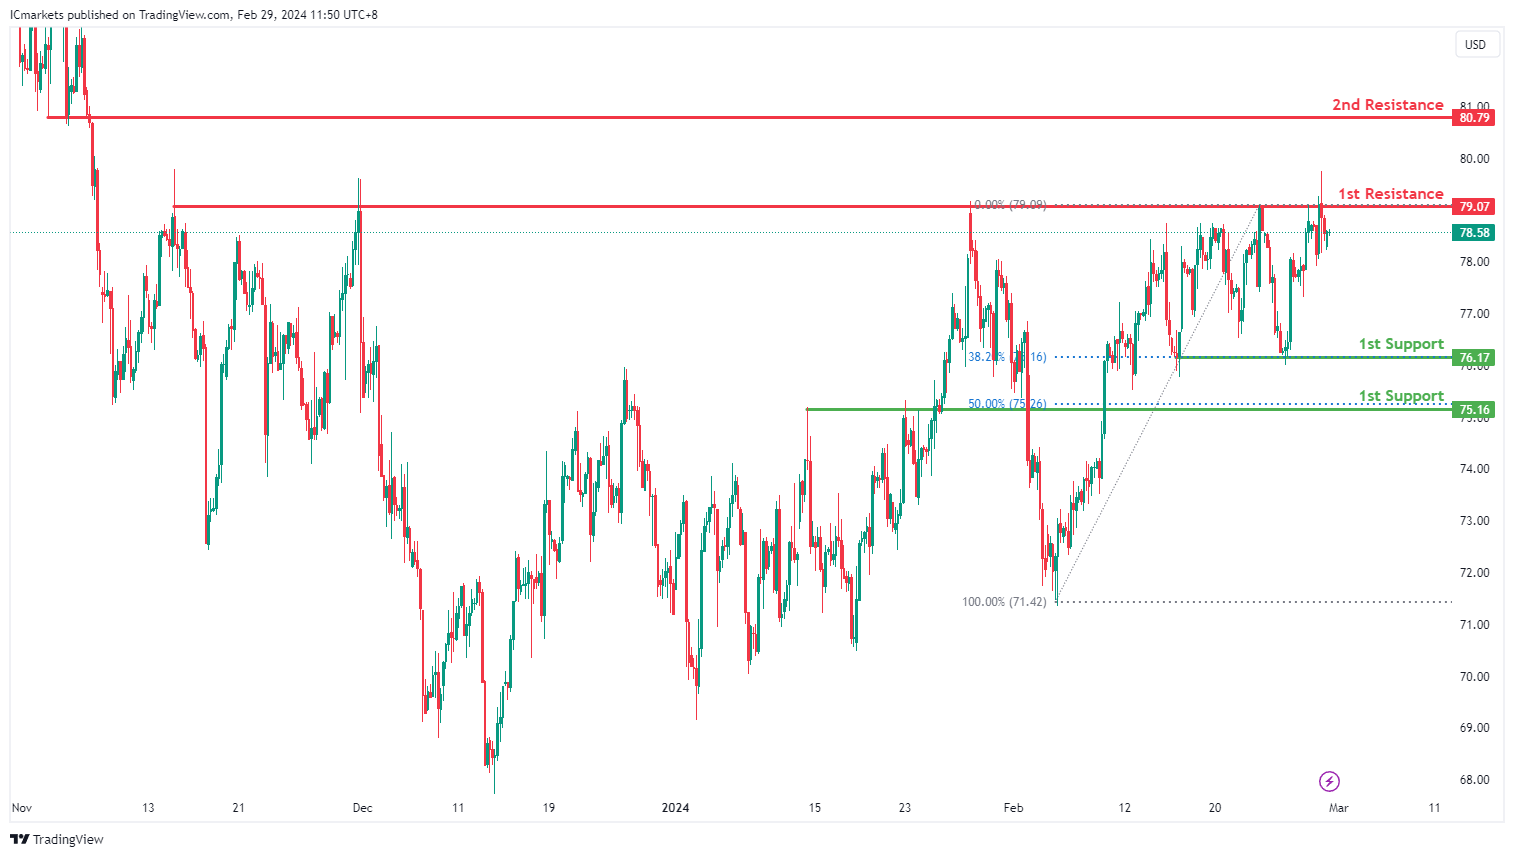
WTI/USD:
The WTI (West Texas Intermediate) chart currently exhibits a neutral bias. In this context, there is a potential scenario for price to fluctuate between the 1st support and the 1st resistance.
The 1st resistance level at 79.07 is identified as a multi-swing-high resistance. Higher up, the 2nd resistance level at 80.79 is marked as a pullback resistance, further highlighting its importance as a potential resistance zone.
To the downside, the 1st support level at 76.17 is identified as a pullback support that aligns with the 38.20% Fibonacci Retracement level. Further below, the 2nd support level at 75.16 is also marked as a pullback support that aligns with the 50.00% Fibonacci Retracement level, reinforcing its significance as a key support level.
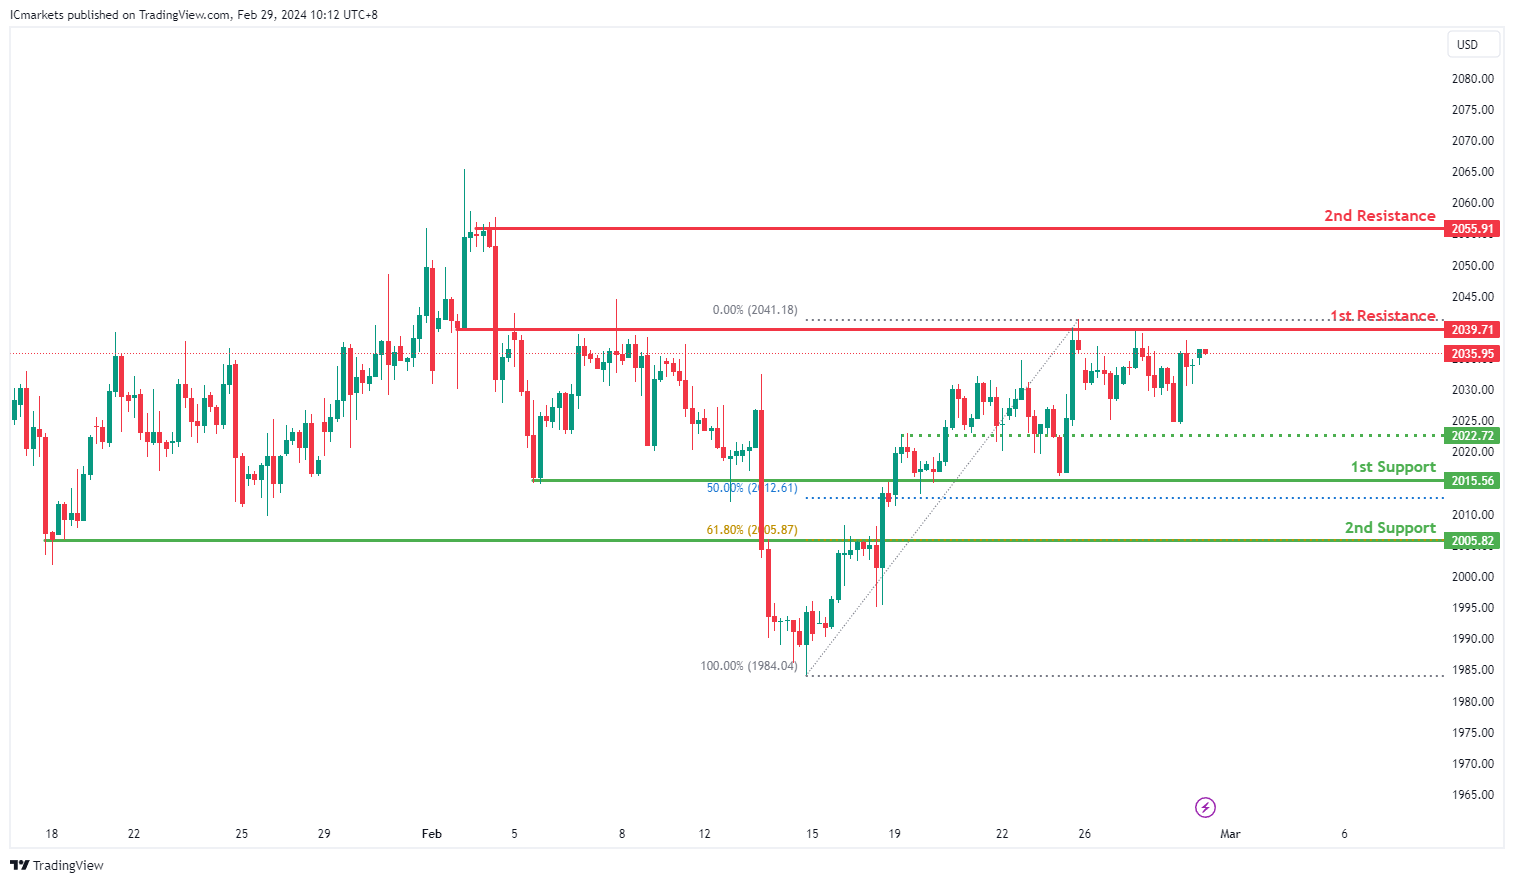
XAU/USD (GOLD):
The XAUUSD chart currently demonstrates neutral momentum, indicating a potential fluctuation between the 1st resistance and 1st support levels.
The 1st support at 2015.56 is significant due to its alignment with an overlap support and the 50% Fibonacci Retracement level, suggesting historical buying interest and potential support for the price.
Further reinforcing potential support, the 2nd support at 2005.82 coincides with an overlap support and the 61.80% Fibonacci Retracement level, adding to its significance as a level where buyers may intervene to support the price.
On the resistance side, the 1st resistance at 2039.71 represents an overlap resistance, historically acting as a barrier to upward movement.
Additionally, the 2nd resistance at 2055.91 denotes a multi-swing high resistance, indicating another significant level where selling interest may intensify, potentially limiting further upward momentum.
The intermediate support at 2022.72 further supports potential price stability, aligning with a pullback support level, where buying interest may reemerge to support the price
The accuracy, completeness and timeliness of the information contained on this site cannot be guaranteed. IC Markets does not warranty, guarantee or make any representations, or assume any liability regarding financial results based on the use of the information in the site.
News, views, opinions, recommendations and other information obtained from sources outside of www.icmarkets.com.au, used in this site are believed to be reliable, but we cannot guarantee their accuracy or completeness. All such information is subject to change at any time without notice. IC Markets assumes no responsibility for the content of any linked site.
The fact that such links may exist does not indicate approval or endorsement of any material contained on any linked site. IC Markets is not liable for any harm caused by the transmission, through accessing the services or information on this site, of a computer virus, or other computer code or programming device that might be used to access, delete, damage, disable, disrupt or otherwise impede in any manner, the operation of the site or of any user’s software, hardware, data or property.


