
EUR/USD:
The single currency sustained its downside presence Wednesday, weighed on by a swelling dollar and ECB’s Draghi’s dovish remarks, hinting a rate hike could be further delayed if necessary.
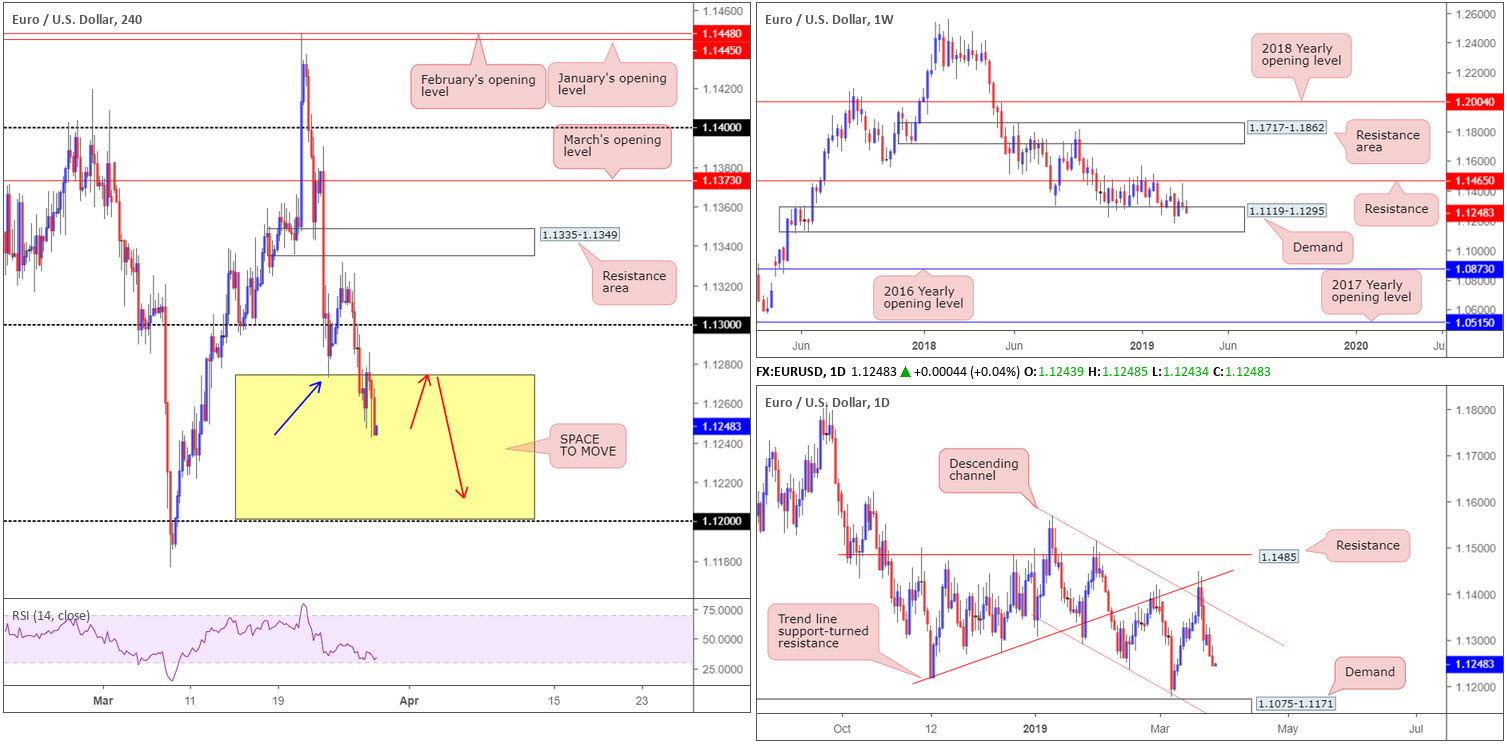
As highlighted in previous technical briefings, the research team underlined the possibility of further selling taking shape on the H4 timeframe, targeting the 1.12 handle. Ultimately, though, a retest of 1.13 as resistance –a noted move to watch for posted in Wednesday’s briefing – would have made for a beautiful short.
The picture on the higher timeframes has the pair tunnelling deeper into weekly demand priced in at 1.1119-1.1295. Overall, the long-term trend on the weekly timeframe continues to face a southerly direction. The next area of interest beyond the current demand falls in around the 2016 yearly opening level priced in at 1.0873. The story on the daily timeframe shows price action gearing up to challenge demand coming in at 1.1075-1.1171, after fading (albeit following a minor fakeout north) the upper limit of a descending channel (high: 1.1569 low: 1.1289) last week.
Areas of consideration:
Despite both H4 and daily timeframes eyeing lower levels, weekly demand mentioned above at 1.1119-1.1295 remains a point of worry. Additional concern is the RSI indicator approaching its oversold value on the H4 timeframe.
Traders who feel lower prices are still on the cards unfortunately have little in terms of resistance to base a sell from on the H4 timeframe. Granted, Friday’s low 1.1273 (blue arrow – red arrows) may offer resistance again and potentially draw a sell from here (preferably based on a confirming candlestick signal as it helps not only identify seller intent, it also helps define entry and risk levels), targeting 1.12, followed by the top edge of daily demand at 1.1171.
Today’s data points: German Prelim CPI m/m; FOMC Member Quarles, Clarida, Bowman and Bullard Speak; US Final GDP q/q.
GBP/USD:
Outlook unchanged.
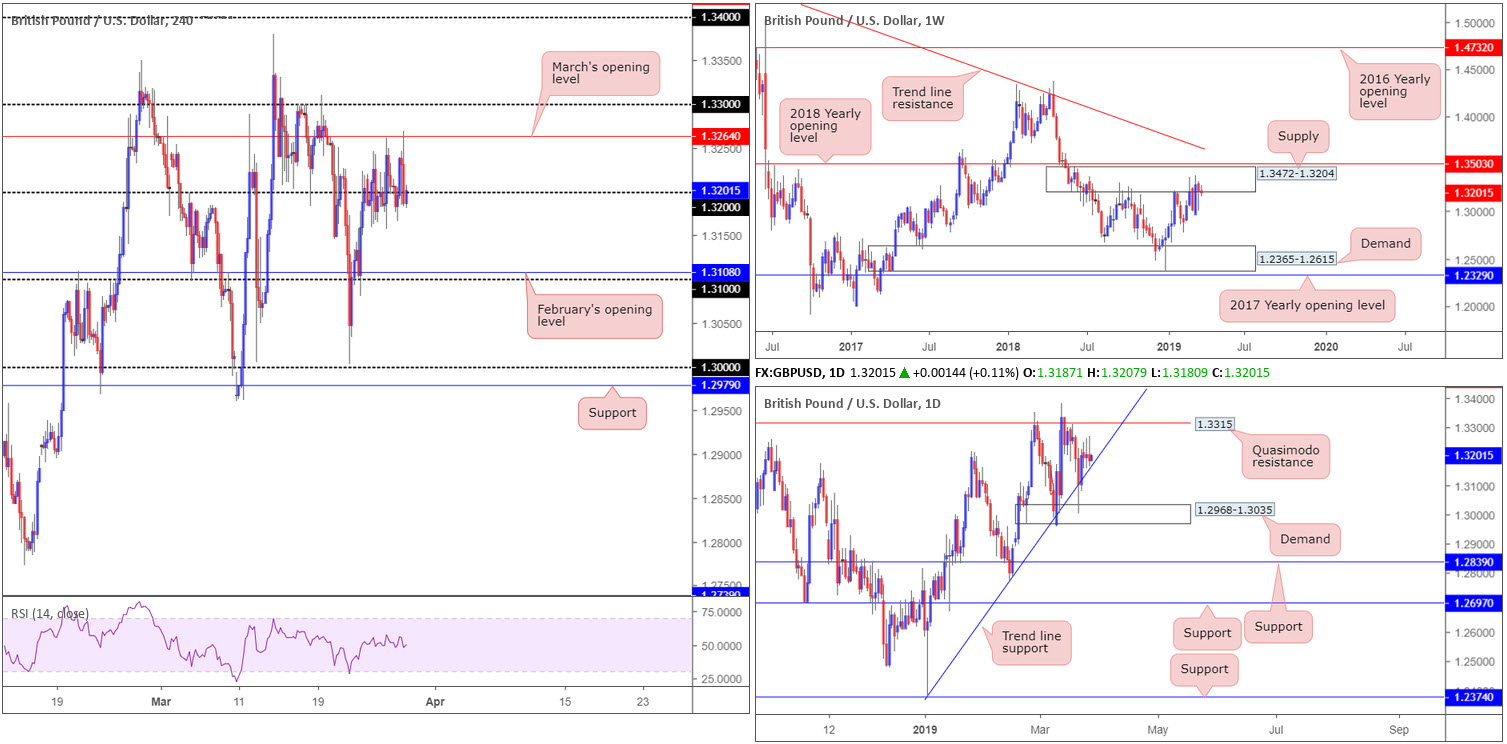
Another pretty much sideways day for the British pound and its US counterpart, mildly down on the day by 0.15%. Upside attempts remain capped by March’s opening level at 1.3264 on the H4 timeframe, while intraday support is found south of the 1.32 psychological mark around 1.3168ish. A firm push beneath 1.32 could lead to an approach towards February’s opening level at 1.3108/the round number 1.31.
Decorating the weekly chart is supply drawn from 1.3472-1.3204. Since the end of February this has been home to many traders as price continues to flip between gains/losses. In view of the number of times this area has been tested since July 2018, the supply’s foundation is likely weakened, giving rise to a possible advance towards the 2018 yearly opening level at 1.3503.
The stop run through trend line support (extended from the low 1.2373) on the daily timeframe into nearby demand plotted at 1.2968-1.3035 last week provoked a round of buying Friday. Despite this, Monday, Tuesday and Wednesday’s sessions failed to print anything meaningful to the upside. In fact, three back-to-back indecision candles are visible.
Areas of consideration:
With weekly players potentially sending price action lower from supply; daily flow lingering a few points ahead of trend line support and H4 action currently chalking up an indecisive tone around 1.32 continues to offer a mixed outlook. For that reason, the research team’s stance remains flat. Irrespective of the direction traders select, opposing structure is nearby.
Today’s data points: FOMC Member Quarles, Clarida, Bowman and Bullard Speak; US Final GDP q/q.
AUD/USD:
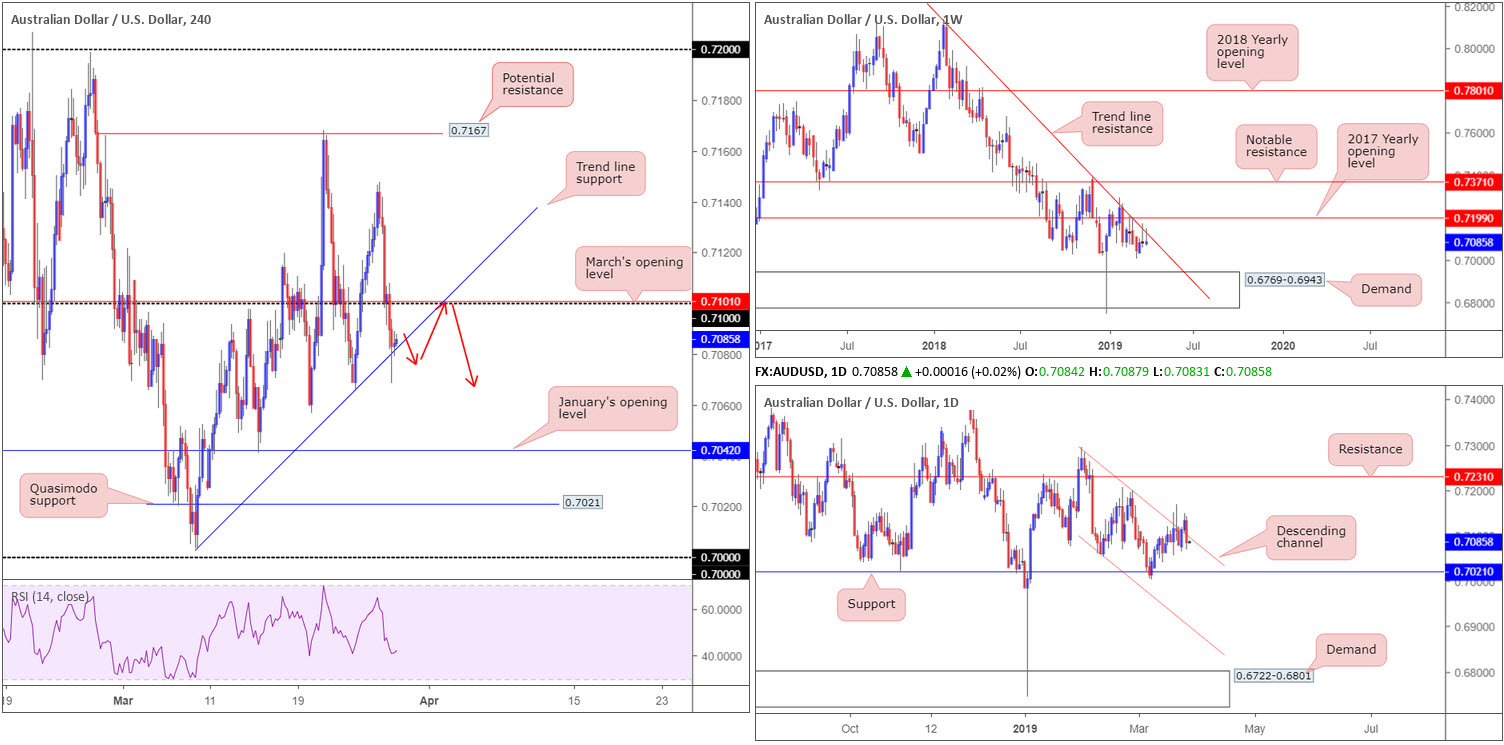
In early trade Wednesday, the NZD suffered a substantial loss after the RBNZ advised its next rate move could be a rate cut. This filtered through to the Australian dollar, sporting a 0.24% decline over the span of thirty minutes against its US peer. Further selling materialised going into London and US sessions as the greenback pencilled in its second consecutive daily gain, consequently swallowing the 0.71 handle on the H4 timeframe and testing nearby trend line support (extended from the low 0.7003) into the close.
Increasing our vision to weekly structure reveals the unit is testing the underside of a long-standing trend line resistance (etched from the high 0.8135), currently trading in the shape of a bearish pin-bar formation. The market could observe additional selling take shape from here as downside appears reasonably free until connecting with demand at 0.6769-0.6943.
In conjunction with weekly flow, the daily timeframe crossed back into a descending channel pattern yesterday (high: 0.7295 low: 0.7060). On the assumption sellers remain in the driving seat, the next downside target in sight is support coming in at 0.7021.
Areas of consideration:
In light of recent moves on the higher timeframes, a break beneath the current H4 trend line support may be in store today, potentially setting the stage for a push towards January’s opening level at 0.7042, shadowed by Quasimodo support at 0.7021. Before this occurs, however, a retest to the underside of 0.71 is also likely on the cards.
An ideal scenario, technically speaking, is a break of the aforementioned trend line support (H4), followed by a retest at 0.71. A retest by way of a H4 bearish candlestick signal (this is just one form of a confirmation technique) would likely be enough to encourage strong selling, targeting the above said H4 supports in bold.
Today’s data points: FOMC Member Quarles, Clarida, Bowman and Bullard Speak; US Final GDP q/q.
USD/JPY:
Outlook unchanged.
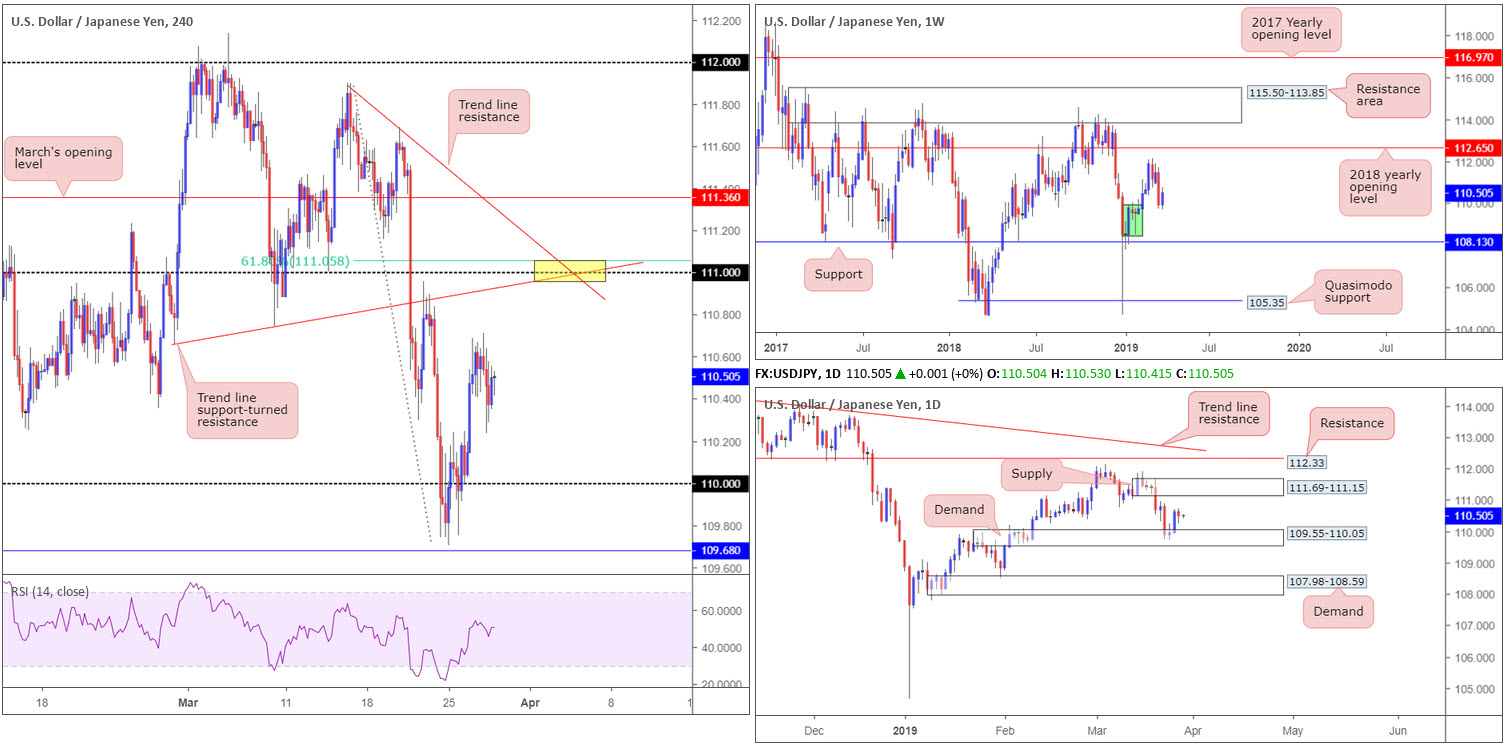
Having observed US equities pencil in an indecisive close Wednesday, the 10-year US Treasury yield erasing 2.00% and the US dollar index (although higher on the day) finding resistance nearby 97.00, USD/JPY action was somewhat subdued.
With H4 flow kissing the mid-way point between 110 and 111, the research team favours the 111 handle as strong resistance. This psychological number, marked yellow, also boasts a merging trend line support-turned resistance (drawn from the low 110.66), another trend line resistance (from the high 111.90) and a 61.8% Fibonacci resistance at 111.05. What’s also notable from 111 is the lower edge of daily supply seen above at 111.69-111.15.
Areas of consideration:
Keeping it simple this morning, the 111 handle is, according to our markings, a high probability sell zone with a healthy dose of H4 confluence and also the lower base of daily supply supporting the level at 111.15.
Entry at 111.00 and stop-loss order set at 20 points is an option, though some traders may prefer waiting for additional confirmation which will likely offer different entry and exit parameters. Ultimately, the research team feels the last demand formed on approach to 111 should be considered as a first port of call in terms of taking profit and reducing risk to breakeven.
Today’s data points: FOMC Member Quarles, Clarida, Bowman and Bullard Speak; US Final GDP q/q.
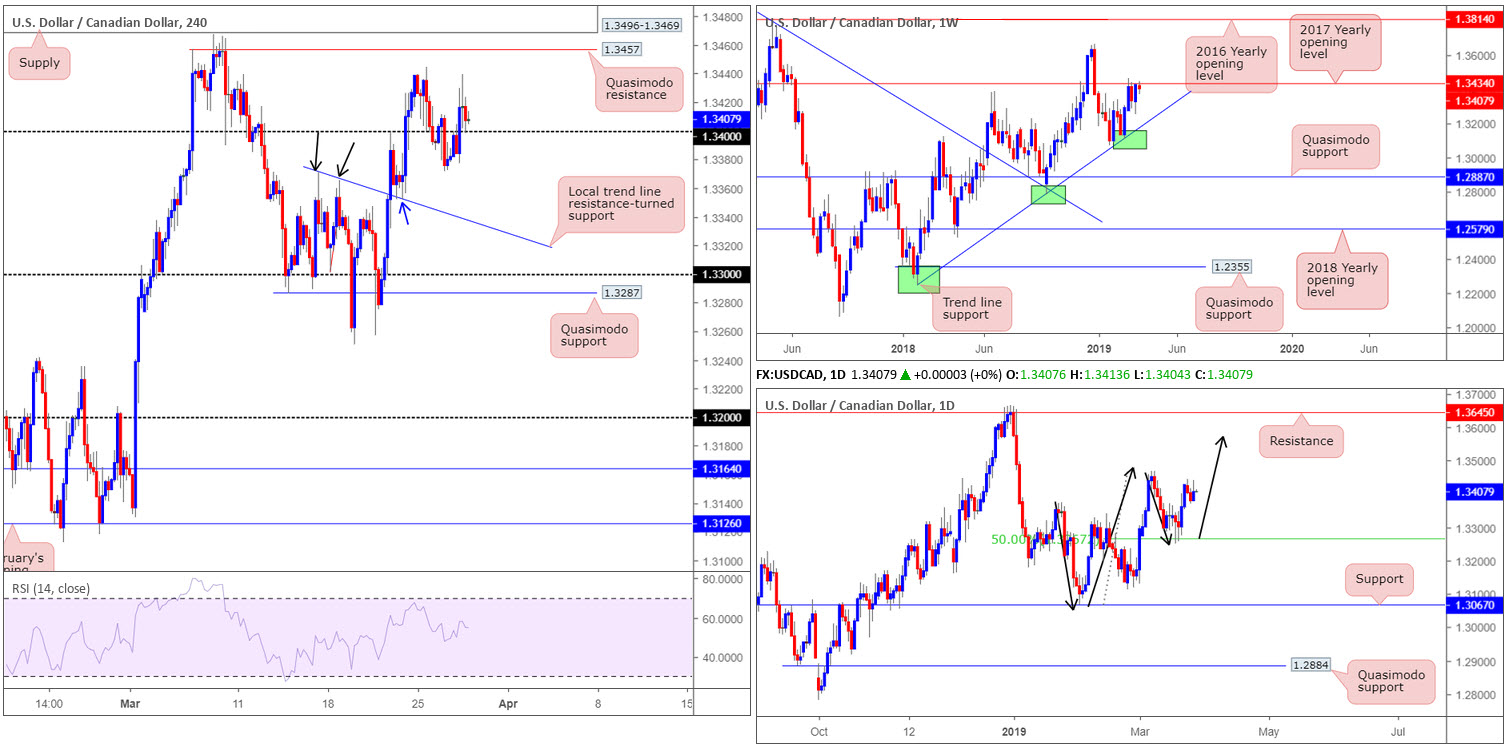
USD/CAD:
USD/CAD bulls re-entered the fray Wednesday, consequently violating a two-day bearish phase. Up 0.20% on the day, the H4 candlesticks reclaimed 1.34+ status, strengthened by a robust US dollar across the board and WTI pressing lower following EIA’s crude oil levels. Aside from Monday’s high 1.3444, further buying above 1.34 has Quasimodo resistance on the radar at 1.3457, shadowed closely by supply positioned at 1.3496-1.3469.
The odds of price pushing lower are strong, however, according to the weekly timeframe’s structure. In recent weeks, the USD/CAD has been engaging with notable resistance at 1.3434 (the 2017 yearly opening level) following an notable rally from trend line support (taken from the low 1.2247).
On the other side of the spectrum, daily action indicates it may be poised to approach higher ground this week. The higher high sported on March 7th at 1.3467 followed by a 50.0% retracement to 1.3265 which held firm, places the buyers in good stead to overthrow the said high and possibly discover higher levels.
Areas of consideration:
Many traders are likely eyeing longs at the retest of 1.34 heading into the Asia Pac session, given it appears to be holding. Facing weekly resistance at 1.3434, though, despite potential out of the daily timeframe to climb higher, is a concern.
Through the lens of a simple technical trader, 1.34 is unlikely to offer anything substantial in terms of upside. In the event our analysis is correct and price reclaims 1.34 to the downside, a retest to the underside of this barrier (preferably in the shape of a H4 bearish candlestick signal as this provides entry/risk levels to work with) opens up a possible intraday sell towards the local trend line resistance-turned support (taken from the high 1.3371) as an initial first take-profit target.
Today’s data points: FOMC Member Quarles, Clarida, Bowman and Bullard Speak; US Final GDP q/q.
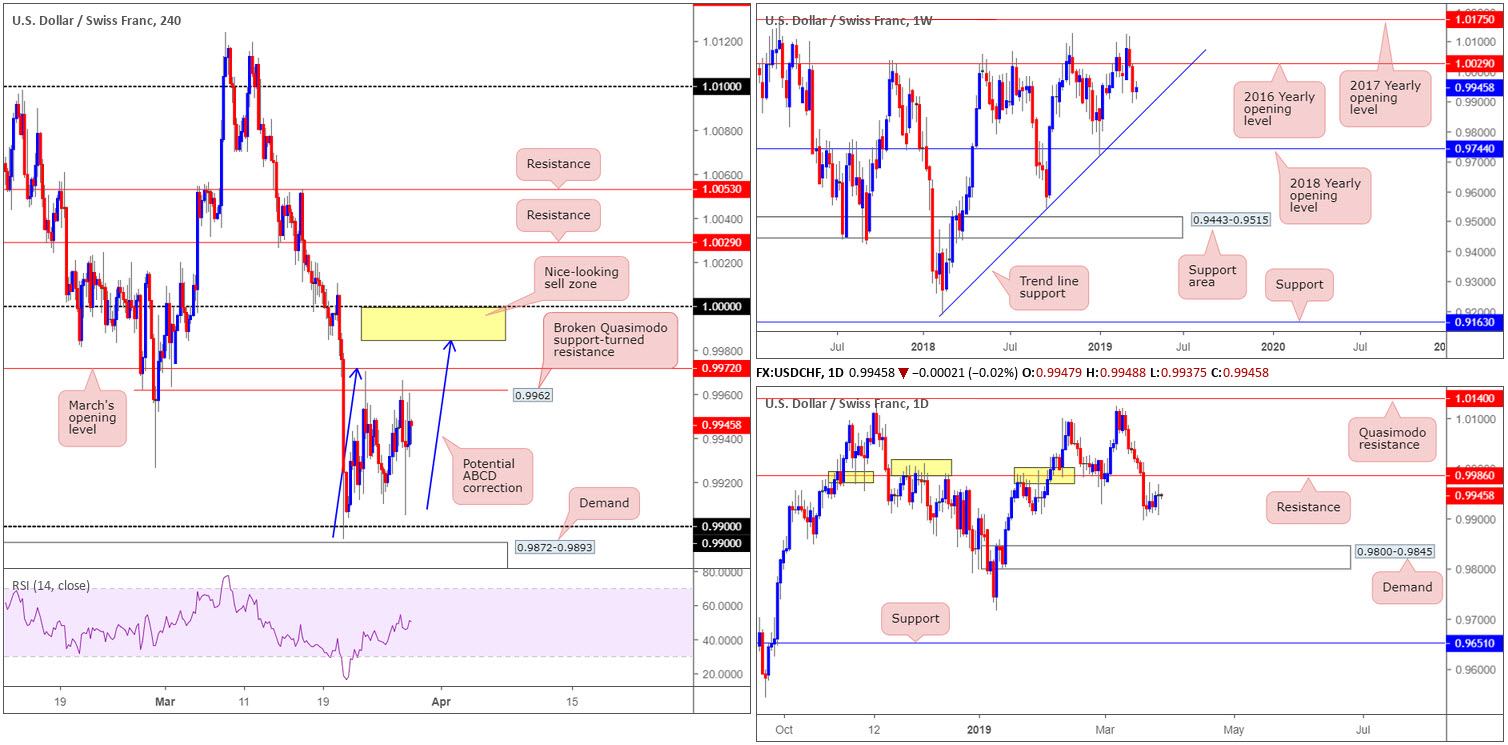
USD/CHF:
Outlook unchanged.
A modest pickup in USD demand Wednesday prompted a mildly positive USD/CHF close, extending Tuesday’s gains.
Overhead on the H4 timeframe this morning, we have a nearby resistance (broken Quasimodo support-turned resistance) at 0.9962, tracked closely by March’s opening level at 0.9972. In terms of support, round number support at 0.99 is in sight, as is nearby demand plotted at 0.9872-0.9893. It might also interest some traders to note a potential bearish ABCD (blue arrows) correction pattern that tops around 0.9985 is also visible.
In terms of where the market stands on the weekly timeframe this morning, price action remains poised to approach trend line support (taken from the low 0.9187) after having seen the unit push lower from the 2016 yearly opening level at 1.0029. Daily flow, aside from the 0.9905 Jan 28 low that’s holding as temporary support, also demonstrates potential to charge as far south as demand plotted at 0.9800-0.9845. Another possibility, of course, is a retest of nearby resistance coming in at 0.9986.
Areas of consideration:
The daily resistance mentioned above at 0.9986 is of interest as a possible sell zone. Traders may also like the fact it merges, assuming H4 price continues to push higher, with an ABCD bearish pattern mentioned above at 0.9985. Between 1.0000 (parity) and 0.9985 (yellow), therefore, is a reasonably solid sell zone to have on the watchlist. As round numbers are prone to fakeouts, though, entering on additional confirmation is a point worth considering – entry and risk levels can be determined according to your chosen confirmation method.
Today’s data points: FOMC Member Quarles, Clarida, Bowman and Bullard Speak; US Final GDP q/q; CHF Gov. Board Member Maechler Speaks.
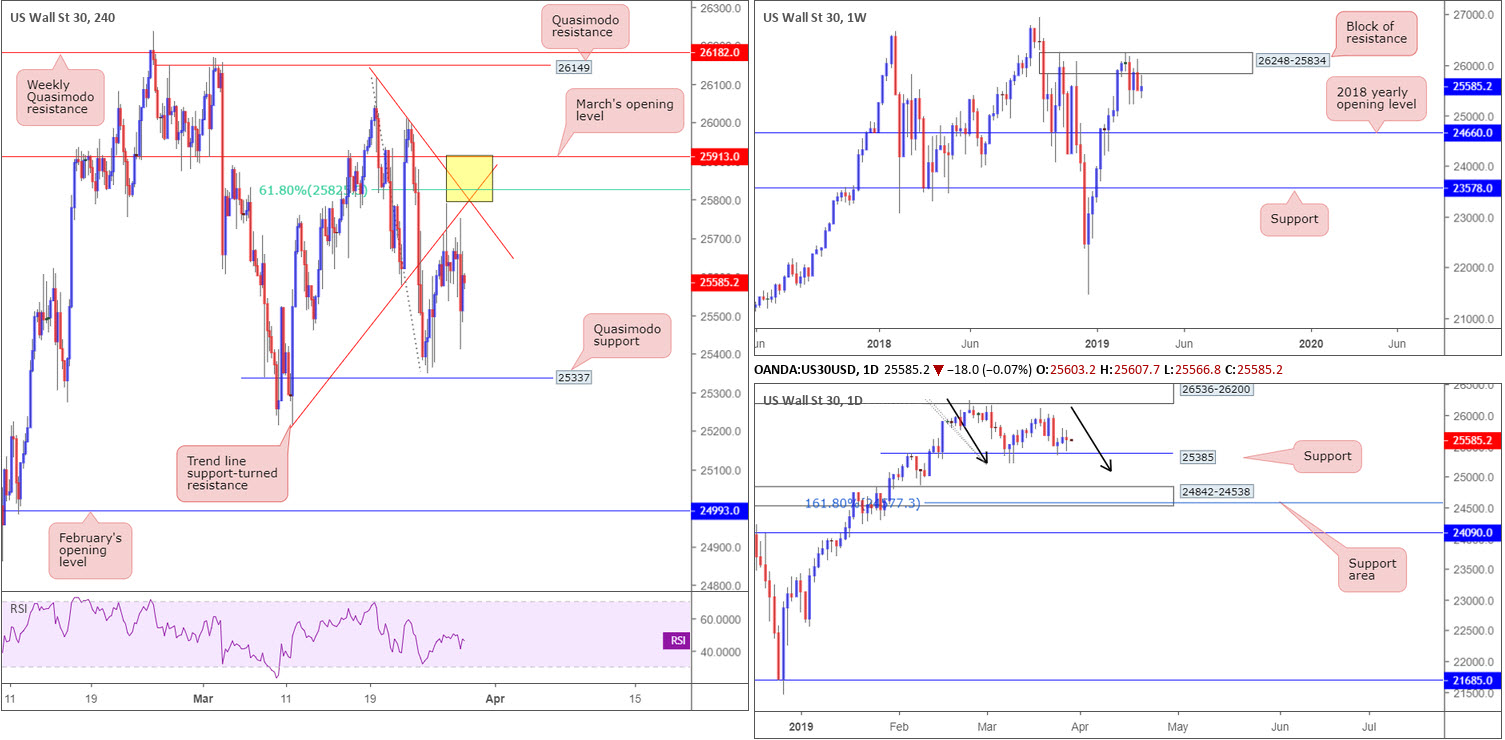
Dow Jones Industrial Average:
US equities concluded broadly lower on Wall Street Wednesday amid softness in health care, technology companies and banking.
Looking at technical structure on the weekly timeframe for the Dow Jones Industrial Average, since early February traders have called a block of resistance at 26248-25834 home. Last week’s response from this barrier was of notable strength, closing not too far off its lows, though this has yet to generate much follow through so far this week. Further downside from this point could eventually see the index knocking on the door of its 2018 yearly opening level at 24660.
Support at 25385 on the daily timeframe elbowed its way into the fight Monday and extended gains Tuesday. Wednesday saw the unit mildly pullback from session highs at 25749 and form an indecision candle. A push beneath 25385 will likely bring in a possible daily ABCD bullish motion (black arrows) terminating around 25112. Traders may also want to acknowledge a nearby daily support area seen at 24842-24538 which holds within it a 161.8% Fibonacci extension at 24577 (an addition to the aforesaid ABCD formation).
Despite mixed vibes out of the bigger picture, a nice-looking area of confluence (yellow) on the H4 timeframe is seen between 25913/25800 (comprised of a trend line support-turned resistance [taken from the low 25215], a trend line resistance [drawn from the high 26114], a 61.8% Fibonacci resistance at 25828 and March’s opening level at 25913). In addition to this, traders may also want to acknowledge within this area stands the lower edge of weekly resistance mentioned above at 25834.
Areas of consideration:
Entering short from within the yellow zone marked on the H4 timeframe at 25913/25800 is an option today should it be tested. Conservative traders will likely look for signs of seller intent before pulling the trigger – maybe a H4 bearish candlestick pattern, or even drilling down to the lower timeframes and trading local structure. Traders who feel the structure offered on the H4 timeframe, along with the lower edge of weekly resistance at 25834, is sufficient may simply short at 25828ish and position stop-loss orders a few points beyond March’s opening level at 25913.
Today’s data points: FOMC Member Quarles, Clarida, Bowman and Bullard Speak; US Final GDP q/q.
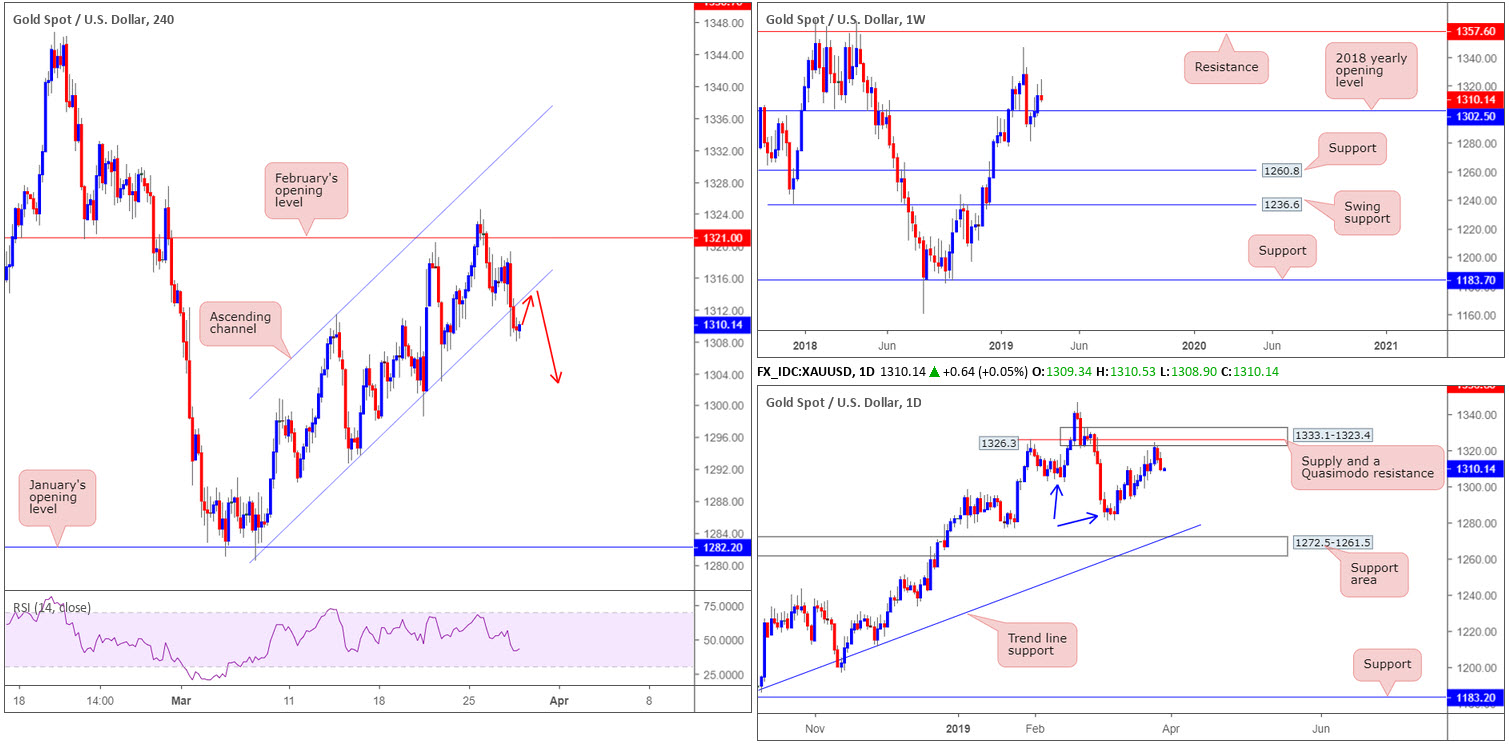
XAU/USD (GOLD):
Spot gold ceded further ground to its US counterpart Wednesday, down 0.45%. Despite clocking a session high at $1319.3, the yellow metal failed to preserve its upside presence, forcing the H4 below its channel support (taken from the low $1280.4).
The break of the current H4 channel support (now likely to offer resistance) has an initial downside target set at $1302.5: the 2018 yearly opening level on the weekly timeframe. Yesterday’s move lower, as you’ll see from the daily timeframe, was bolstered by supply coming in at $1333.1-$1323.4. Note on the daily timeframe, limited support is in view until reaching $1281.0 March 7 low, followed by a support area at $1272.5-$1261.5 and merging trend line support (extended from the low $1160.3).
Areas of consideration:
Ultimately, a retest to the underside of the broken channel support on the H4 as resistance is favoured, targeting the 2018 yearly opening level underlined above on the weekly timeframe at $1302.5. An added bonus would be H4 price chalking up a candlestick signal at the retest, consequently identifying seller intent and also serving as a base to determine entry and risk levels.
The accuracy, completeness and timeliness of the information contained on this site cannot be guaranteed. IC Markets does not warranty, guarantee or make any representations, or assume any liability with regard to financial results based on the use of the information in the site.
News, views, opinions, recommendations and other information obtained from sources outside of www.icmarkets.com.au, used in this site are believed to be reliable, but we cannot guarantee their accuracy or completeness. All such information is subject to change at any time without notice. IC Markets assumes no responsibility for the content of any linked site. The fact that such links may exist does not indicate approval or endorsement of any material contained on any linked site.
IC Markets is not liable for any harm caused by the transmission, through accessing the services or information on this site, of a computer virus, or other computer code or programming device that might be used to access, delete, damage, disable, disrupt or otherwise impede in any manner, the operation of the site or of any user’s software, hardware, data or property.


