
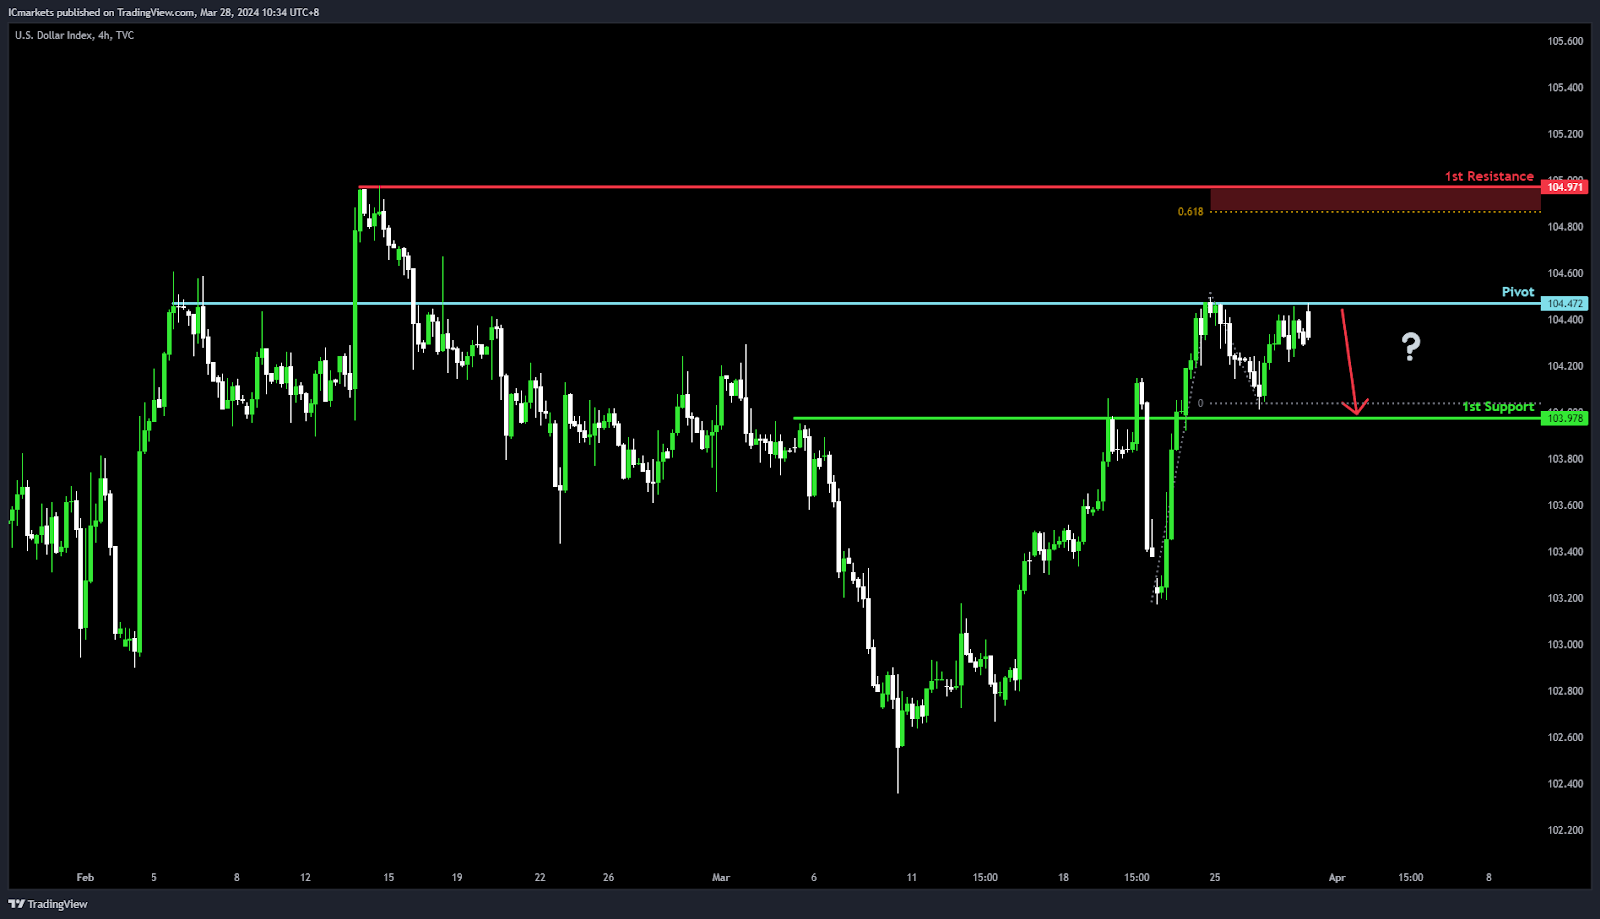
DXY:
Potential Direction: Bearish
Overall momentum of the chart: Bullish
Price could potentially make a bearish reaction off pivot and drop to 1st support
Pivot: 104.72
Supporting reasons: Acts as an Overlap resistance, indicating a key level where selling pressure might intensify, suggesting a pivotal spot for potential downturns in price movement.
1st support: 103.97
Supporting reasons: Known as an Overlap support, a strong area that could halt further declines, indicating its significance as a foundation for potential price stabilization or a rebound.
1st resistance: 104.97
Supporting reasons: Characterized by Multi-swing high resistance, a major barrier that has previously capped upward movements, highlighting its importance as a critical threshold for the price action.
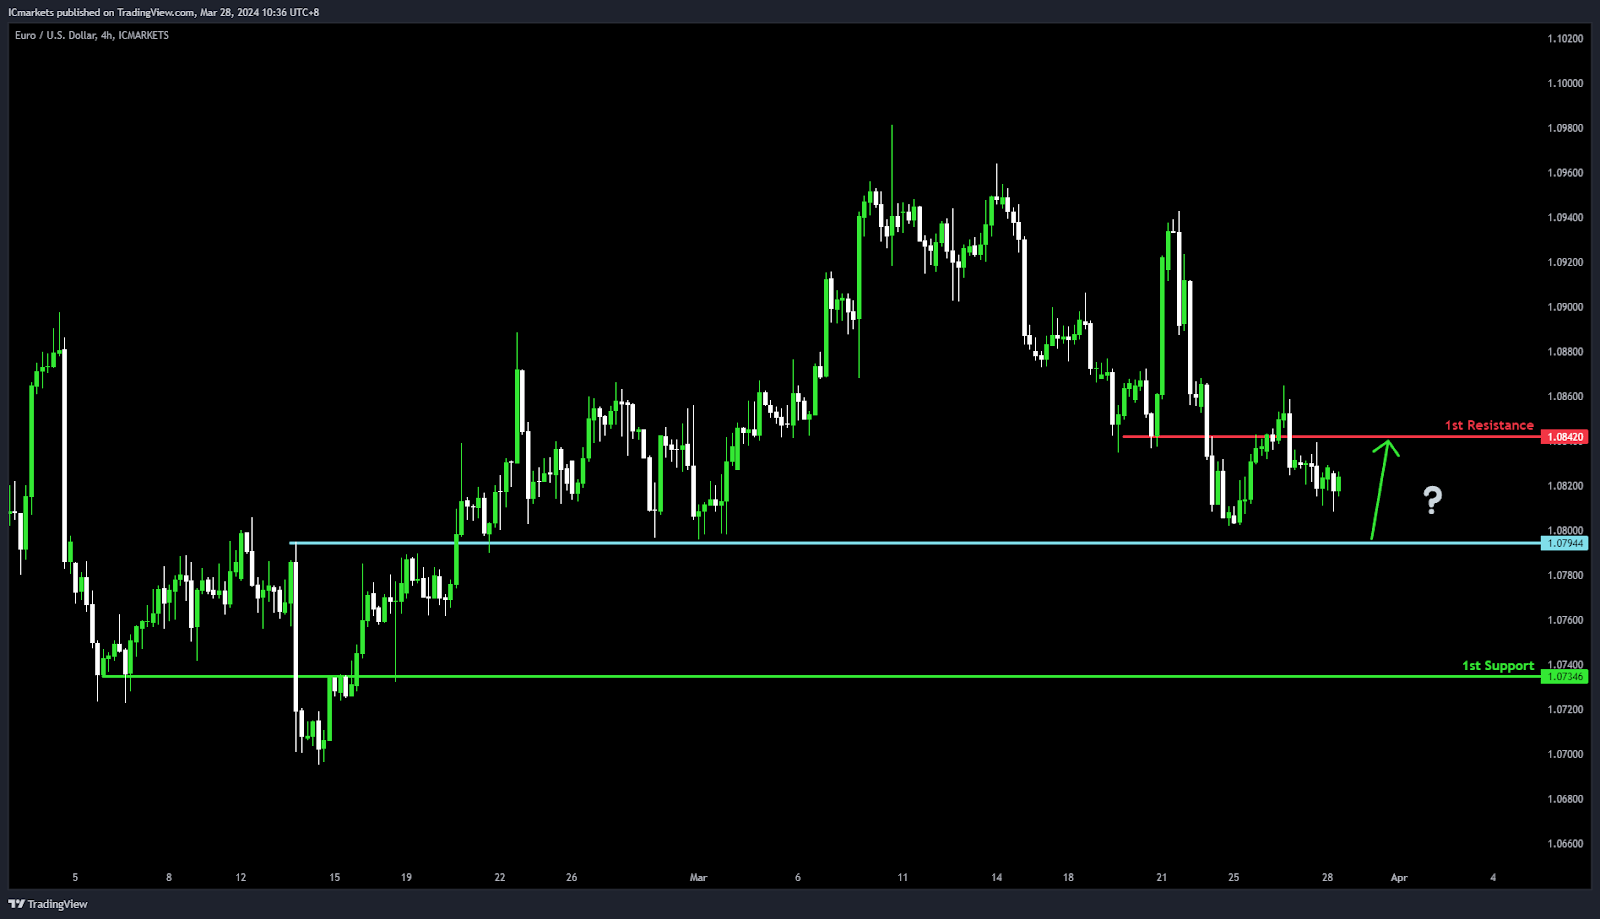
EUR/USD:
Potential Direction: Bullish
Overall momentum of the chart: Bearish
Price could potentially make a bullish bounce-off pivot and head toward 1st resistance
Pivot: 1.0805
Supporting reasons: Serves as Multi-swing low support, a critical area where buying pressure has historically been strong enough to initiate upward movements, indicating its significance as a launchpad for potential rallies.
1st support: 1.0756
Supporting reasons: Known as Pullback support with a 78.60% Fibonacci Projection, marking a significant level where the market has found support in the past, offering a solid foundation for buyers and potentially halting further declines.
1st resistance: 1.0853
Supporting reasons: Acts as an Overlap resistance, a key level where selling pressure may emerge, suggesting it’s an important threshold for price action, possibly capping upward momentum as traders watch for a reversal or continuation of the trend.
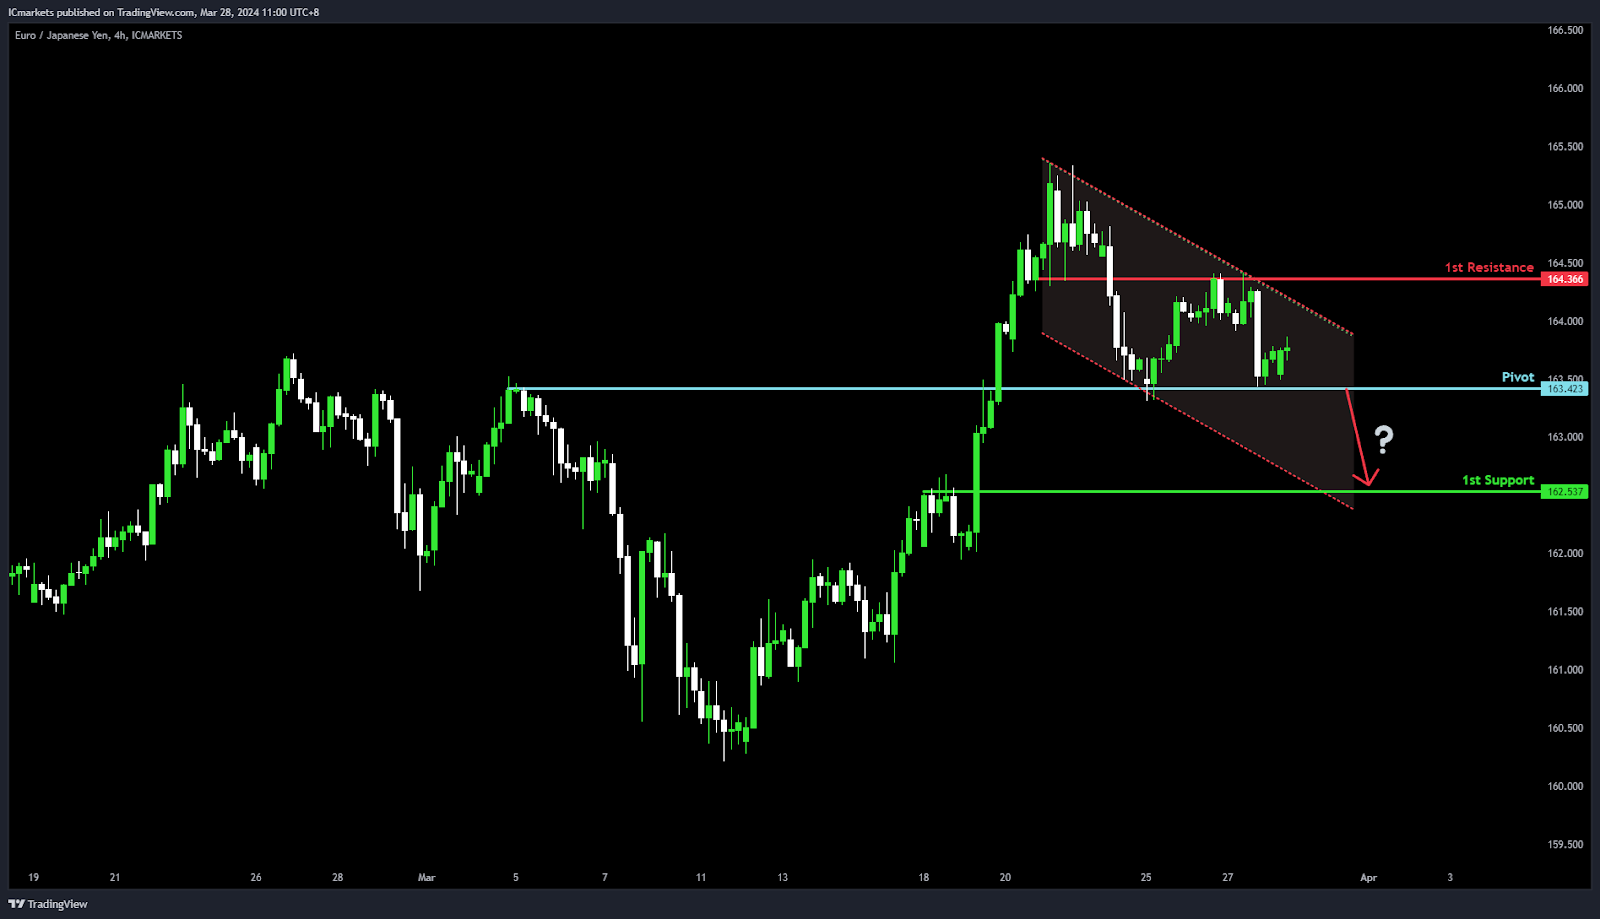
EUR/JPY:
Potential Direction: Bearish
Overall momentum of the chart: Bearish
Factors contributing to the momentum include the price being in a bearish descending channel.
Price could potentially make a bearish continuation towards 1st support
Pivot: 163.42
Supporting reasons: Acts as Pullback resistance, indicating a level where selling pressure has historically increased, suggesting a potential reversal point for price to continue its downward trajectory.
1st support: 162.53
Supporting reasons: Known as Pullback support, represents a significant area where the market has found support previously, offering a basis for potential price stabilization or a minor rebound within the bearish trend.
1st resistance: 164.36
Supporting reasons: Identified as an Overlap resistance, marking a key barrier that has capped previous attempts to move higher, indicating a crucial point for monitoring potential reversals or continuation of the bearish momentum.
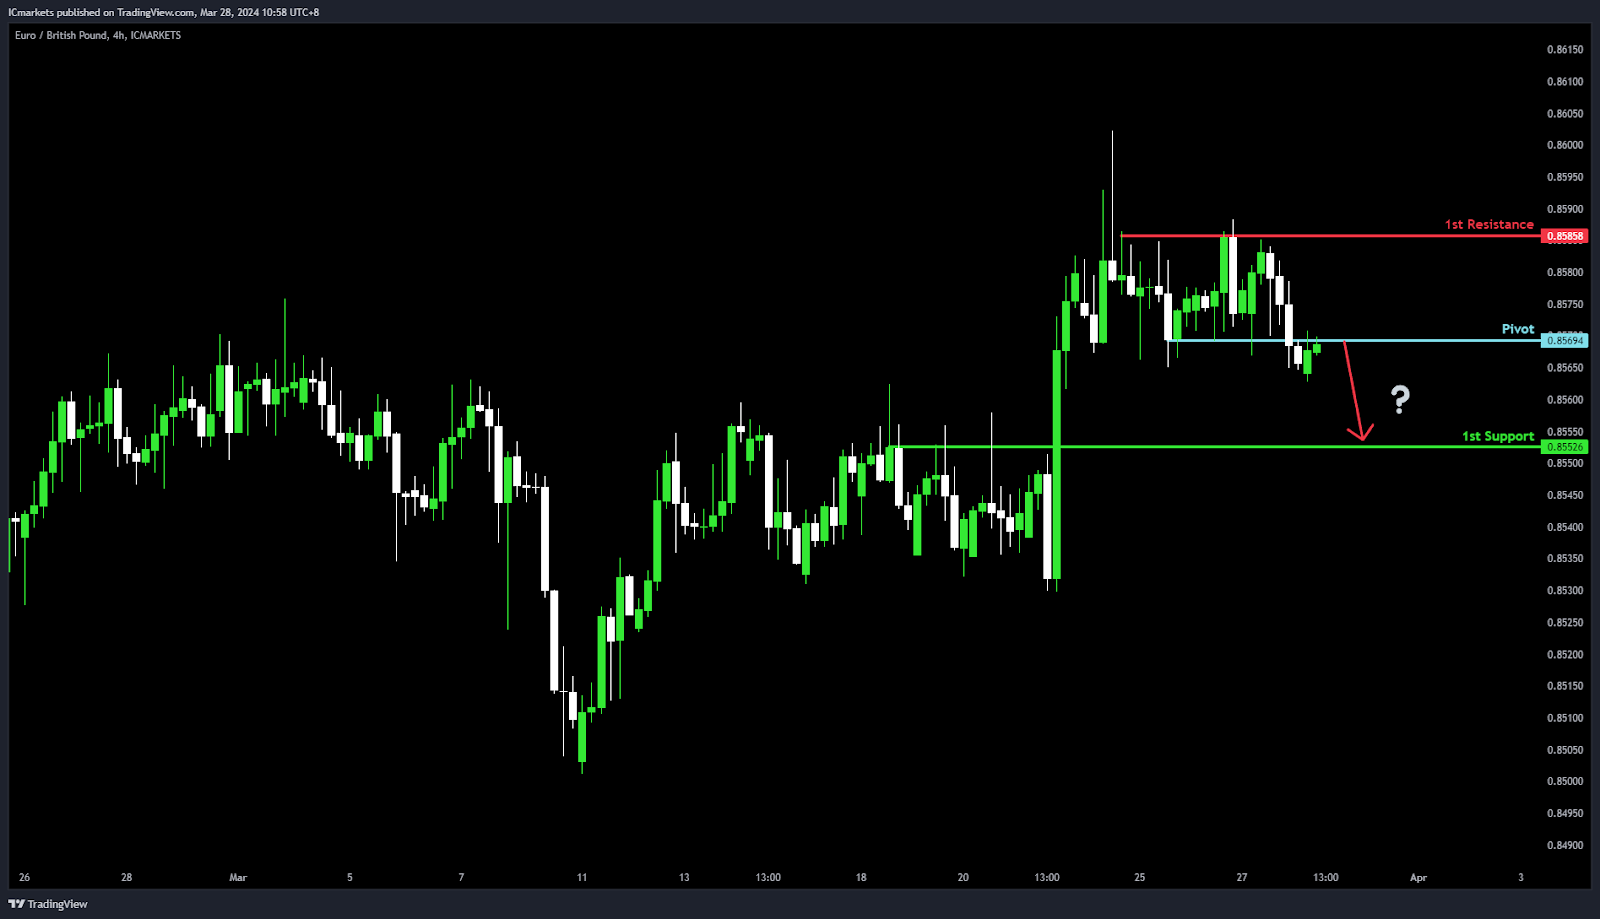
EUR/GBP:
Potential Direction: Bearish
Overall momentum of the chart: Bearish
Price could potentially make a bearish reaction off pivot and drop to 1st support
Pivot: 0.8569
Supporting reasons: Acts as Pullback resistance, a level where selling pressure could intensify, indicating a potential spot for the price to reverse and continue its downward movement.
1st support: 0.8552
Supporting reasons: Known as Pullback support, suggesting a significant area where the market has found support previously, offering a foundation for potential stabilization or a minor rebound within the bearish trend.
1st resistance: 0.8585
Supporting reasons: Identified as Multi-swing high resistance, marking a crucial barrier that has capped previous upward movements, highlighting its importance as a critical threshold for monitoring the bearish momentum.
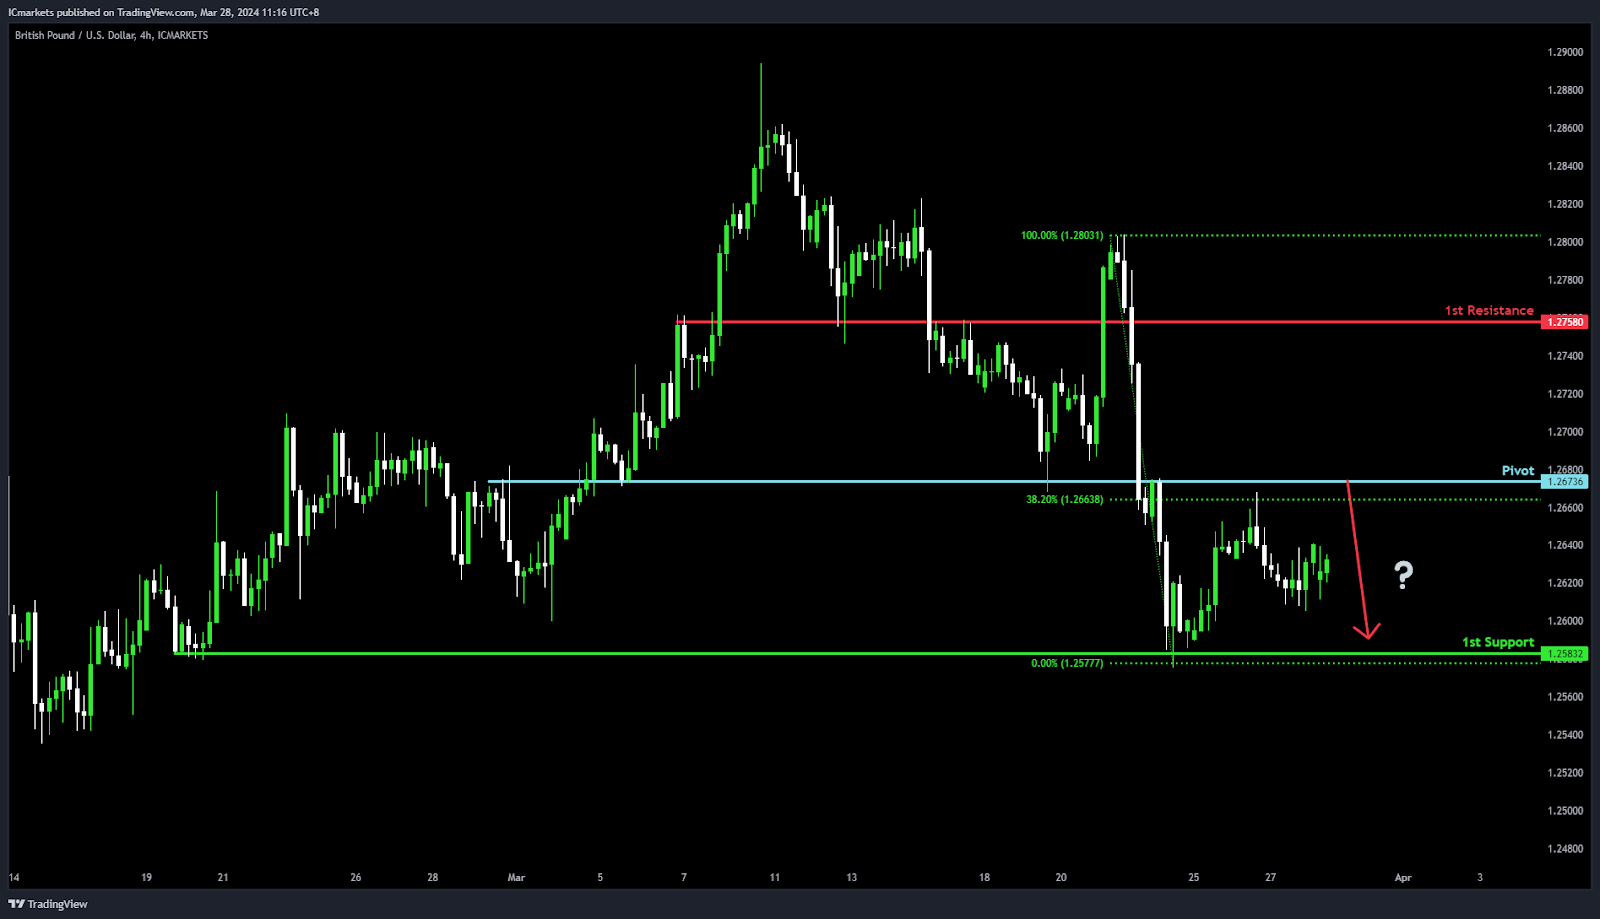
GBP/USD:
Potential Direction: Bearish
Overall momentum of the chart: Bearish
Price could potentially make a bearish reaction off pivot and drop to 1st support
Pivot: 1.2673
Supporting reasons: Acts as an Overlap resistance, aligning with a 38.20% Fibonacci Retracement, marking a significant level where selling pressure might increase, suggesting a pivotal spot for potential downturns in price movement.
1st support: 1.2583
Supporting reasons: Known as Multi-swing low support, indicating a strong area that could halt further declines, highlighting its importance as a foundation for potential price stabilization or a rebound.
1st resistance: 1.2758
Supporting reasons: Serves as Pullback resistance, a key barrier that could limit further advances, marking a crucial point for monitoring potential reversals or continuation of the bearish momentum.
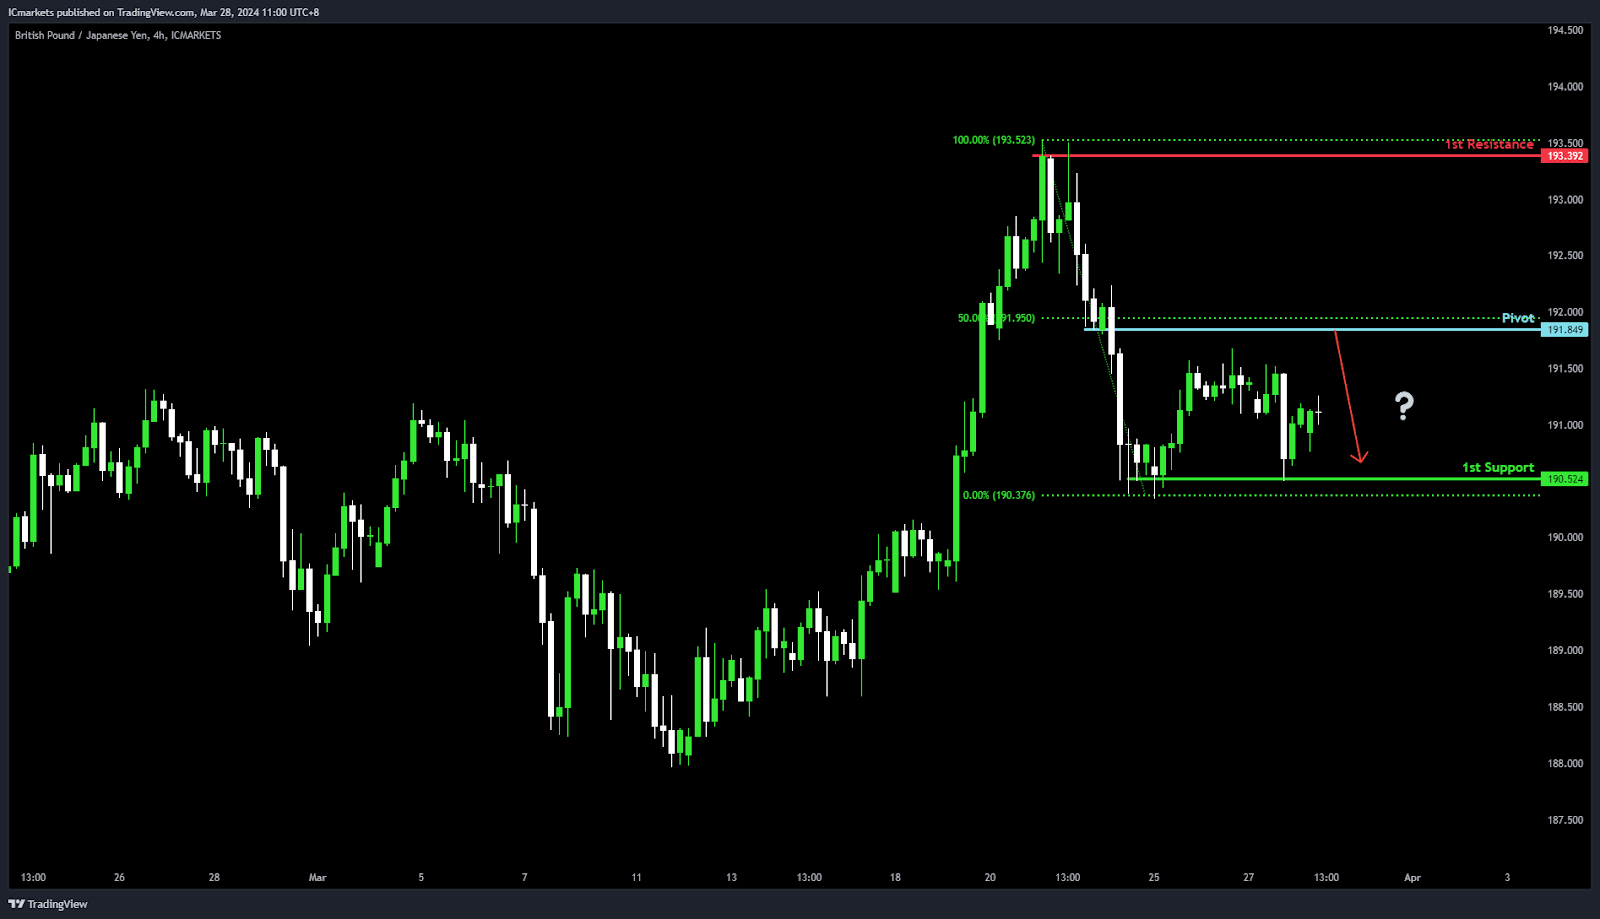
GBP/JPY:
Potential Direction: Bearish
Overall momentum of the chart: Bullish
Price could potentially make a bearish reaction off pivot and drop to 1st support
Pivot: 191.84
Supporting reasons: Acts as Pullback resistance with a 50% Fibonacci Retracement, indicating a significant level where selling pressure might increase, suggesting a potential reversal point for the price to continue its downward movement.
1st support: 190.52
Supporting reasons: Known as Multi-swing low support, suggesting a strong area where the market has previously found support, providing a foundation for potential stabilization or a minor rebound within the bullish trend.
1st resistance: 193.39
Supporting reasons: Identified as Multi-swing high resistance, marking a crucial barrier that has capped previous attempts to move higher.
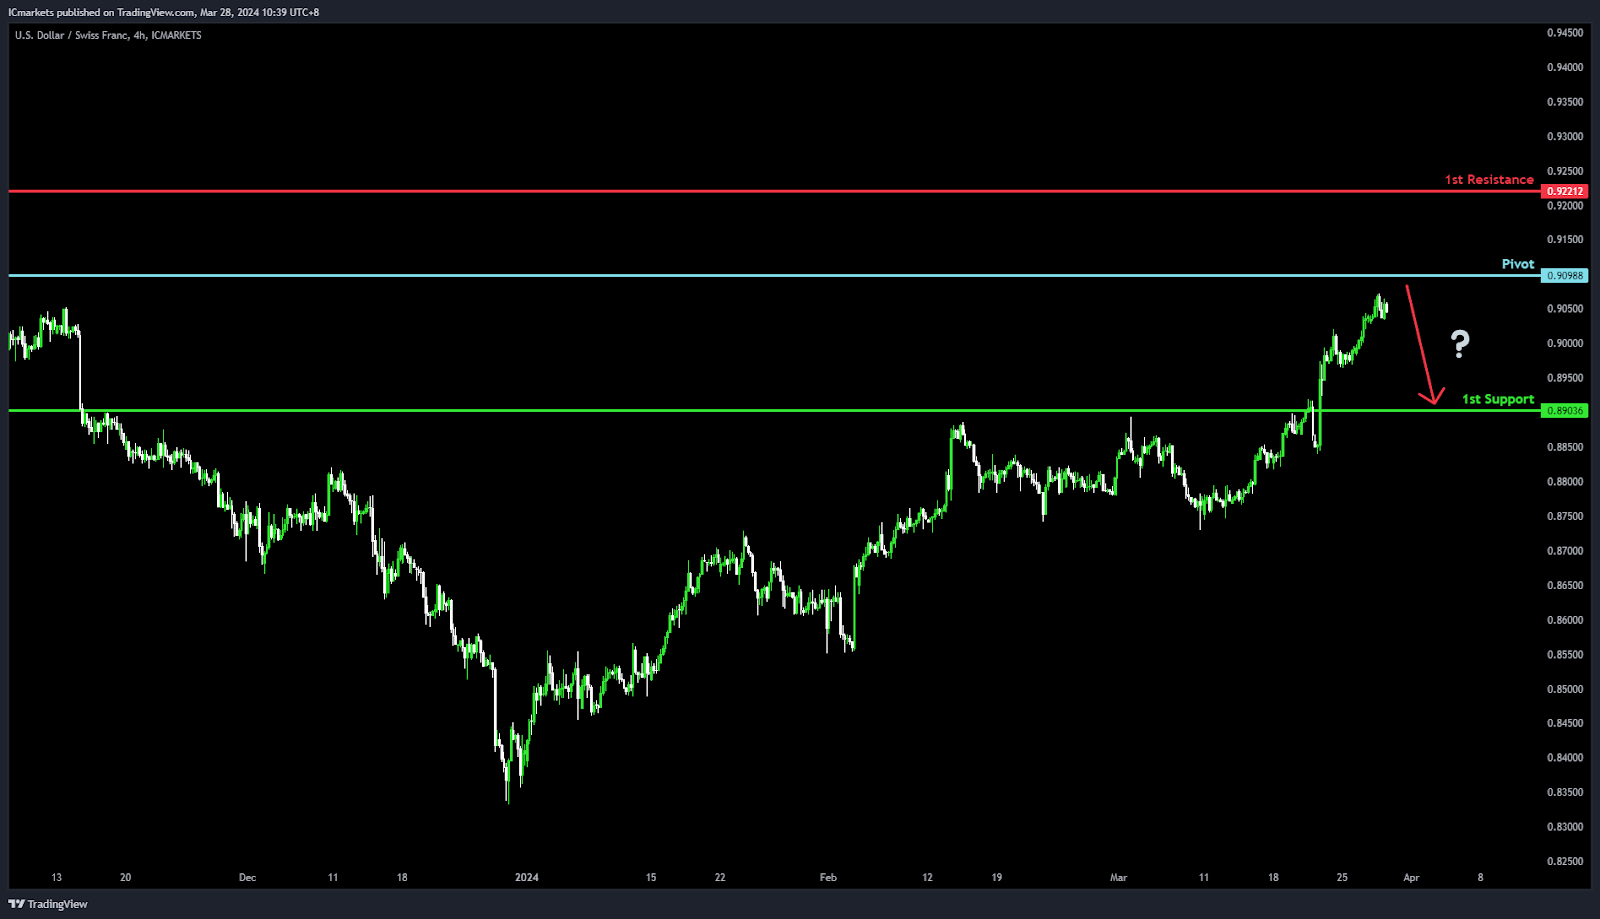
USD/CHF:
Potential Direction: Bearish
Overall momentum of the chart: Bullish
Price could potentially make a bearish reaction off pivot and drop to 1st support
Pivot: 0.9098
Supporting reasons: Acts as an Overlap resistance, a crucial point where selling pressure might intensify, suggesting a potential turning point for price to head downwards.
1st support: 0.8903
Supporting reasons: Known as Pullback support, indicating a significant area where the market has found support previously, offering a foundation for potential stabilization or a rebound in price.
1st resistance: 0.9221
Supporting reasons: Characterized by Multi-swing high resistance, a major barrier that has previously capped upward movements, highlighting its importance as a critical threshold for the bullish trend to overcome.
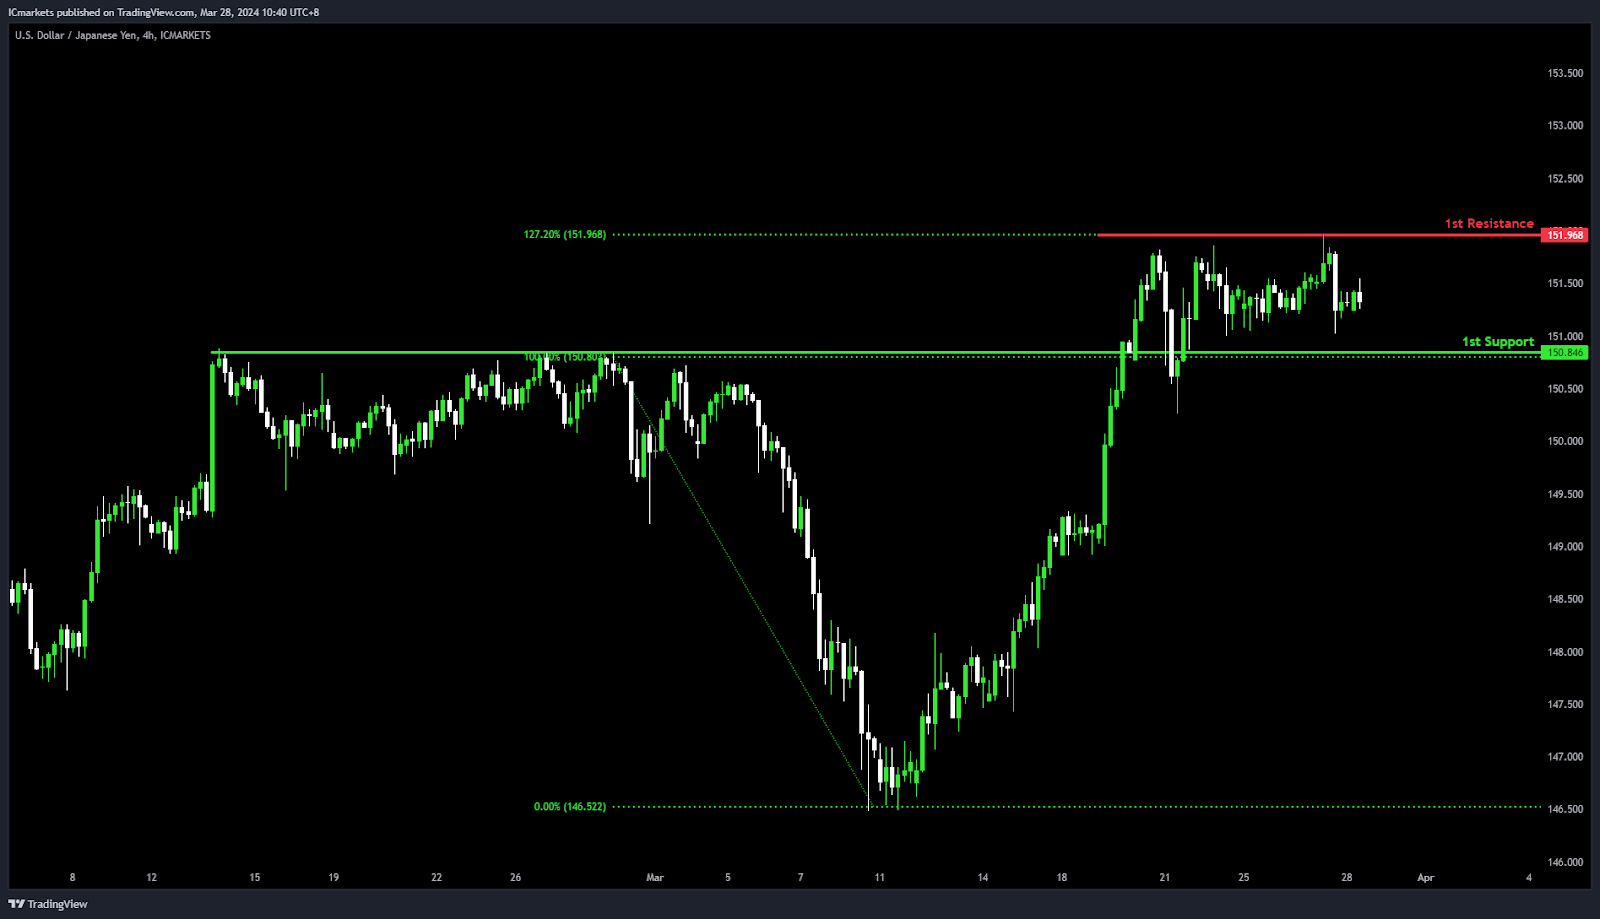
USD/JPY:
Potential Direction: Neutral
Overall momentum of the chart: Neutral
Price could potentially fluctuate between the 1st resistance and 1st support level.
1st support: 150.84
Supporting reasons: Acts as an Overlap support, indicating a strong area where buying interest has historically been present, offering a foundation for price stabilization or potential upward movement.
1st resistance: 151.96
Supporting reasons: Marked by a 127.20% Fibonacci Projection, highlighting a significant barrier that could cap upward movements, making it a pivotal point for potential reversals or pauses in price action
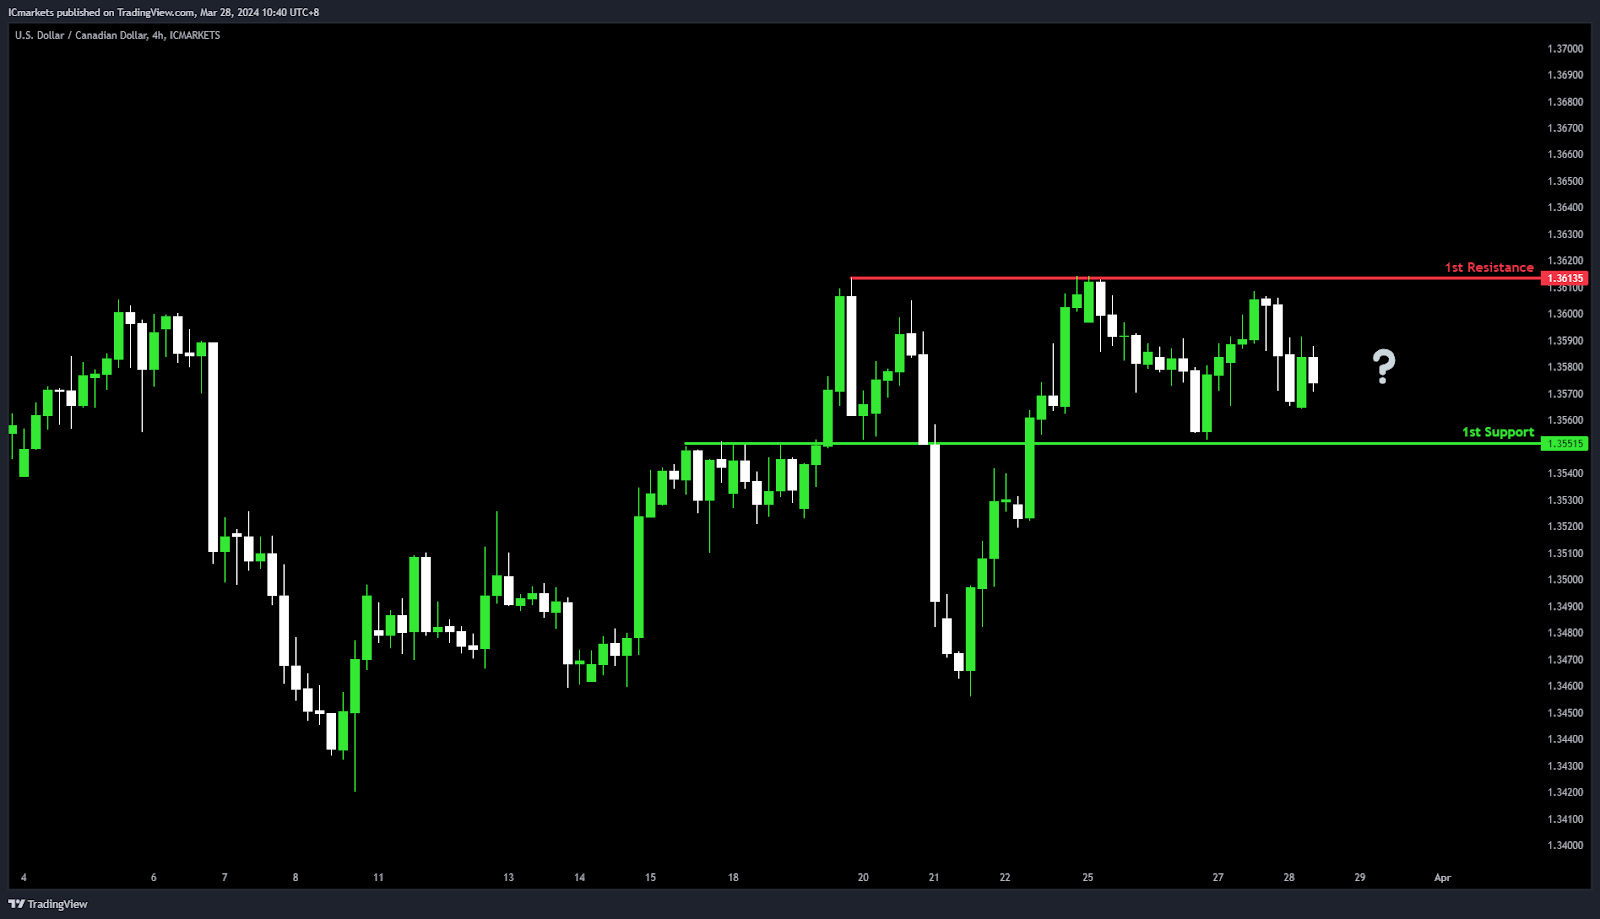
USD/CAD:
Potential Direction: Neutral
Overall momentum of the chart: Neutral
Price could potentially fluctuate between the 1st resistance and 1st support level.
1st support: 1.3551
Supporting reasons: Acts as an Overlap support, indicating a strong area where buying interest has historically been present, offering a foundation for price stabilization or potential upward movement. This level suggests a solid base that could prevent further declines.
1st resistance: 1.3613
Supporting reasons: Characterized by Multi-swing high resistance, marking a significant barrier that has capped previous upward movements. This indicates a crucial threshold for traders to watch, as breaking through this level could signal a shift in market sentiment or a continuation of the current neutral trend.
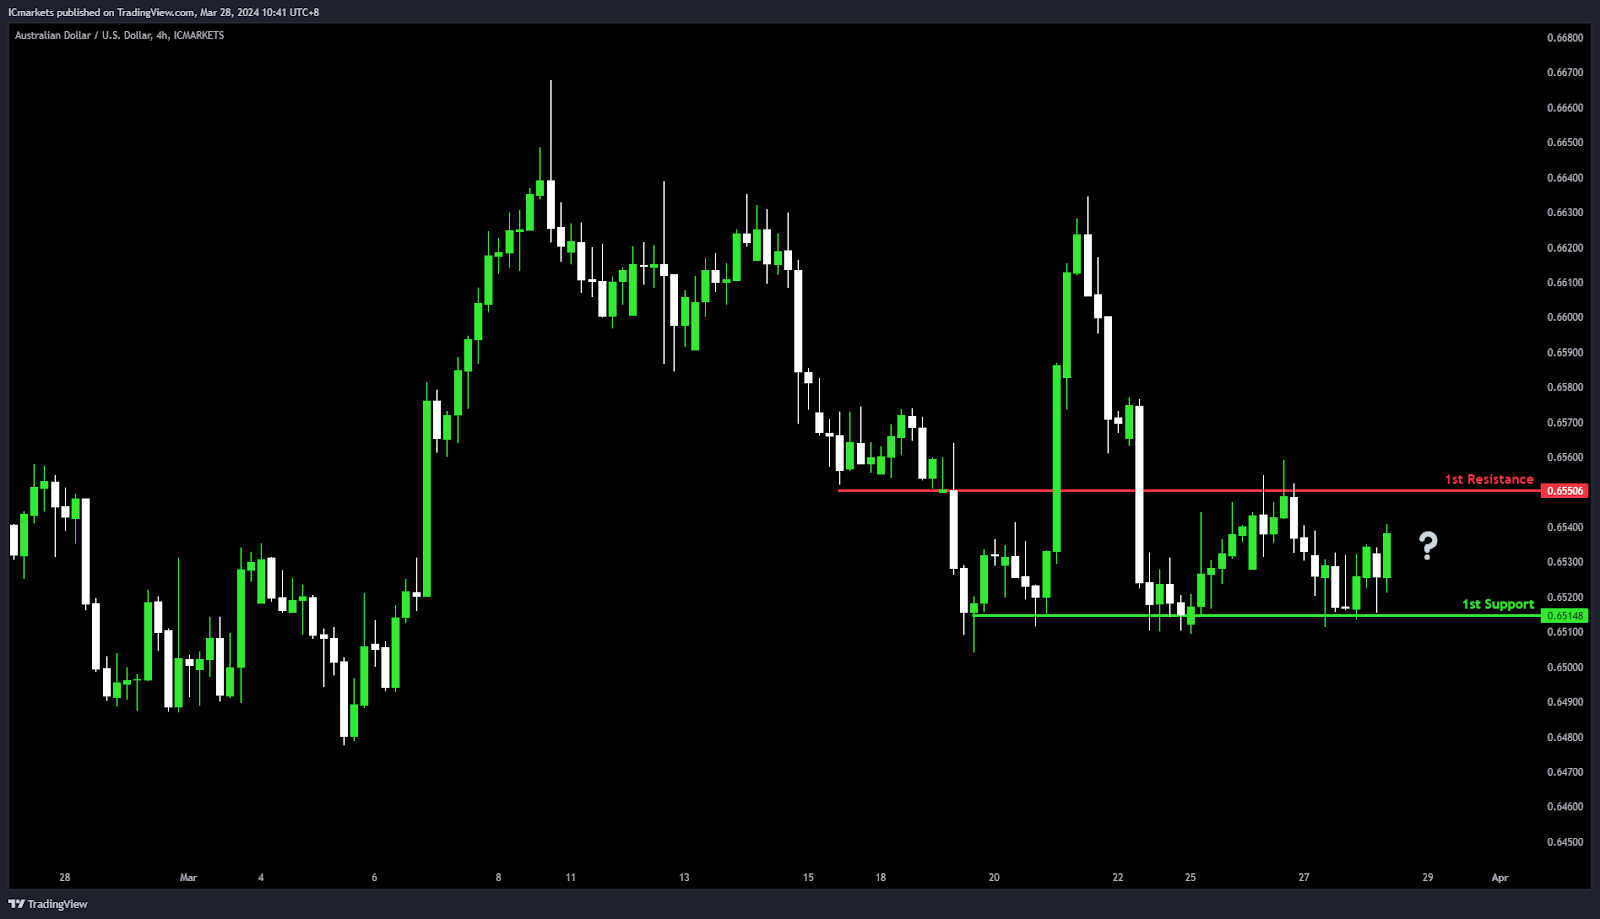
AUD/USD:
Potential Direction: Neutral
Overall momentum of the chart: Neutral
Price could potentially fluctuate between the 1st resistance and 1st support level.
1st support: 0.6514
Supporting reasons: Acts as an Overlap support, indicating a key level where buying interest has historically been strong, providing a foundation for potential price stabilization or a rebound
1st resistance: 0.6550
Supporting reasons: Identified as an Overlap resistance, marking a significant barrier that has capped previous upward movements. This indicates a crucial threshold for traders to watch, as overcoming this level could signal a shift in market sentiment or a continuation of the neutral trend.
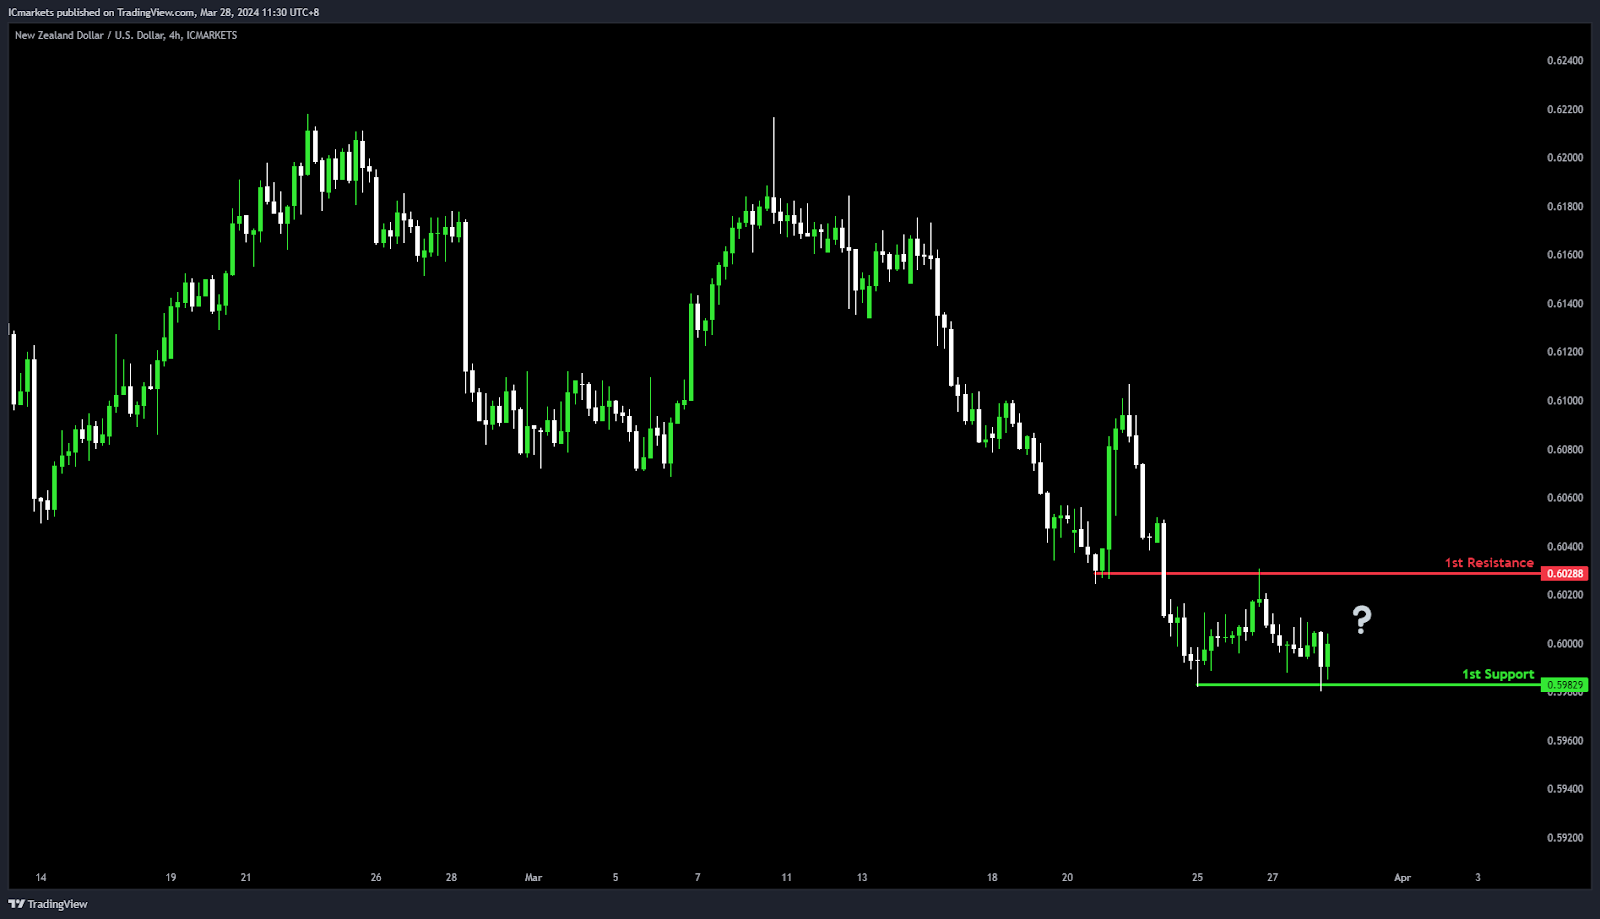
NZD/USD
Potential Direction: Neutral
Overall momentum of the chart: Neutral
Price could potentially fluctuate between the 1st resistance and 1st support level.
1st support: 0.5982
Supporting reasons: Acts as Multi-swing low support, indicating a key level where buying interest has historically been present, suggesting a solid foundation for potential price stabilization or a rebound. This level has shown to be a strong area that could prevent further declines.
1st resistance: 0.6028
Supporting reasons: Identified as an Overlap resistance, marking a significant barrier that has capped previous upward movements. This indicates a crucial threshold for traders to monitor, as breaking through this level could signal a shift in market sentiment or the continuation of the current neutral trend.
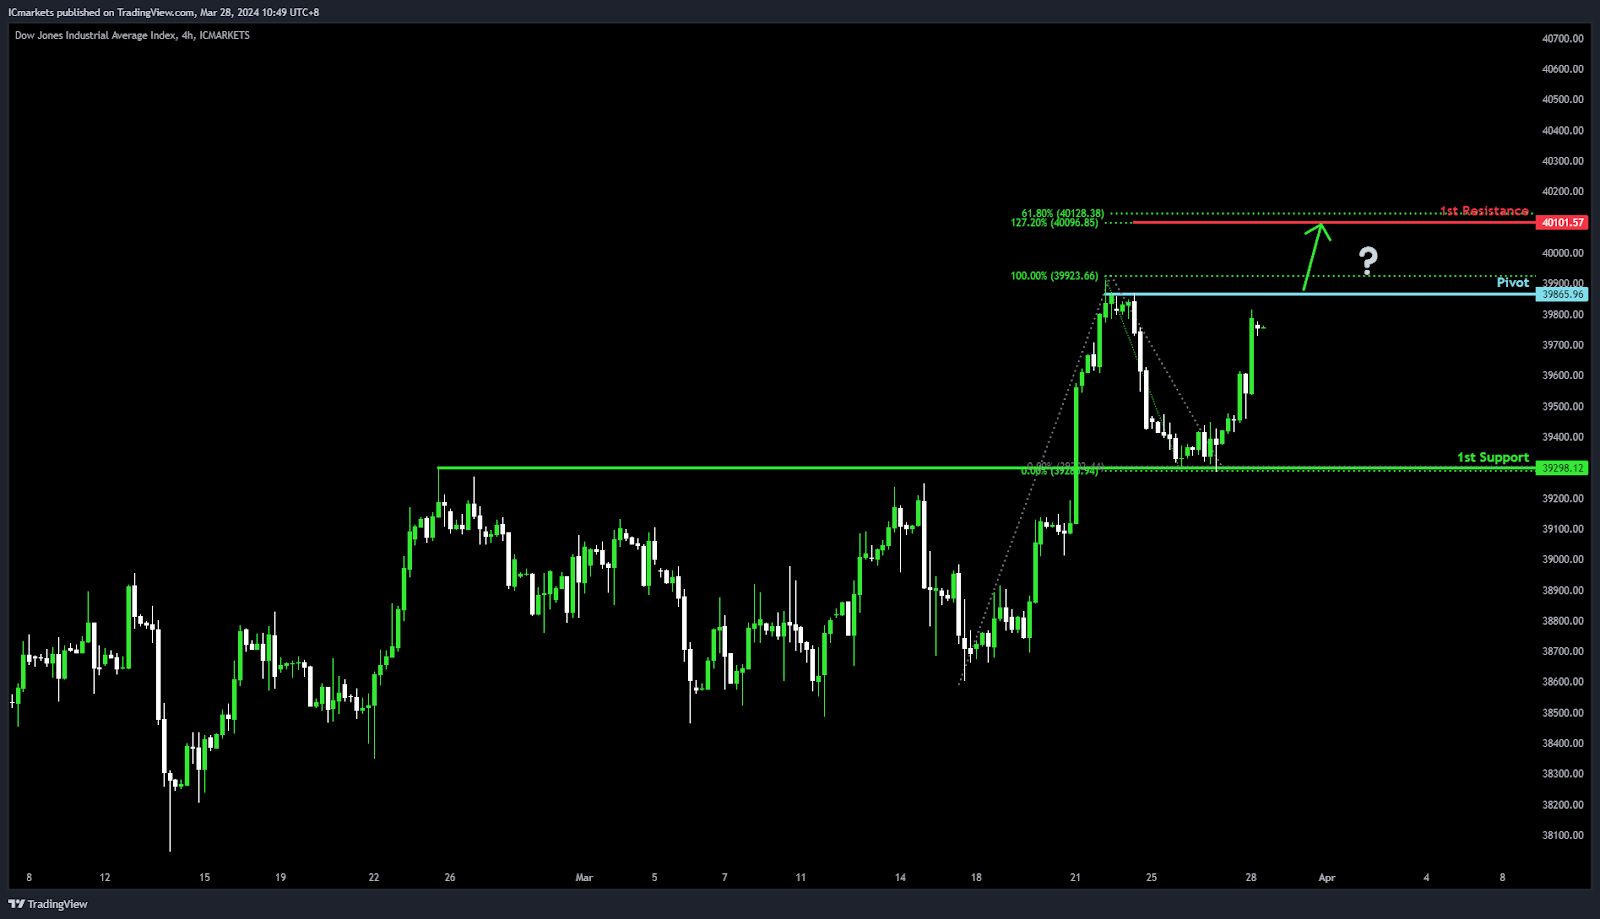
DJ30:
Potential Direction: Bullish
Overall momentum of the chart: Bullish
Price could potentially make a bullish breakthrough of pivot and rise to 1st resistance
Pivot: 39865.96
Supporting reasons: Identified as Multi-swing high resistance, indicating a key level that, if broken, could signify strong buying pressure and a continuation of the bullish trend.
1st support: 39298.12
Supporting reasons: Acts as an Overlap support, suggesting a strong area where buying interest has historically been present, providing a solid foundation for the price to stabilize or rebound if it retreats from higher levels.
1st resistance: 40101.57
Supporting reasons: Marked by a 127.20% Fibonacci Extension and a 61.80% Fibonacci Projection, indicating a significant level of Fibonacci confluence. This confluence acts as a strong technical indicator that the price could target, underscoring its importance for bullish momentum continuation.
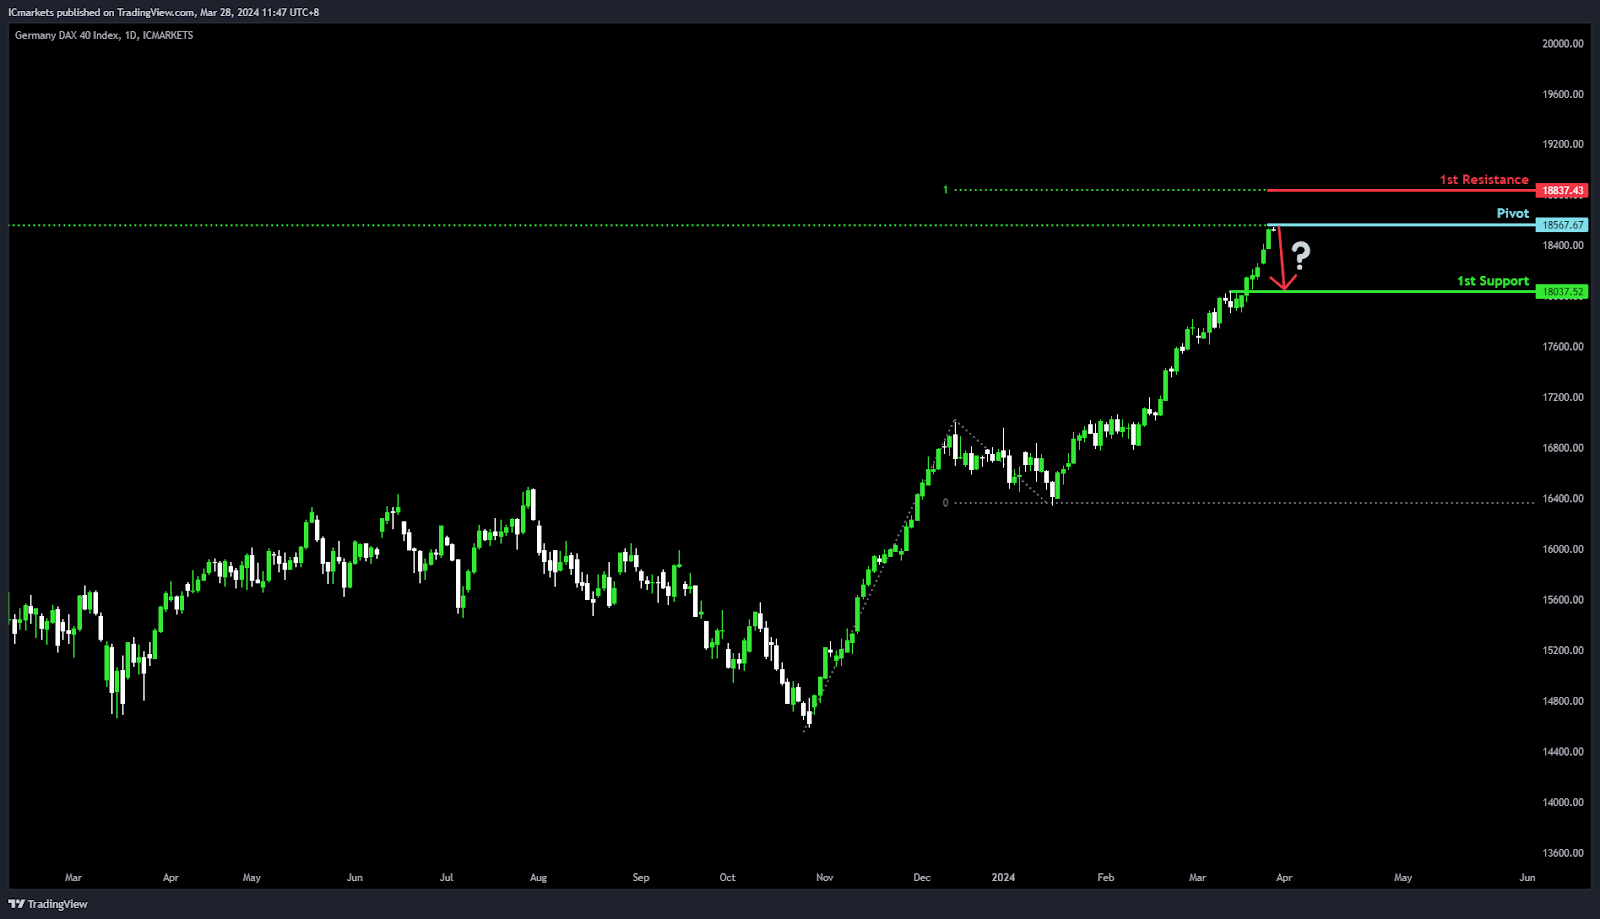
GER40:
Potential Direction: Bearish
Overall momentum of the chart: Bullish
Price could potentially make a bearish reaction off pivot and drop to 1st support
Pivot: 18567.67
Supporting reasons: Marked by a 78.60% Fibonacci Projection, indicating a significant level where selling pressure might intensify, suggesting a potential turning point for the price to reverse and move downwards.
1st support: 18037.52
Supporting reasons: Acts as an Overlap support, suggesting a strong area where buying interest has historically been present, providing a solid foundation for price stabilization or a rebound if it retreats from higher levels.
1st resistance: 18837.43
Supporting reasons: Characterized by a 100% Fibonacci Projection, marking a crucial barrier that has previously capped upward movements, indicating a significant threshold for monitoring the bearish momentum against the backdrop of the overall bullish trend.
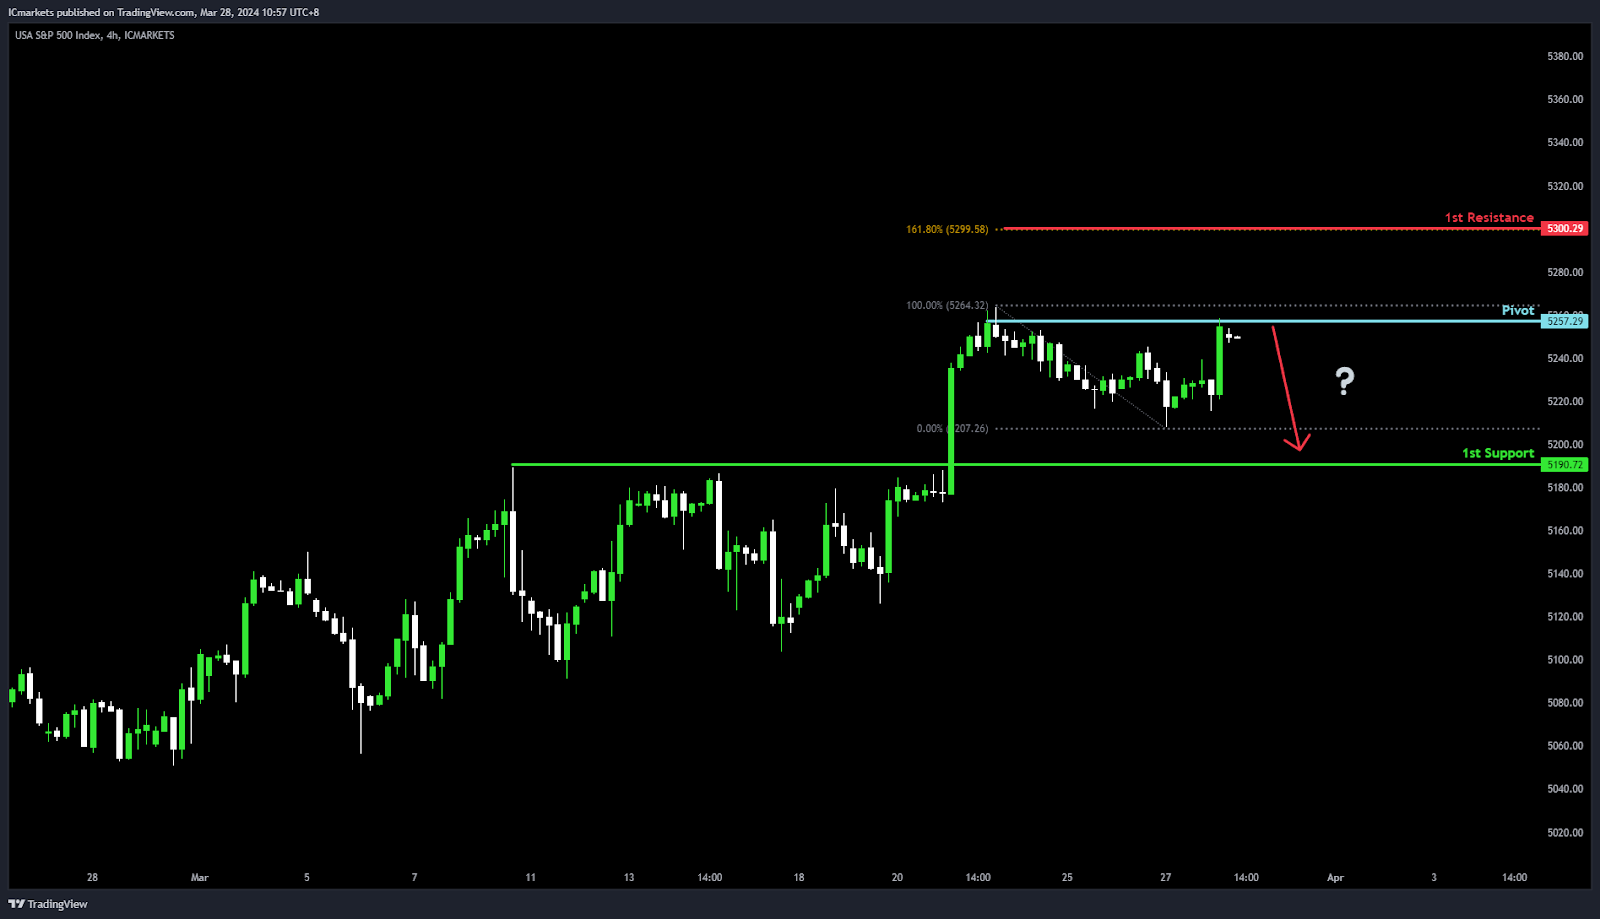
US500:
Potential Direction: Bearish
Overall momentum of the chart: Bullish
Price could potentially make a bearish reaction off pivot and drop to 1st support
Pivot: 5257.29
Supporting reasons: Acts as Multi-swing high resistance, a critical level that might indicate where selling pressure can increase, suggesting a potential turning point for price to reverse and move downwards within the context of an overall bullish trend.
1st support: 5190.72
Supporting reasons: Known as Pullback support, suggesting a significant area where the market has found support previously, providing a foundation for potential price stabilization or a minor rebound if it retreats from higher levels.
1st resistance: 5300.29
Supporting reasons: Marked by a 161.80% Fibonacci Extension, indicating a crucial barrier that could cap upward movements, highlighting its importance as a critical threshold for bullish attempts to continue the upward momentum.
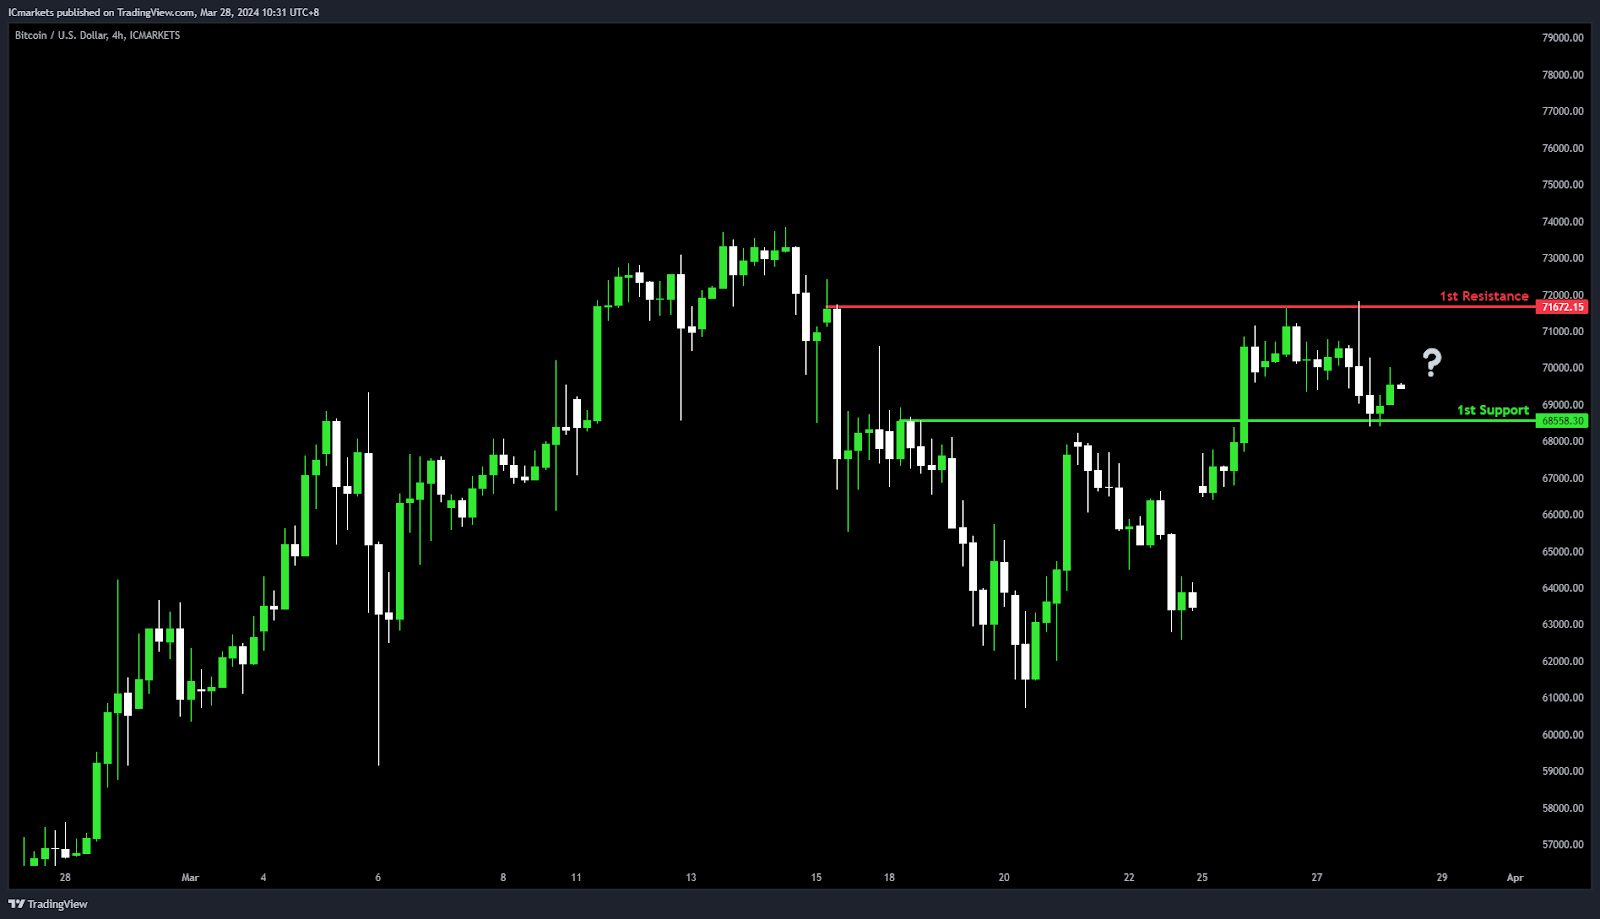
BTC/USD:
Potential Direction: Neutral
Overall momentum of the chart: Neutral
Price could potentially fluctuate between the 1st resistance and 1st support level.
1st support: 68558.30
Supporting reasons: Acts as an Overlap support, indicating a key level where buying interest has historically been strong, suggesting a solid foundation for potential price stabilization or a rebound if it retreats from higher levels.
1st resistance: 71672.15
Supporting reasons: Identified as Multi-swing high resistance, marking a significant barrier that has capped previous upward movements. This indicates a crucial threshold for traders to watch, as overcoming this level could signal a shift in market sentiment or the continuation of the current neutral trend.
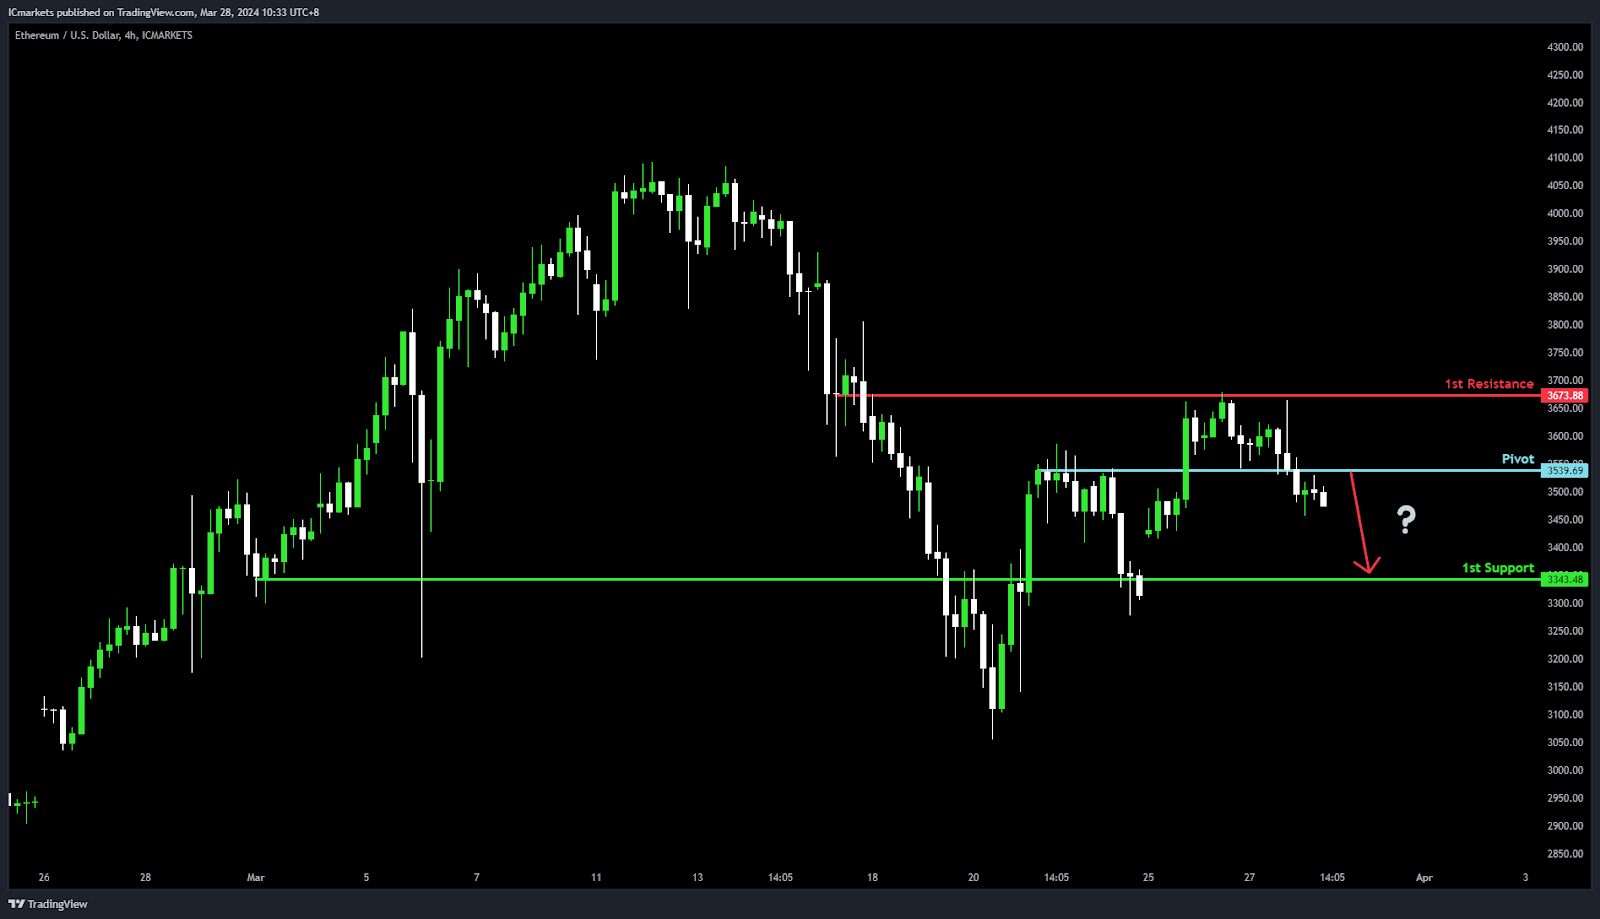
ETH/USD:
Potential Direction: Bearish
Overall momentum of the chart: Bearish
Price could potentially make a bearish continuation towards 1st support
Pivot: 3539.69
Supporting reasons: Acts as an Overlap resistance, a crucial level that might indicate where selling pressure can intensify, suggesting a potential turning point for the price to continue its downward movement.
1st support: 3343.48
Supporting reasons: Known as Pullback support, indicating a significant area where the market has previously found support, providing a foundation for potential price stabilization or a minor rebound within the bearish trend.
1st resistance: 3673.88
Supporting reasons: Identified as an Overlap resistance, marking a significant barrier that could cap upward movements, highlighting its importance as a threshold for monitoring bearish momentum within the context of an overall bearish market.
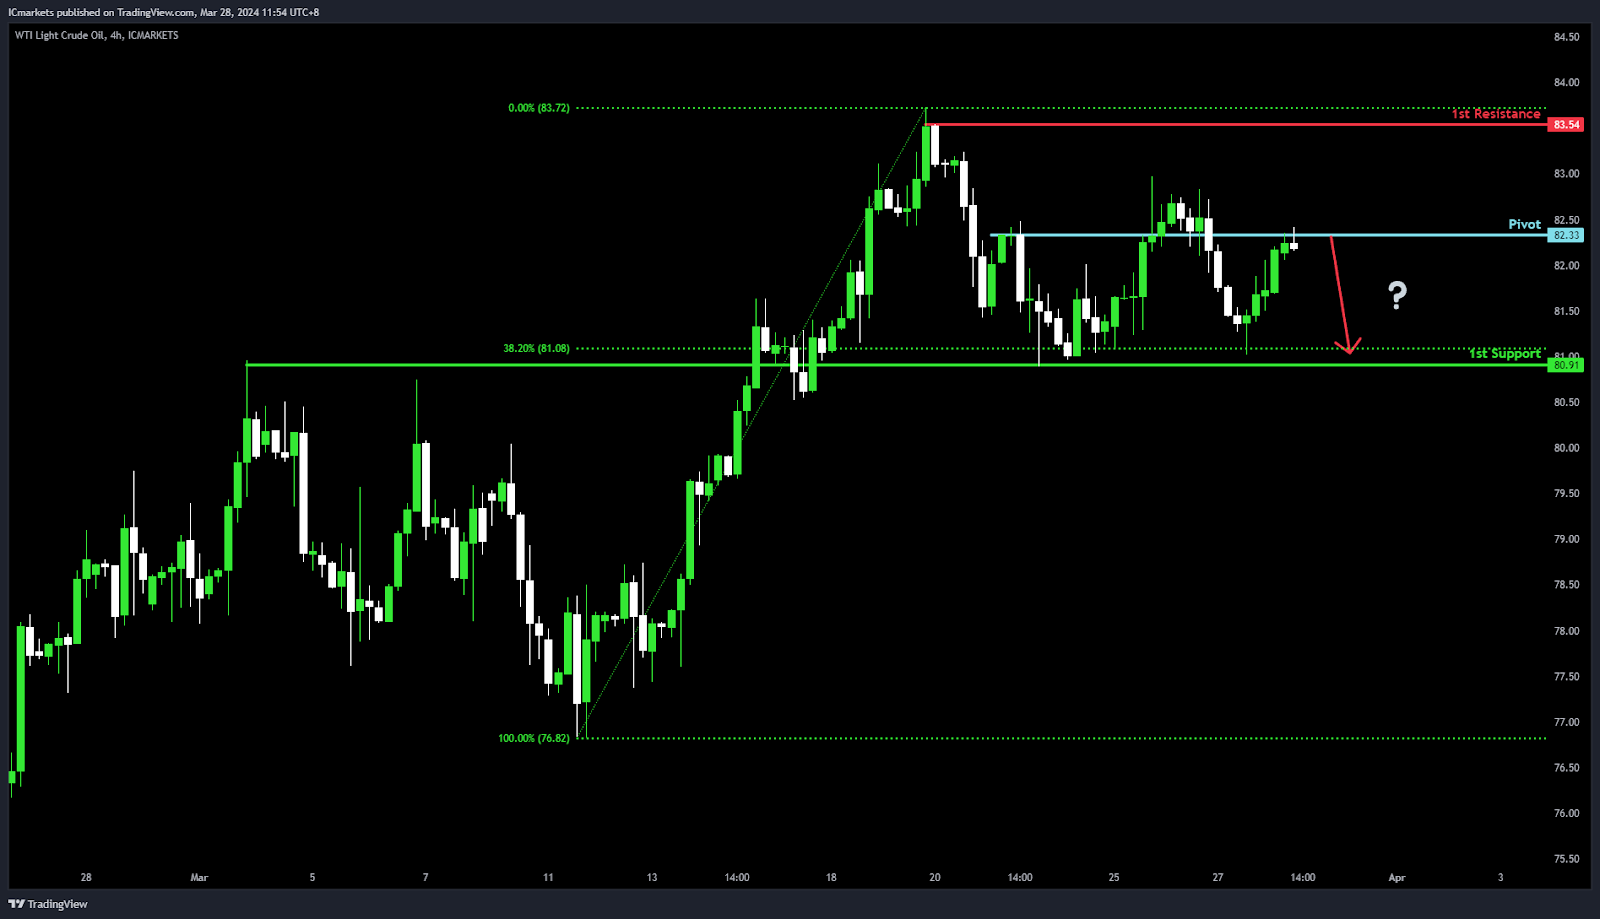
WTI/USD (Oil):
Potential Direction: Bearish
Overall momentum of the chart: Bullish
Price could potentially make a bearish reaction off pivot and drop to 1st support
Pivot: 82.33
Supporting reasons: Acts as an Overlap resistance, a crucial level that might indicate where selling pressure can intensify, suggesting a potential turning point for the price to reverse and move downwards despite the overall bullish trend.
1st support: 80.91
Supporting reasons: Known as Overlap support with a 38.20% Fibonacci Retracement, indicating a significant area where the market has previously found support, providing a foundation for potential price stabilization or a minor rebound within the bearish move.
1st resistance: 83.54
Supporting reasons: Identified as Swing high resistance, marking a critical barrier that could cap upward movements, highlighting its importance as a threshold for monitoring bearish momentum within the context of an overall bullish market.
.
XAU/USD (GOLD):
Potential Direction: Bearish
Overall momentum of the chart: Bullish
Price could potentially make a bearish continuation towards 1st support
Pivot: 2197.00
Supporting reasons: Serves as an Overlap resistance with a 61.80% Fibonacci Projection, indicating a significant level where selling pressure might intensify, suggesting a potential turning point for price to head downwards.
1st support: 2182.82
Supporting reasons: Known as Pullback support, indicating a strong area where the market has previously found support, offering a foundation for potential price stabilization or a minor rebound.
1st resistance: 2204.86
Supporting reasons: Characterized by a 78.60% Fibonacci Projection, marking a key barrier that has previously capped upward movements, highlighting its importance as a critical threshold for the price action.

The accuracy, completeness and timeliness of the information contained on this site cannot be guaranteed. IC Markets does not warranty, guarantee or make any representations, or assume any liability regarding financial results based on the use of the information in the site.
News, views, opinions, recommendations and other information obtained from sources outside of www.icmarkets.com, used in this site are believed to be reliable, but we cannot guarantee their accuracy or completeness. All such information is subject to change at any time without notice. IC Markets assumes no responsibility for the content of any linked site.
The fact that such links may exist does not indicate approval or endorsement of any material contained on any linked site. IC Markets is not liable for any harm caused by the transmission, through accessing the services or information on this site, of a computer virus, or other computer code or programming device that might be used to access, delete, damage, disable, disrupt or otherwise impede in any manner, the operation of the site or of any user’s software, hardware, data or property.


