
A note on lower timeframe confirming price action…
Waiting for lower timeframe confirmation is our main tool to confirm strength within higher timeframe zones, and has really been the key to our trading success. It takes a little time to understand the subtle nuances, however, as each trade is never the same, but once you master the rhythm so to speak, you will be saved from countless unnecessary losing trades. The following is a list of what we look for:
- A break/retest of supply or demand dependent on which way you’re trading.
- A trendline break/retest.
- Buying/selling tails/wicks – essentially we look for a cluster of very obvious spikes off of lower timeframe support and resistance levels within the higher timeframe zone.
- Candlestick patterns. We tend to only stick with pin bars and engulfing bars as these have proven to be the most effective.
We search for lower timeframe confirmation between the M15 the H1 timeframes, since most of our higher-timeframe areas begin with the H4. Stops are usually placed 5-10 pips beyond confirming structures.
EUR/USD:
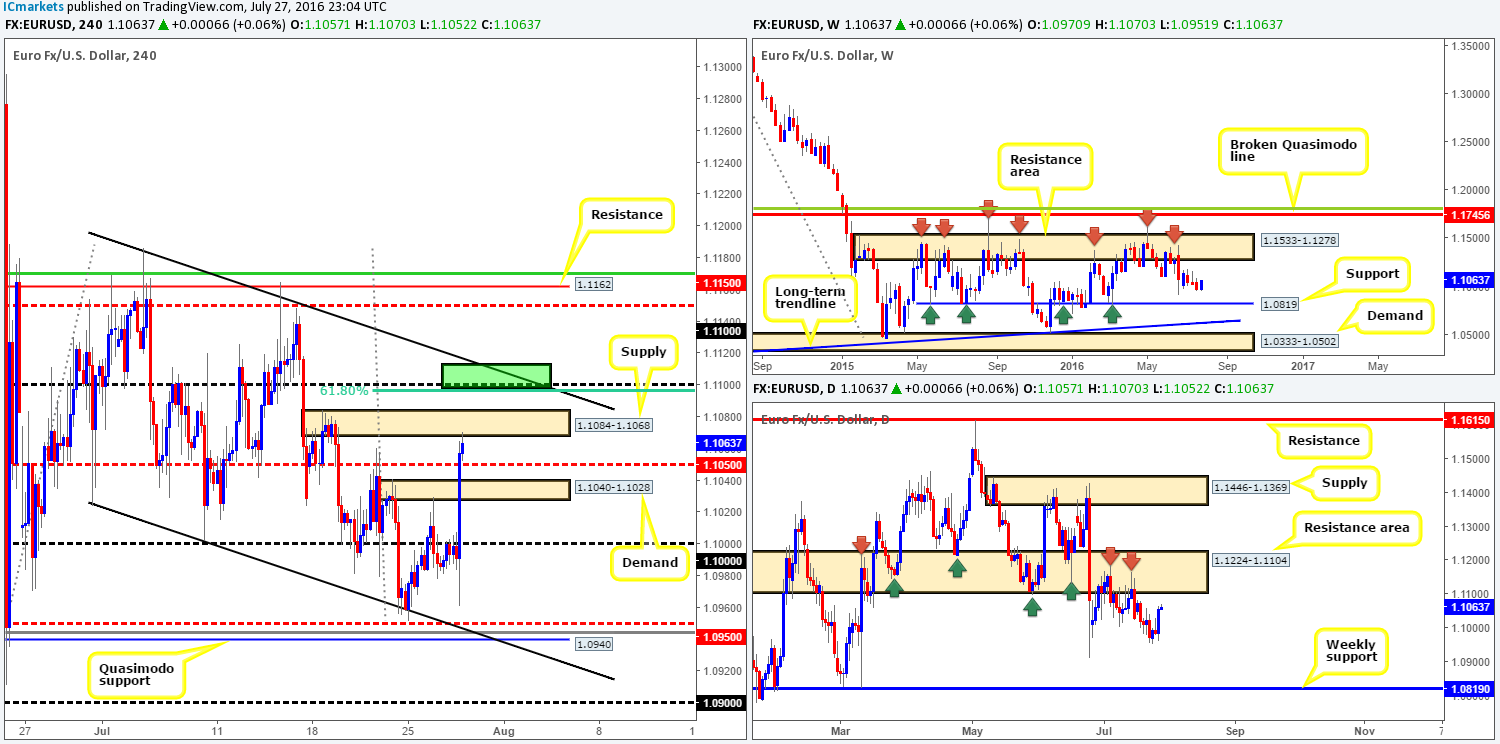
During yesterday’s Federal Reserve statement the EUR, as you can see from the H4 chart, was quickly offered to lows of 1.0961, before aggressively hitting the brakes and advancing to a fresh high of 1.1065 by the day’s end. Going into this morning’s open, nevertheless, candle action stabbed into the underside of a nearby H4 supply zone at 1.1084-1.1068 and has so far held firm. Be that as it may, with a H4 mid-way support line at 1.1050 lurking just below, followed closely by H4 demand at 1.1040-1.1028, our team is not really comfortable looking to sell here!
A level we are interested in, however, is the 1.11 handle. This area offers not only a H4 61.8% Fib resistance at 1.1095, but also an upper H4 channel resistance line extended from the high 1.1186 (green box). In addition to this, 1.11 also represents the underside of a daily resistance area at 1.1224-1.1104!
Our suggestions: Watch for shorting opportunities around the 1.11 region today. Despite the confluence surrounding this number, we’d still advise waiting for lower timeframe confirming price action to form before placing your hard-earned money on the line (see the top of this report), since round numbers are prone to whipsaws!
Levels to watch/live orders:
- Buys: Flat (Stop loss: N/A).
- Sells: 1.11 region [Tentative – confirmation required] (Stop loss: dependent on where one confirms this area).
GBP/USD:
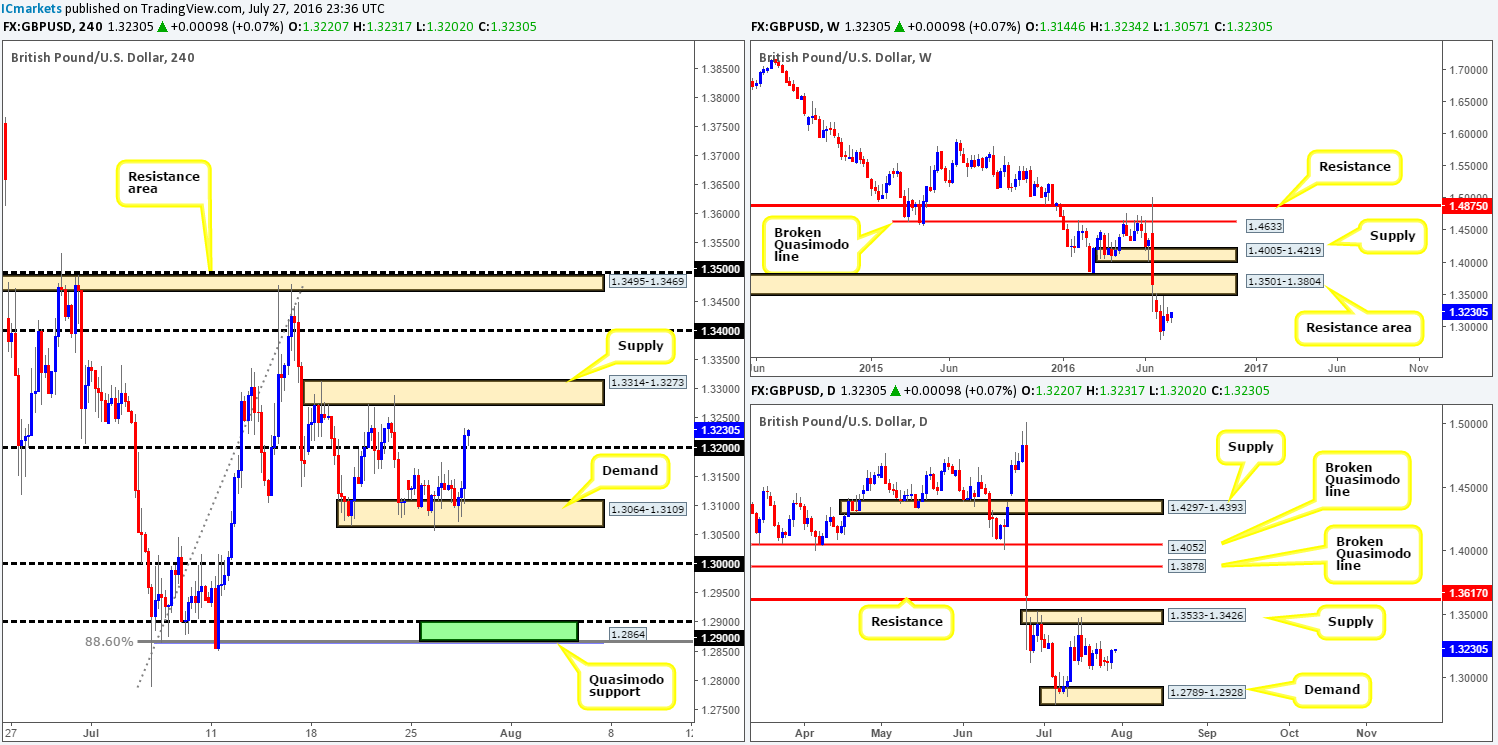
Going into yesterday’s American afternoon session, cable moved into a higher gear after the Fed, as expected, left interest rates unchanged. The psychological number 1.32 was taken out as a result, potentially clearing the runway north for further buying today up to the H4 supply drawn from 1.3314-1.3273.
With the predominant trend on this pair pointing south, and higher-timeframe structures revealing that there’s little support in this market to help propel prices higher, trading long from1.32 is a risky play in our book. Weekly support, as far as we can see, does not come into view until around the 1.20 region. We had to re-visit 1986 to find this! On top of this, daily movement is currently trading mid-range between a daily supply zone at 1.3533-1.3426 and a daily demand barrier drawn from 1.2789-1.2928.
Our suggestions: One could look to trade any retest seen off of the 1.32 line today, targeting H4 supply coming in at 1.3314-1.3273. We’re personally not comfortable with this trade setup since there’s absolutely no higher-timeframe confluence supporting the move. As such, opting to stand on the side lines here may very well be the best path to take.
Levels to watch/live orders:
- Buys: Flat (Stop loss: N/A).
- Sells: Flat (Stop loss: N/A).
AUD/USD:
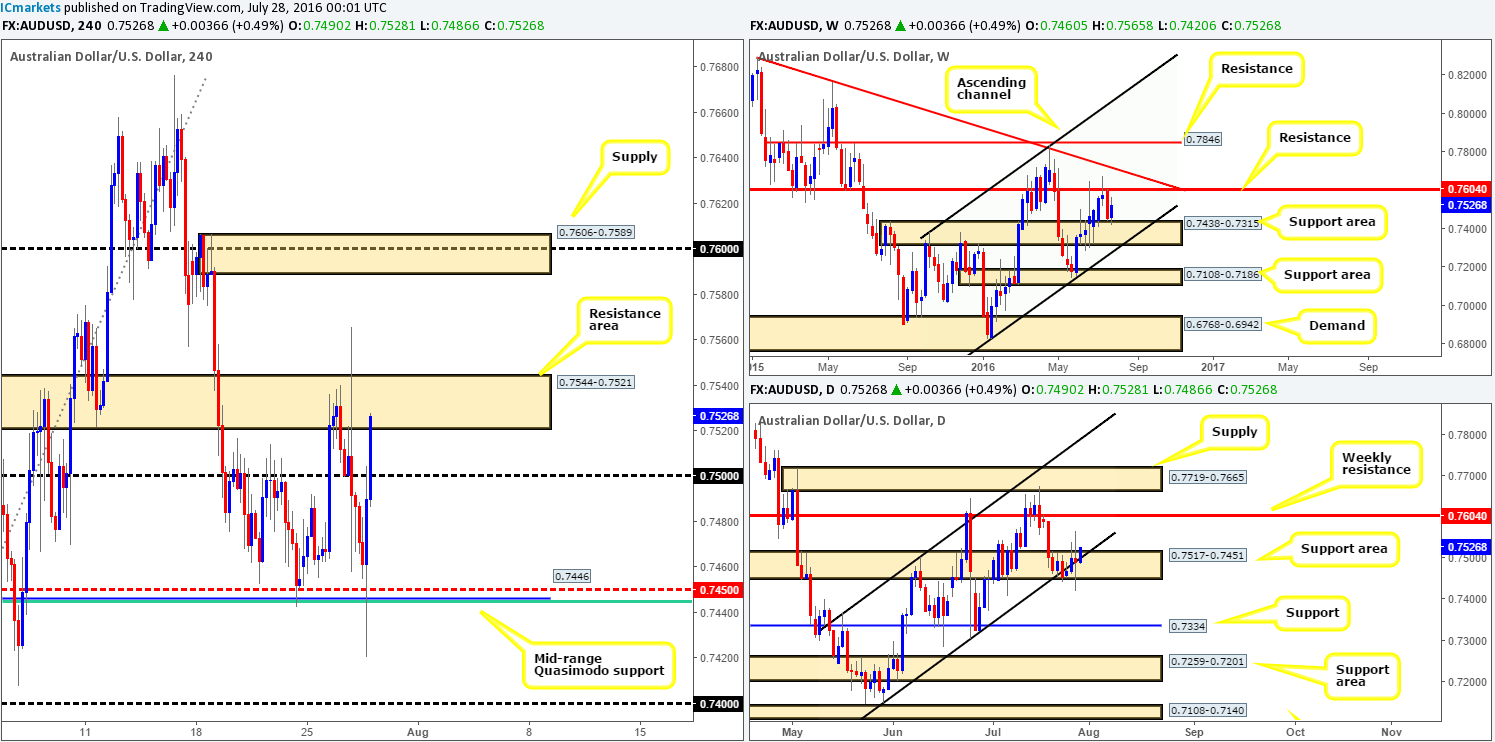
Looking at the weekly chart this morning, we can see that the bulls continue to defend to weekly support area drawn from 0.7438-0.7315. Providing that the bid-side of this market remains resilient, the next upside target on the hit list is a weekly resistance level penciled in at 0.7604. Turning our attention to the daily chart, recent candle action chalked up a clear-cut indecision candle. This, as you can see, formed within a daily support area at 0.7517-0.7451 that is bolstered by a daily channel support line extended from the low 0.7148.
The impact of the Fed’s decision to leave interest rates unchanged yesterday forced the commodity currency to whipsaw through the H4 mid-range Quasimodo level at 0.7446, and end the day attacking the 0.75 handle. At the time of writing, however, the Aussie is trading above this psychological boundary and is now crossing swords with a H4 resistance area drawn from 0.7544-0.7521.
Our suggestions: In view of higher-timeframe structure, we recommend watching for price to close above and retest the H4 resistance area at 0.7544-0.7521 as demand. Following a successful retest, one could look to enter long with their stops placed below the traded area. To our way of seeing things, there’s only one target to be had on this trade: the H4 supply zone coming in at 0.7606-0.7589 which envelopes the weekly resistance level mentioned above at 0.7604.
Levels to watch/live orders:
- Buys: Watch for price to close above the H4 resistance area at 0.7544-0.7521 and look to trade any retest seen thereafter (Stop loss: 0.7515).
- Sells: Flat (Stop loss: N/A).
USDJPY:
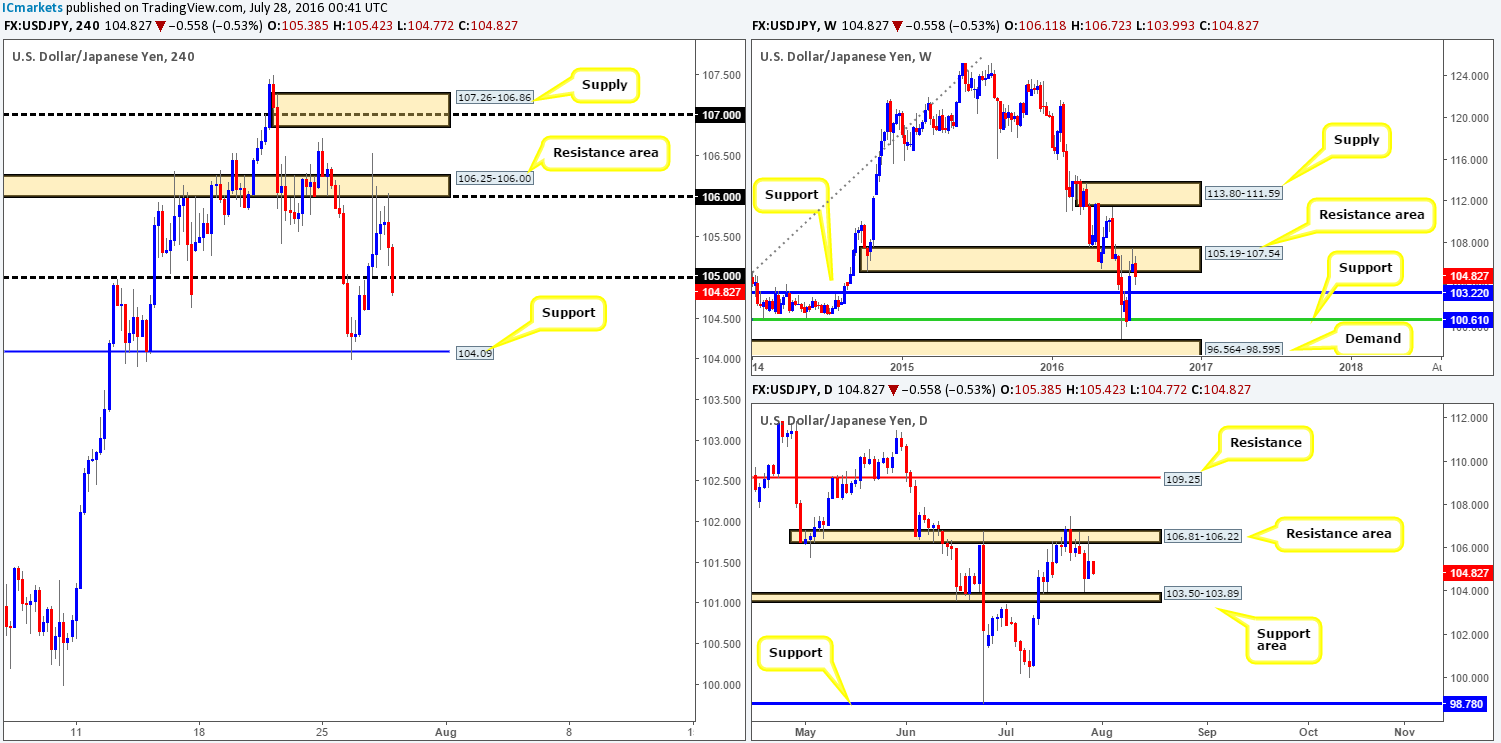
In view of weekly price still flirting with a weekly resistance area at 105.19-107.54, we feel this pair is likely to continue heading lower until price touches base with a weekly support level penciled in at 103.22. Looking down to the daily chart, however, the candles show price is currently capped between a daily resistance area at 106.81-106.22 (positioned within the above said weekly resistance area) and a daily support area coming in at 103.50-103.89 (sits thirty or so pips above the aforementioned weekly support level).
Stepping across to the H4 chart, the major is seen trading below the 105 handle, following a modest sell off from the H4 resistance area at 106.25-106.00. This – coupled with both weekly and daily structure showing room to move lower (see above), a short on any retest seen at 105 is most certainly a viable trade setup in our book
Our suggestions: Watch for price to close below the 105 handle and look to trade any retest seen thereafter. We would advise waiting for lower timeframe confirmation following the retest since psychological numbers tend to attract fakeouts (see the top of this report).
Levels to watch/live orders:
- Buys: Flat (Stop loss: N/A).
- Sells: Watch for price to close below the 105 handle and look to trade any retest seen thereafter (lower timeframe confirmation required).
USD/CAD:
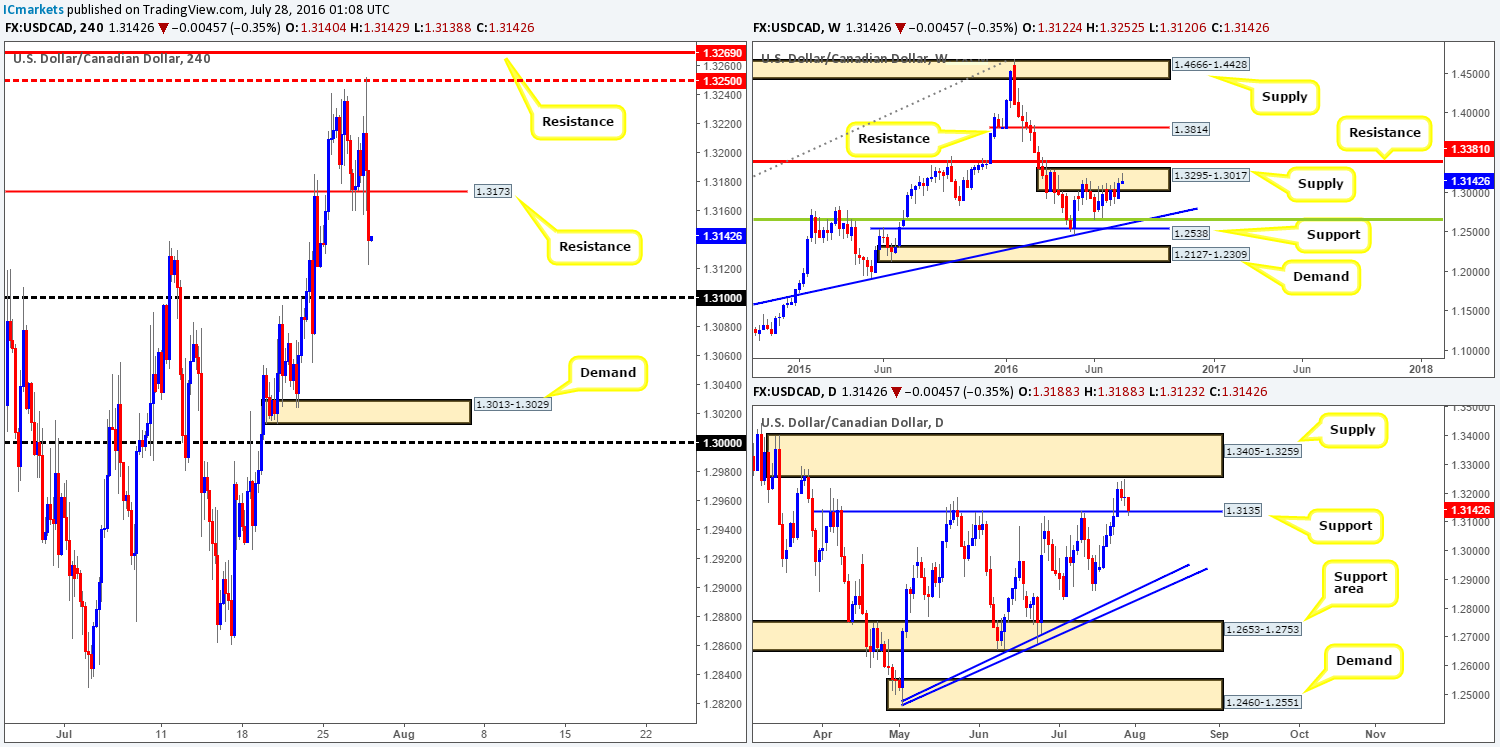
Shortly after the Fed reported that interest rates would be left unchanged, the USD/CAD drove lower. As can be seen from the H4 chart, further downside continues to play out, consequently engulfing the H4 support at 1.3173 (now acting resistance), and tagging in bids around a daily support level chalked up at 1.3135. In view of weekly price selling off from within a weekly supply base at 1.3295-1.3017, the current daily support line could eventually give way due to this pressure.
Despite the weekly structure currently in place, selling right now is not something we’d stamp high probability! For us to become sellers in this market, a close beyond 1.31 would need to take place, followed by a retest of this number as resistance. Only then would we consider looking for a lower timeframe entry to sell this pair down to H4 demand at 1.3013-1.3029 and quite possibly the key figure 1.30, since price would then be trading below the aforementioned daily support level.
Our suggestions: Watch for price to close below and retest 1.31. Should this come to fruition, a lower timeframe sell signal would then be required in order to find an entry (see the top of this report). Targets, as explained above, are as follows: the H4 demand base at 1.3013-1.3029, and the 1.30 handle.
Levels to watch/live orders:
- Buys: Flat (Stop loss: N/A).
- Sells: Watch for price to close below the 1.31 handle and look to trade any retest seen thereafter (lower timeframe confirmation required).
USD/CHF:
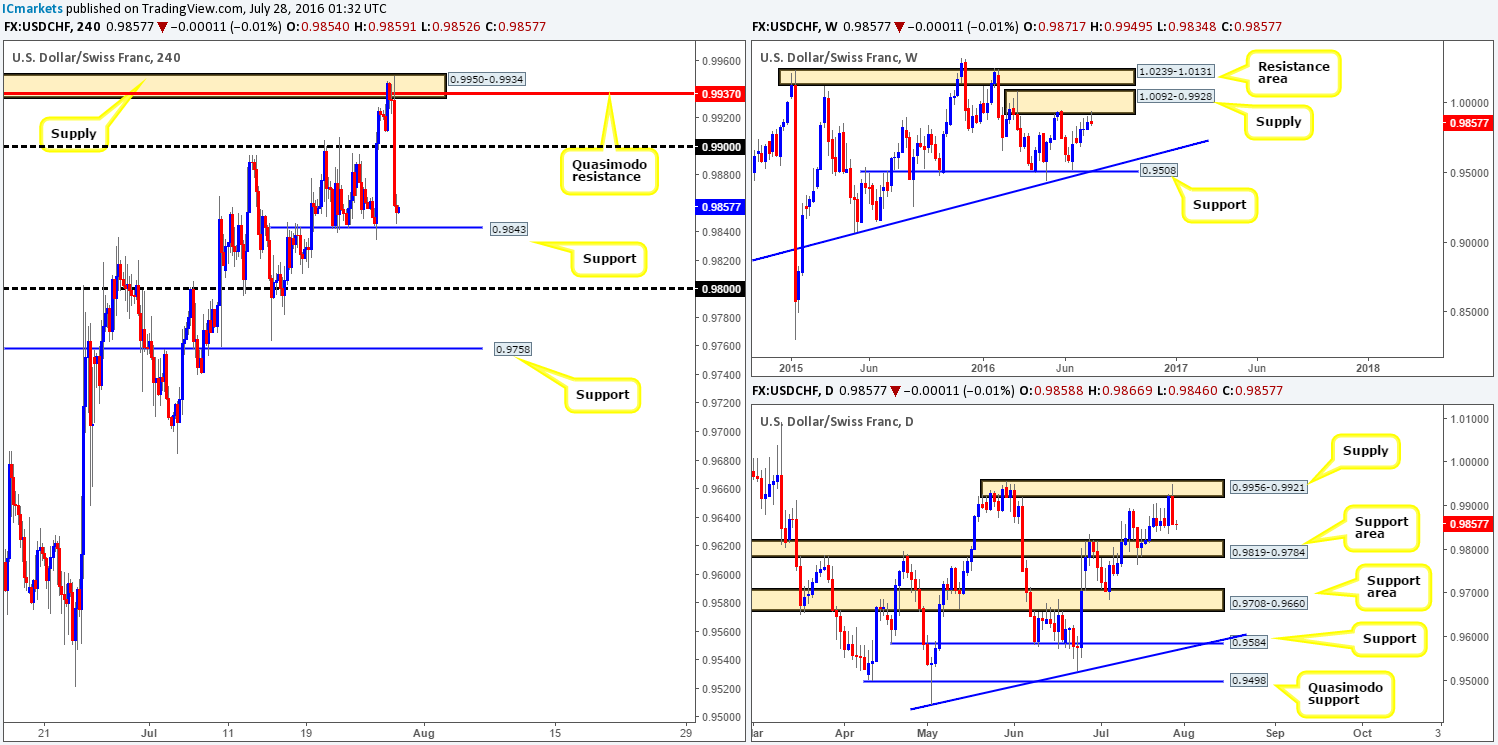
For those who read our previous report on the USD/CHF (see link below) you may recall us mentioning that our team placed a pending sell order at 0.9933 – just below a H4 supply zone at 0.9950-0.9934, with a stop set at 0.9960. Aided by the Fed keeping interest rates unchanged, the pair sold off from this zone just beautifully! Well done to anyone who jumped in alongside us on this one as price is now trading within shouting distance of the H4 support level at 0.9843 – the final take-profit line.
According to the weekly chart, the Swissy could potentially drive much lower from the weekly supply zone at 1.0092-0.9928. On top of this, the daily chart also shows room to depreciate further down to at least the daily support area at 0.9819-0.9784. Given this, if price closes below the current H4 support line today, we may, dependent on how the lower timeframe action responds (see the top of this report for a list of lower timeframe entry techniques we use), look to short any retest seen to the underside of this hurdle, down to 0.98 (located just within the aforementioned daily support area). Obviously though, one would need to pin down a relatively tight stop loss here in order to achieve reasonable risk/reward.
http://www.icmarkets.com/blog/wednesday-27th-july-daily-technical-outlook-and-review/
Levels to watch/live orders:
- Buys: Flat (Stop loss: N/A).
- Sells: Watch for price to close below the H4 support level at 0.9843 and look to trade any retest seen thereafter (lower timeframe confirmation required).
DOW 30:
Despite the index ranging over 100 points during yesterday’s sessions, the unit closed the day relatively unchanged. Consequent to this, much of the following analysis will echo similar thoughts put forward in Wednesday’s report…
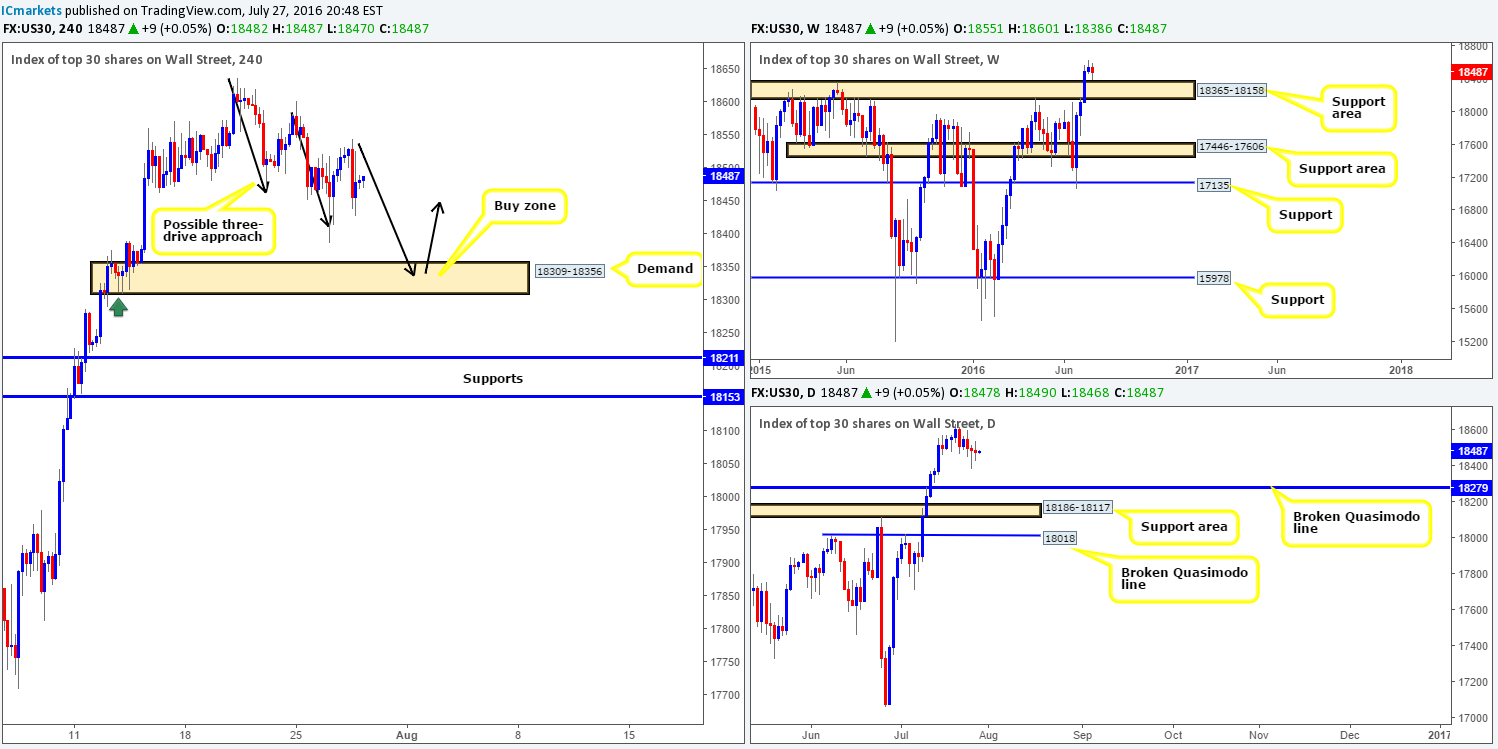
Beginning with a quick look at the weekly chart today, we can see that the index recently came within striking distance of hitting the top-side of a weekly support area at 18365-18158. According to daily price action, however, the DOW can potentially push further south down to a broken daily Quasimodo level at 18279, which as you can probably see, is positioned within the above said weekly support area.
Much the same as yesterday’s report guys, here is what we’re looking at on the H4 chart:
- Possible H4 three-drive approach forming en route to a H4 demand zone coming in at 18309-18356 (see black arrows).
- The tails seen marked on the H4 chart with a green arrow represent buying interest around this neighborhood, thus there is a strong possibility that there are unfilled orders still residing here.
- The current H4 demand base is also housed within a weekly support area drawn from 18365-18158, and sits just above a broken daily Quasimodo level at 18279.
Our suggestions: Despite the confluence seen around this H4 demand area, our team would still require a lower timeframe buy entry to form prior to risking capital, due to the possibility that price may fake beyond the aforementioned H4 demand into the broken daily Quasimodo line. What we mean by lower timeframe confirmation is simply either an engulf of supply followed by a subsequent retest, a trendline break/retest or simply a collection of well-defined buying tails around the higher timeframe zone. Stops are usually placed 5-10 pips beyond the confirming structure.
Levels to watch/live orders:
- Buys: 18309-18356 [Tentative – confirmation required] (Stop loss: dependent on where one confirms this area).
- Sells: Flat (Stop loss: N/A).
GOLD:
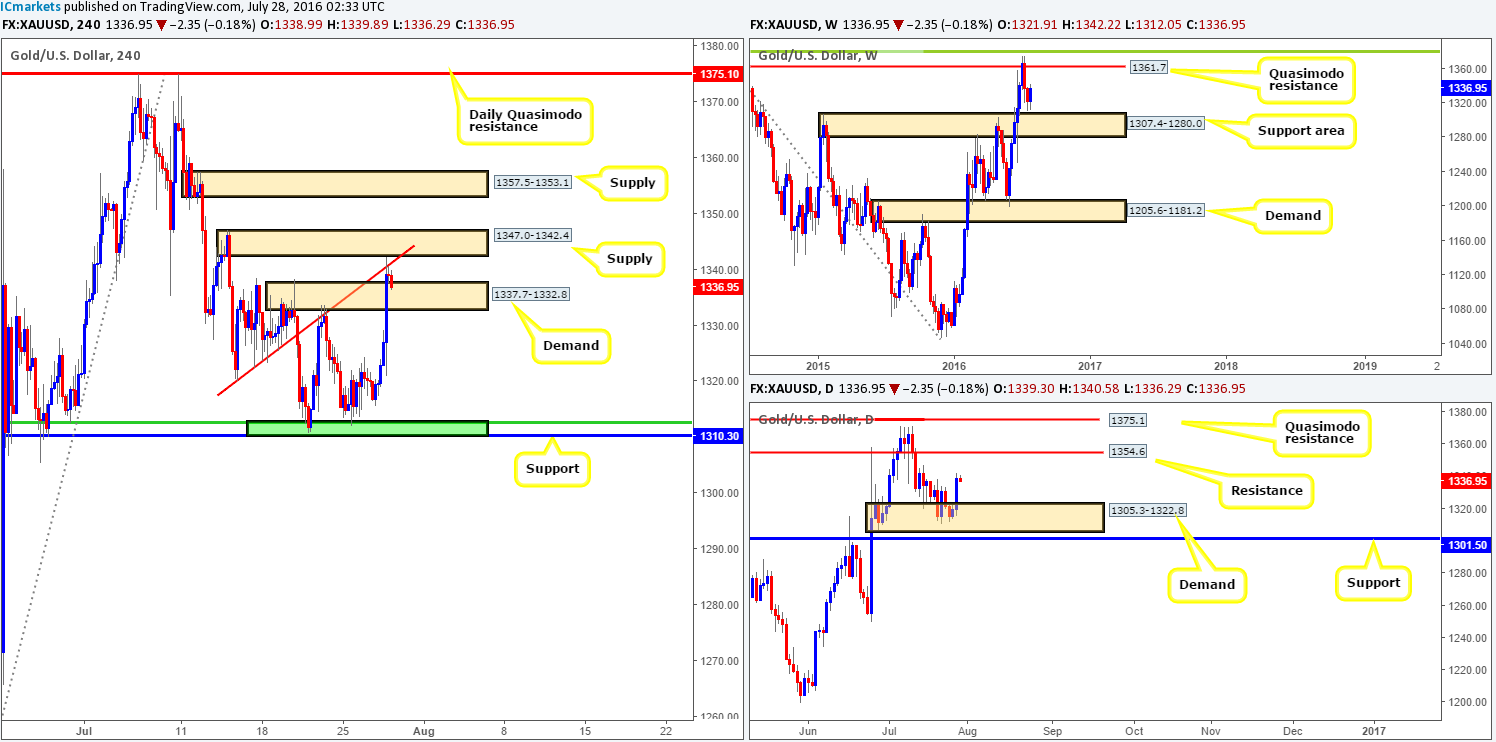
Overnight in the US session, the yellow metal aggressively advanced to fresh highs of 1342.2 after the Fed announced interest rates would be left unchanged. This move, as you can see, took out H4 supply drawn in at 1337.7-1332.8 (now acting demand) and tagged a H4 supply zone seen at 1347.0-1342.4 that merges with a H4 trendline swap extended from the low 1320.4. Although price has responded relatively well to the current H4 supply, we’re wary of looking to sell from here due to the following:
- Gold is now testing the recently broken H4 supply as demand at 1337.7-1332.8.
- Price recently rallied from a daily demand base drawn from 1305.3-1322.8.
- Weekly action shows price recently came within touching distance of hitting a weekly support area at 1307.4-1280.0.
Our suggestions: With higher timeframe structure suggesting further upside may be on the cards, a break above the current H4 supply may take place today. With that, our team will pass on selling from this area. For traders looking to buy above the H4 supply, you may want to note of the nearby H4 supply area above at 1357.5-1353.1, which envelopes a daily resistance line at 1354.6 (the next upside target on that timeframe). Therefore, entering long beyond the H4 supply zone does not leave one with much room to play with in regards to risk/reward. With that being the case, our team will remain flat going into today’s sessions.
Levels to watch/live orders:
- Buys: Flat (Stop loss: N/A).
- Sells: Flat (Stop loss: N/A).


