
A note on lower timeframe confirming price action…
Waiting for lower timeframe confirmation is our main tool to confirm strength within higher timeframe zones, and has really been the key to our trading success. It takes a little time to understand the subtle nuances, however, as each trade is never the same, but once you master the rhythm so to speak, you will be saved from countless unnecessary losing trades. The following is a list of what we look for:
- A break/retest of supply or demand dependent on which way you’re trading.
- A trendline break/retest.
- Buying/selling tails – essentially we look for a cluster of very obvious spikes off of lower timeframe support and resistance levels within the higher timeframe zone.
- Candlestick patterns. We tend to only stick with pin bars and engulfing bars as these have proven to be the most effective.
For us, lower timeframe confirmation starts on the M15 and finishes up on the H1, since most of our higher timeframe areas begin with the H4.
EUR/USD:
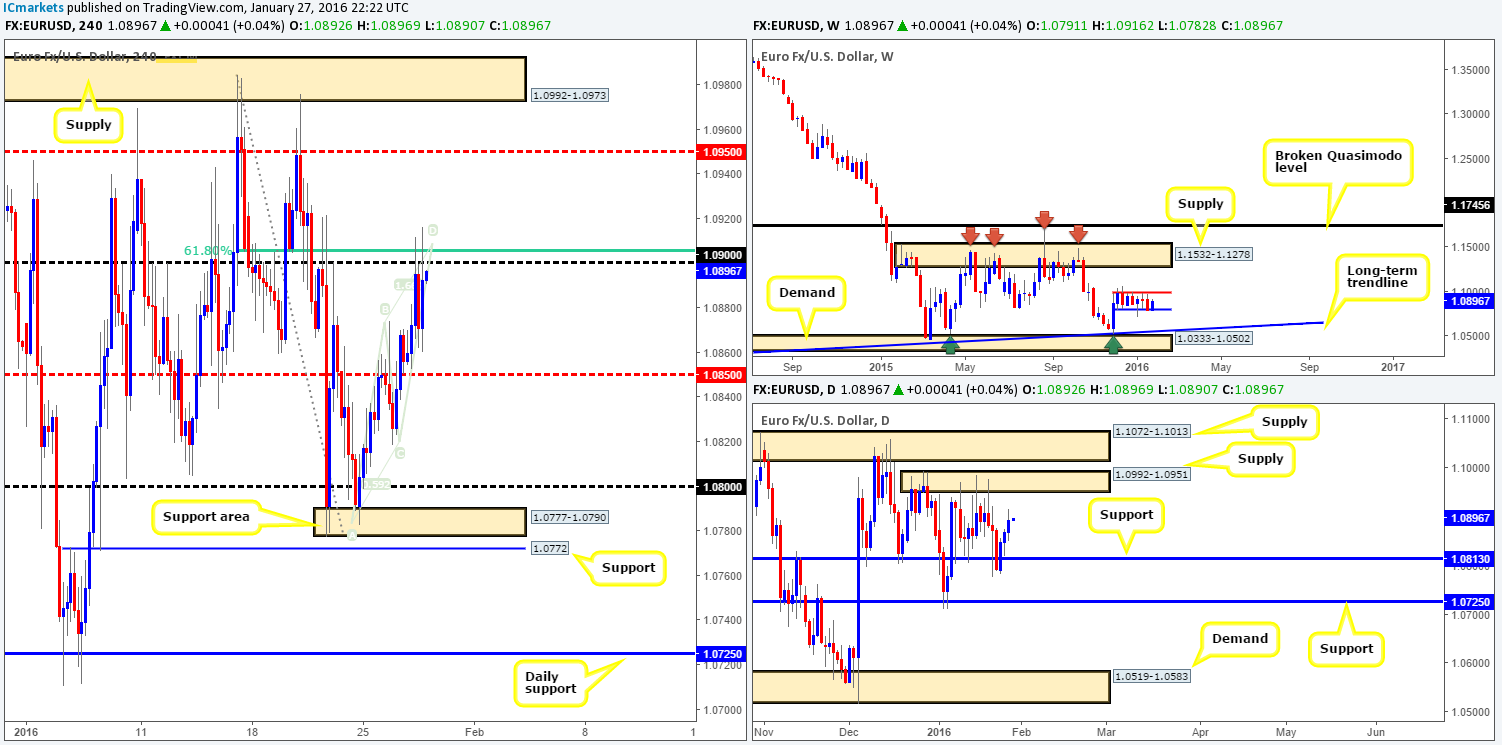
This morning’s analysis kicks-off with a look at the weekly timeframe which has recently seen its range expanded to 1.0796/1.0983 (blue/red lines). Beyond these barriers, however, we have our eye on the long-term trendline support extended from the low 1.0823 and the supply hanging above at 1.1532-1.1278. Zooming in and looking at the daily timeframe shows that the EUR printed its third consecutive bullish candle yesterday. Should this momentum continue, price could collide with supply penciled in at 1.0992-1.0951.
Turning our attention to the H4 timeframe, you may recall us mentioning in our previous report (http://www.icmarkets.com/blog/wednesday-27th-january-daily-technical-outlook-and-review/) to watch lower timeframe price action around the 1.0900 area. Reason being is alongside this psychological boundary sat a 61.8% Fibonacci level at 1.0906 and a H4 Harmonic AB=CD bearish pattern which completed around the 1.0907 mark. Our area was hit following the latest set of Fed minutes where, as expected, interest rates were left unchanged. Due to this sell zone being hit during news, there was little chance of securing a short without placing a pending order. Well done to any of our readers who managed to sell here, price hit its first take-profit level at 1.0861 relatively easily!
Given the structure seen on the higher timeframes at the moment (see above), there is a good chance that further buying is on the cards up to at least mid-level resistance 1.0950 today. Should this be the case and price closes above and retests 1.0900, our team would, depending on how the lower timeframes respond following the retest, look to buy this market. We would not hope for much more than 1.0950 on this one since this number marks the lower boundary of the above said daily supply zone. Therefore, in the event that the above comes to fruition, longs would be liquidated here, and we’d begin looking (confirmed) for shorts in between 1.0950 and the H4 supply above at 1.0992-1.0973 (located deeply within the aforementioned daily supply).
Levels to watch/live orders:
- Buys: Watch for offers to be consumed around 1.0900 and look to trade any retest seen thereafter (lower timeframe confirmation preferred).
- Sells: Looking to sell between 1.0950 and 1.0973 [Tentative – confirmation required] (Stop loss: dependent on where one confirms this area).
GBP/USD:
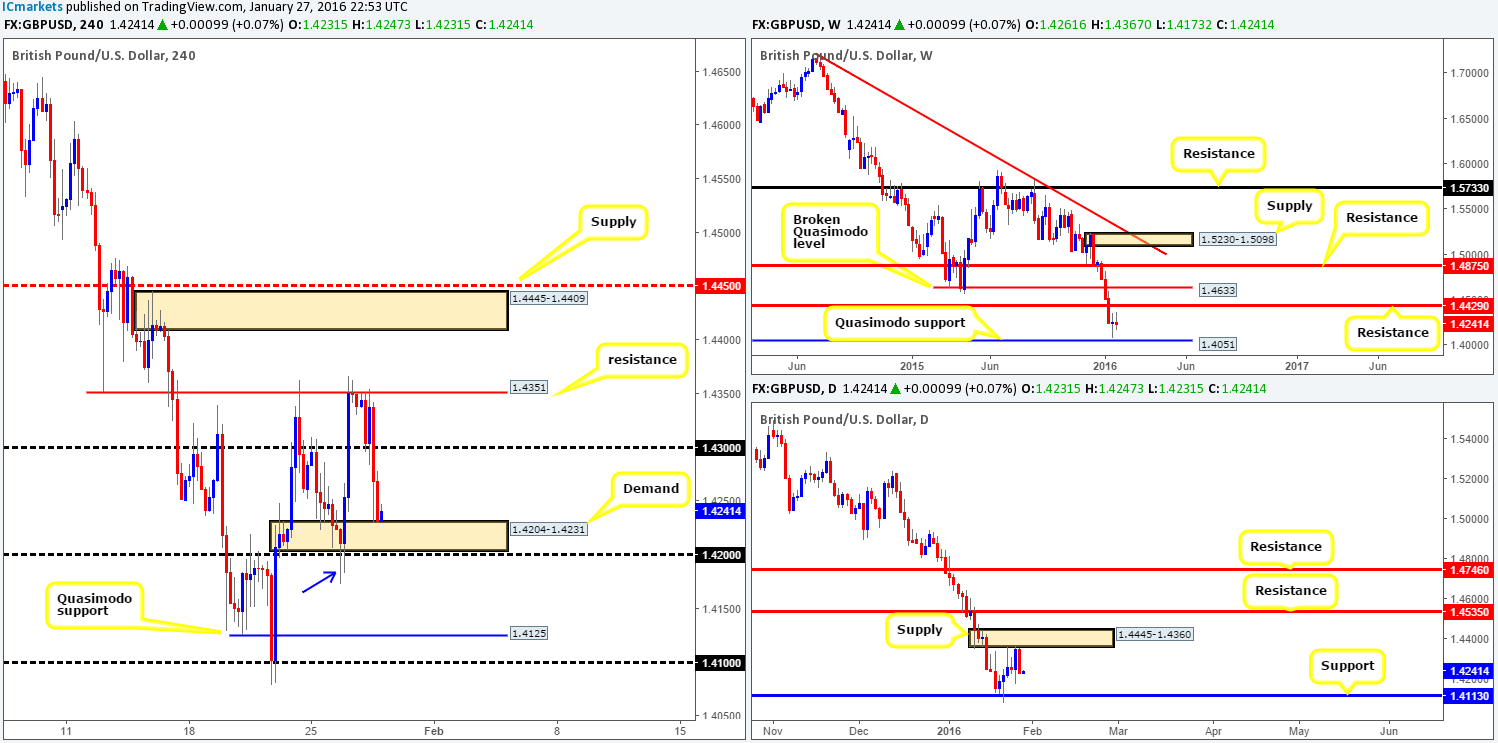
Pound Sterling cascaded lower yesterday as the U.S. opened its doors for business. Psychological support 1.4300 was engulfed with price ending the day nudging into H4 demand at 1.4204-1.4231, which as we write appears to be holding steady. On that note, would we consider this a stable enough platform in which to look for longs today? Well, the most we see this market bouncing to from here is psychological resistance 1.4300 and in all honesty that is being generous as far as we’re concerned. The reasons for why are as follows:
- The tail seen marked with a blue arrow at 1.4173 highlights a potential stop run through not only on the H4 demand at 1.4204-1.4231 but the 1.4200 figure just below it as well.
- Yesterday’s sell-off took place from daily supply at 1.4445-1.4360.
- Beyond 1.4200, there’s little support seen until 1.4125 – a H4 Quasimodo level.
Now, just to be clear, we’re not saying that bids are entirely weak around current prices, since the stop run itself likely created more bids (unfilled orders) as price moved very quickly from here. However, when price sells off from daily supply like it did yesterday, cautious trading is advised around the 1.4200 region!
For us personally, the only places (not including the H4 supply we discussed yesterday at 1.4445-1.4409) we’d feel comfortable looking for trades in this market at the moment is on a retest of 1.4200 following a close lower, targeting the H4 Quasimodo at 1.4125, which is in itself a valid buy zone. Not only does this Quasimodo fuse nicely with daily support at 1.4113, it also seen bolstered by psychological support 1.4100.
Levels to watch/live orders:
- Buys: 1.4125/1.4100 [Tentative – confirmation required] (Stop loss: dependent on where one confirms this area).
- Sells: Watch for bids to be consumed around 1.4200 and look to trade any retest seen thereafter (lower timeframe confirmation preferred).
AUD/USD:
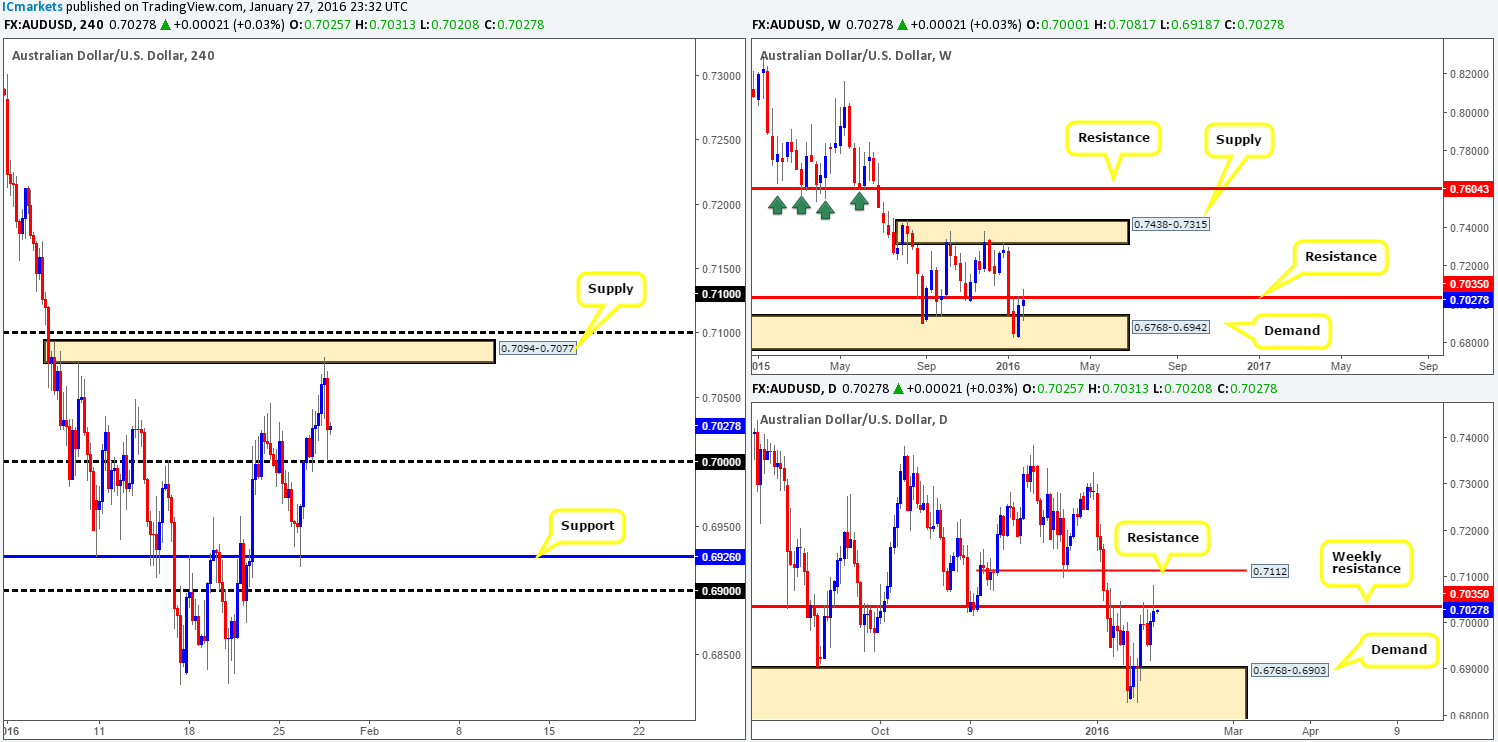
Starting from the top this morning, we can see that weekly action is currently teasing the underside of resistance drawn from 0.7035. Assuming that a close above this hurdle takes place by the week’s end, then the next objective to reach on this timeframe would likely be supply coming in at 0.7438-0.7315. Down on the daily timeframe, however, a break above the aforementioned weekly resistance has daily resistance at 0.7112 to target.
Stepping down to the H4 timeframe, supply at 0.7094-0.7077 held this market lower yesterday, forcing the commodity currency to touch gloves with the large psychological support 0.7000 into the close 0.7025. To our way of seeing things, a decision is needed to determine future direction – either a break above the aforementioned H4 supply and psychological resistance 0.7100 or a push below 0.7000. Of course, one could still look to trade in between these two barriers today before this decision is made – personally though we’d prefer the upper boundary due to where price on the weekly timeframe is trading right now (see above).
In the case of a break above 0.7100, traders may want to hold fire before buying since let’s not forget that there is resistance seen at 0.7112 on the daily timeframe! A slice through 0.7000 on the other hand is interesting since it opens the doors for price to challenge H4 support at 0.6926 which sits only a few pips above daily demand at 0.6768-0.6903.
Given the points made above, we’re going to be watching for shorts around the above said H4 supply/0.7100 area, and also for price to break below and retest 0.7000 for a possible (confirmed) short, targeting 0.6929.
Levels to watch/live orders:
- Buys: Flat (Stop loss: N/A).
- Sells: 0.7077/0.7100 region [Tentative – confirmation required] (Stop loss: dependent on where one confirms this area). Watch for bids to be consumed around 0.7000 and look to trade any retest seen thereafter (lower timeframe confirmation preferred).
USD/JPY:
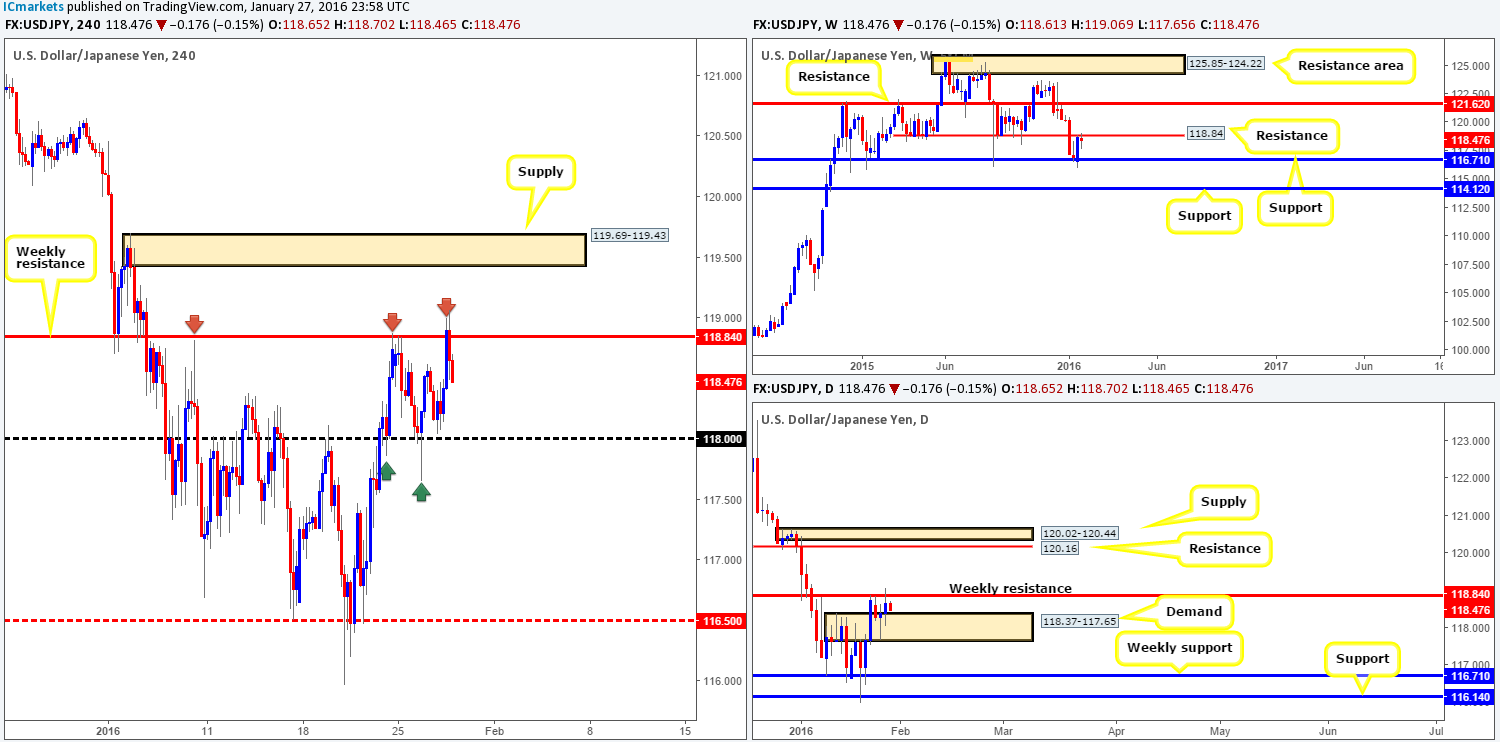
Following the Fed’s decision to leave rates unchanged yesterday, the USD/JPY fell sharply from weekly resistance fixed at 118.84, reaching lows of 118.48 by the day’s end. Consequent to this, price appears to be carving out a consolidation between the above said weekly level and psychological support 118.00. And due to 118.00 also seen bolstered by daily demand at 118.37-117.65, this level and the weekly resistance are potentially tradable zones today. As we have seen already though, fakeouts are highly likely around these numbers, so do trade with caution and consider only entering should you see proof of buying/selling strength on the lower timeframes beforehand.
In addition to trading within these two barriers, a close above 118.84 could, if the level is retested as support, be a nice platform in which to look for confirmed buys from. The first take-profit target from here can be seen at the H4 supply coming in at 119.69-119.43. Be that as it may, price could trade much higher than this area given the room seen above the weekly resistance on both the weekly and daily charts – the closest structure comes in at 120.16 (a daily resistance). Alternatively, a sustained move below 118.00 could pressure this market down to weekly support at 116.71/H4 mid-level support 116.50. Therefore, with a retest seen at the underside of this barrier alongside lower timeframe confirmation, we’d look to jump in short here.
Levels to watch/live orders:
- Buys: 118.00 [Tentative – confirmation required] (Stop loss: dependent on where one confirms this level). Watch for offers to be consumed around 118.84 and look to trade the any retest seen thereafter (lower timeframe confirmation required).
- Sells: 118.84 [Tentative – confirmation required] (Stop loss: dependent on where one confirms this level). Watch for bids to be consumed around 118.00 and look to trade the any retest seen thereafter (lower timeframe confirmation required).
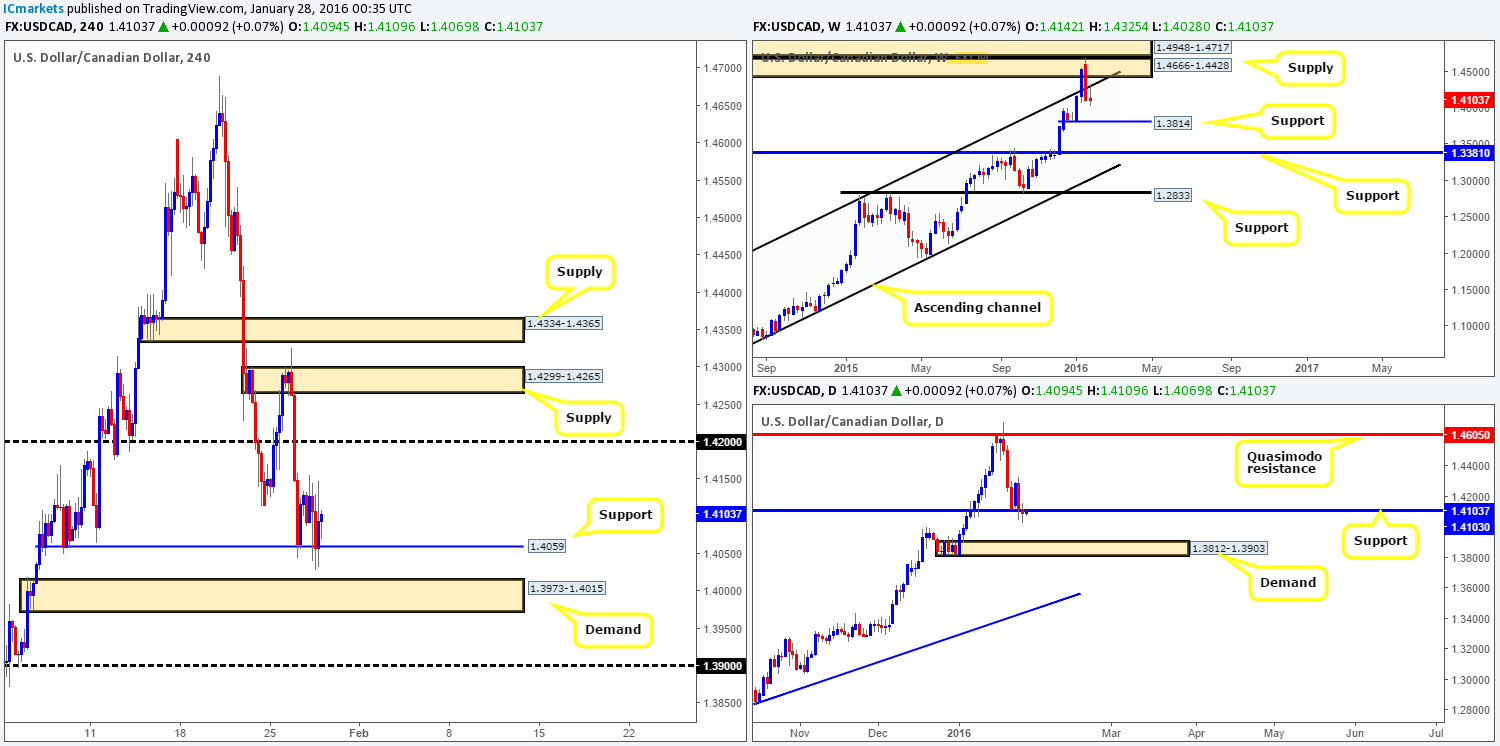
USD/CAD:
Coming at you directly from the weekly timeframe this morning, current action shows that price remains offered from the underside of the weekly channel resistance (1.1173). Should the sellers hold ground here, price could visit support coming in at 1.3814. Moving down a step lower to the daily timeframe, nevertheless, we can see that yesterday’s flow forced price to close below support at 1.4103 and print an indecision candle. In the event that the close here is legit, it is likely the Loonie will head south to greet demand penciled in at 1.3812-1.3903 (encapsulates weekly support at 1.3814).
Scrolling across to the H4 timeframe, it’s relatively clear to see that action was somewhat limited yesterday as price spent the day teasing H4 support at 1.4059. Now, with the weekly showing further selling is possible and price clearly struggling to hold at daily support (see above), it’s likely that the current H4 support is going to cave in sooner or later. This leaves the H4 demand seen below at 1.3973-1.4015 and psychological support 1.3900 in view.
From our perspective, we favor the 1.3900 figure over the H4 demand for a bounce. The reason being is simply due to the fact that 1.3900 represents the top-side of daily demand drawn from 1.3812-1.3903. As such, 1.3900 is the only number noted down on our watch list for the time being.
Levels to watch/live orders:
- Buys: 1.3900 [Tentative – confirmation required] (Stop loss: dependent on where one confirms this level).
- Sells: Flat (Stop loss: N/A).
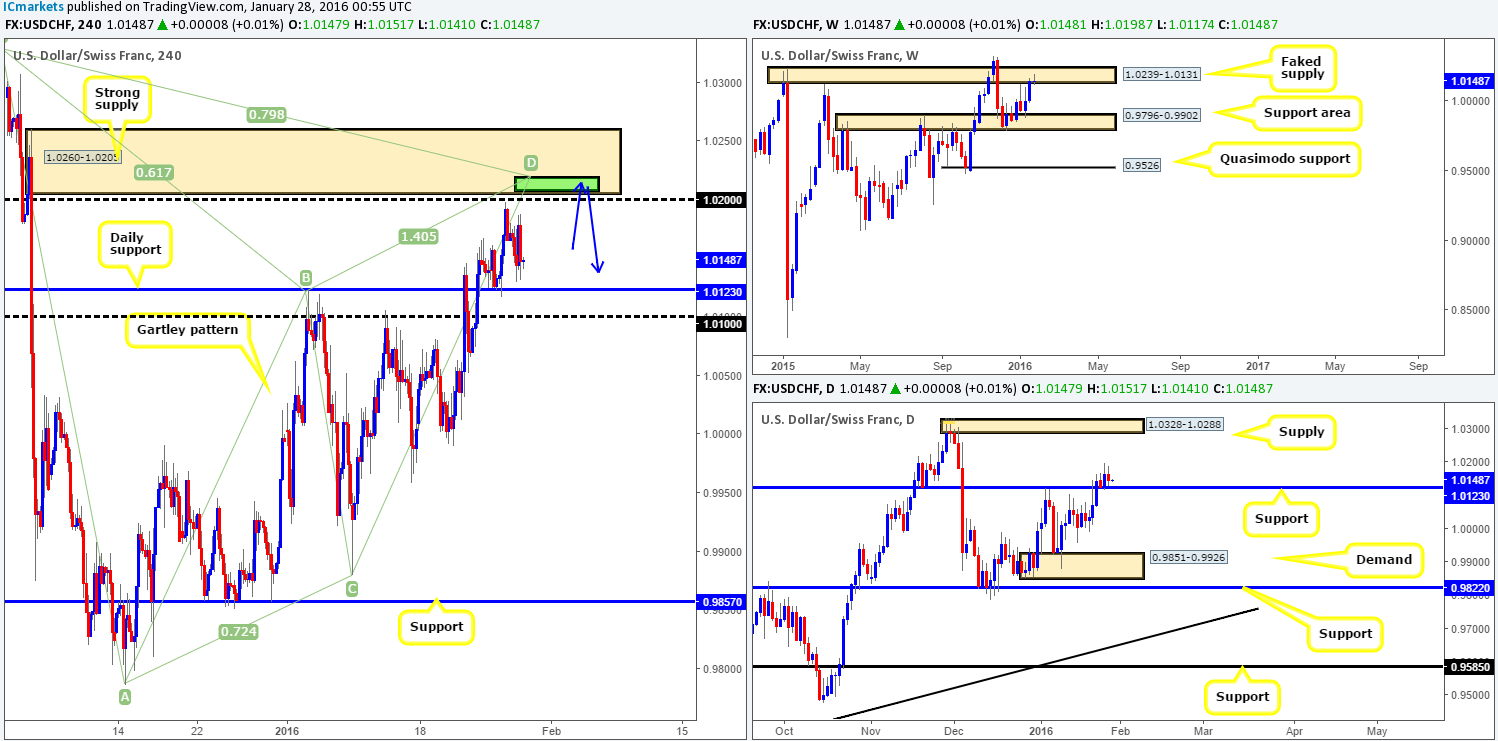
USD/CHF:
The USD/CHF pair, as you can see, was not very active during the course of yesterday’s trading. Session highs were recorded at 1.0188 and lows came in around the 1.0130 mark. Consequent to this rather lackluster performance, much of the following analysis will be similar to Wednesday’s report.
Although price is seen trading above daily support at 1.0123 right now, the weekly chart shows that price is also trading from the underside of a faked supply area coming in at 1.0239-1.0131. This – coupled with a mouthwatering H4 supply lurking just above at 1.0260-1.0205, which boasts not only a psychological resistance level seen at 1.0200 but also a H4 Harmonic Gartley pattern completion point between 1.0207/1.0218 (green area), we’re looking to short from 1.0203 today.
Levels to watch/live orders:
- Buys: Flat (Stop loss: N/A).
- Sells: 1.0203 [Pending order] (Stop loss: 1.0264).
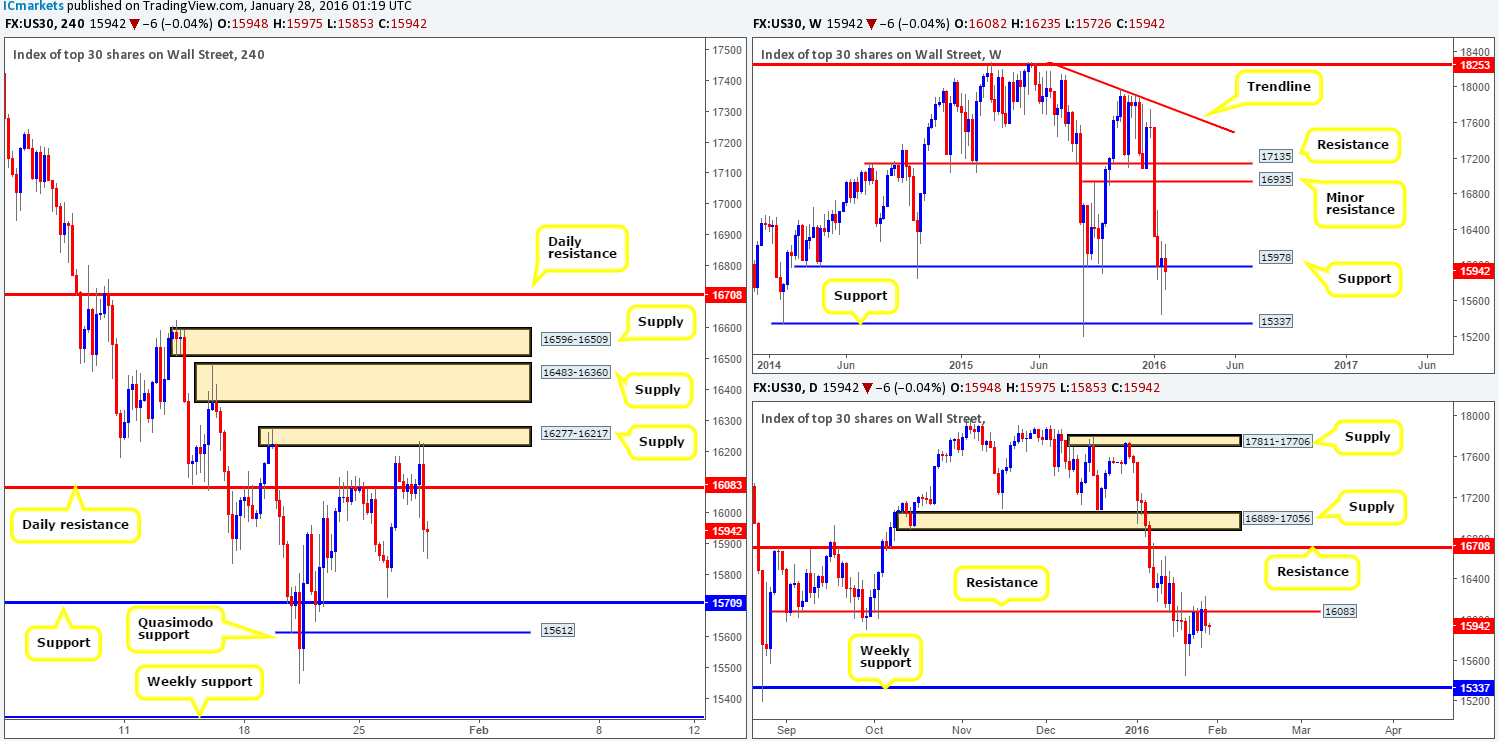
DOW 30:
Beginning with the weekly timeframe this morning, support at 15978 appears weak right now as price tumbles below the level once again. The next area of support we have noted falls in at 15337. On the other side of the ledger, we can see that daily action is currently holding firm around resistance drawn from 16083, which is likely the reason (technically) why the weekly level is struggling at the moment. Downside targets from here come in around weekly support penciled in at 15337.
Focusing our attention on the H4 shows that price actually sold off beautifully from supply fixed between 16277-16217 yesterday, reaching lows of 15875 by the end of the day. Honestly, the DOW is not really printing favorable price action at present, making it very difficult to read…
On the one hand, we have weekly support still in play, albeit struggling, but still in the game. On the other hand, daily resistance is holding firm and the H4 shows room to continue moving lower to at least the 15709 region. This leaves traders in a precarious position – sell into weekly support or buy into daily resistance?!?! One could say that shorts seem the best bet due to the room being seen to move lower, but going against weekly flow (even if it appears weak) is not really something you want playing the back of your mind when money is on the line. With that being the case, remaining flat until clearer price action is presented is the route we’ve chosen to take today.
Levels to watch/live orders:
- Buys: Flat (Stop loss: N/A).
- Sells: Flat (Stop loss: N/A).
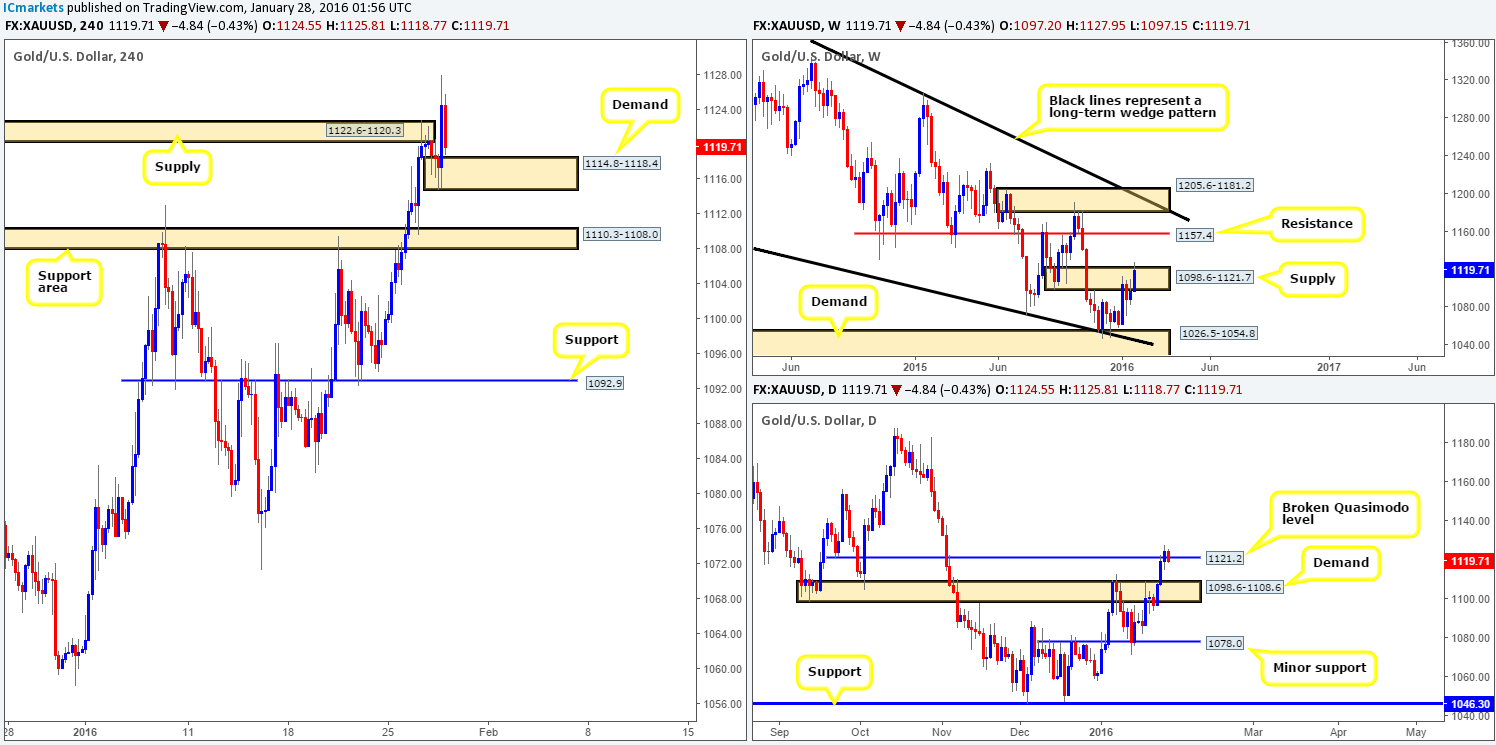
XAU/USD: (Gold)
For those who read our previous report on Gold (http://www.icmarkets.com/blog/wednesday-27th-january-daily-technical-outlook-and-review/), you may recall us mentioning to keep an eye on lower timeframe price action to short from H4 supply at 1122.6-1120.3. There was a beautiful entry seen on the M15 around 03.30am GMT yesterday, which we’re sorry to say we missed! Well done to anyone who caught this short-term bounce, the risk/reward was very attractive.
Shortly after, however, the yellow metal aggressively punched north on the back of the Fed’s decision to leave rates unchanged. This, as can be seen from the H4 chart, punched through offers at the aforementioned supply, ending the day closing higher at 1124.5. This move clearly did not attract further buying though as Gold is selling off as we write, heading in the direction of a newly-formed H4 demand at 1114.8-1118.4.
This selling may have something to do with the fact that price is actually teasing the top side of a weekly supply area at 1098.6-1121.7 right now. Be that as it may, the recent surge in buying closed prices above a broken daily Quasimodo line at 1121.2, which could very well act as support now.
So, let’s just run through what we have here. There’s the weekly teasing the upper limit of supply, daily may see supportive pressure come in from the recently broken Quasimodo line and H4 action currently approaching demand (all levels can be found above). Personally, we like the look of the current H4 demand, and considering that price spiked above weekly supply, potentially removing stops and clearing the path higher, longs could be possible from here today. To that end, our prime focus today will consist of looking for lower timeframe buy entries within H4 demand at 1114.8-1118.4.
Levels to watch/live orders:
- Buys: 1114.8-1118.4 [Tentative – confirmation required] (Stop loss: dependent on where one confirms this area).
- Sells: Flat (Stop loss: N/A).


